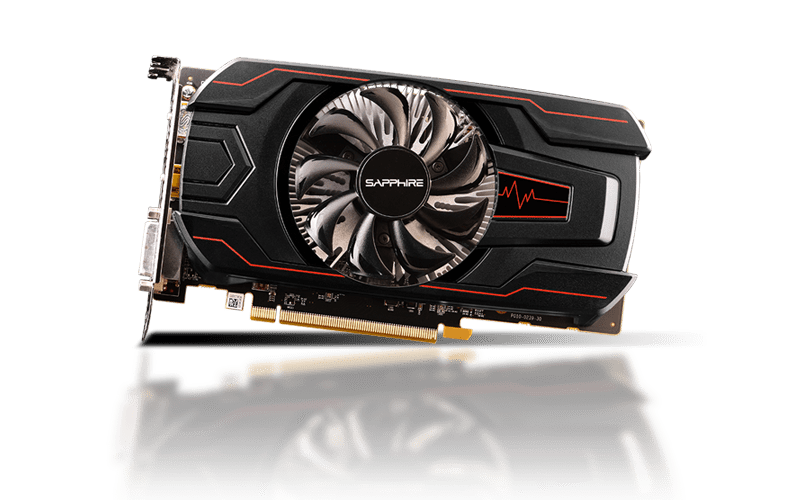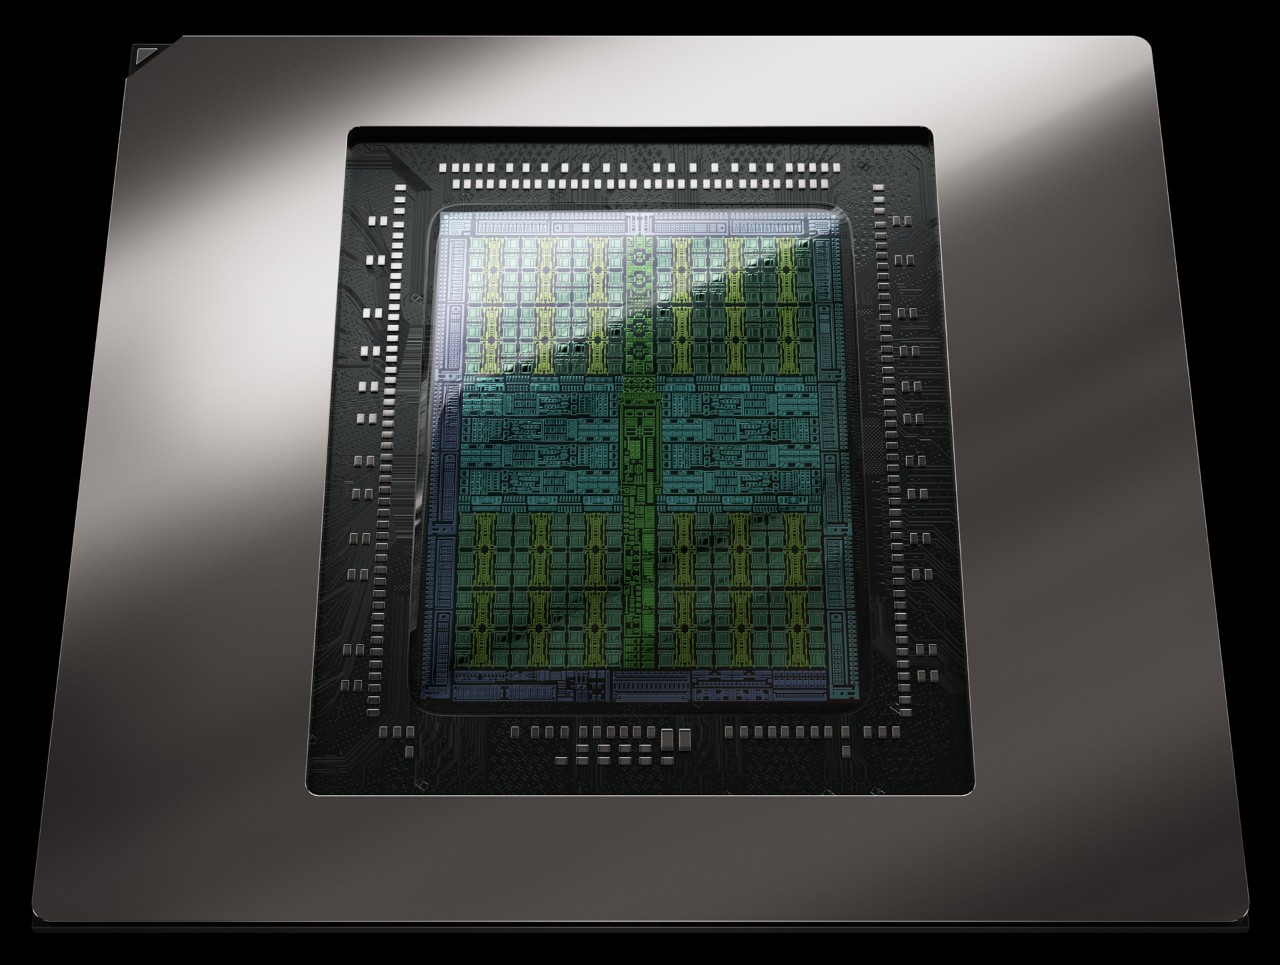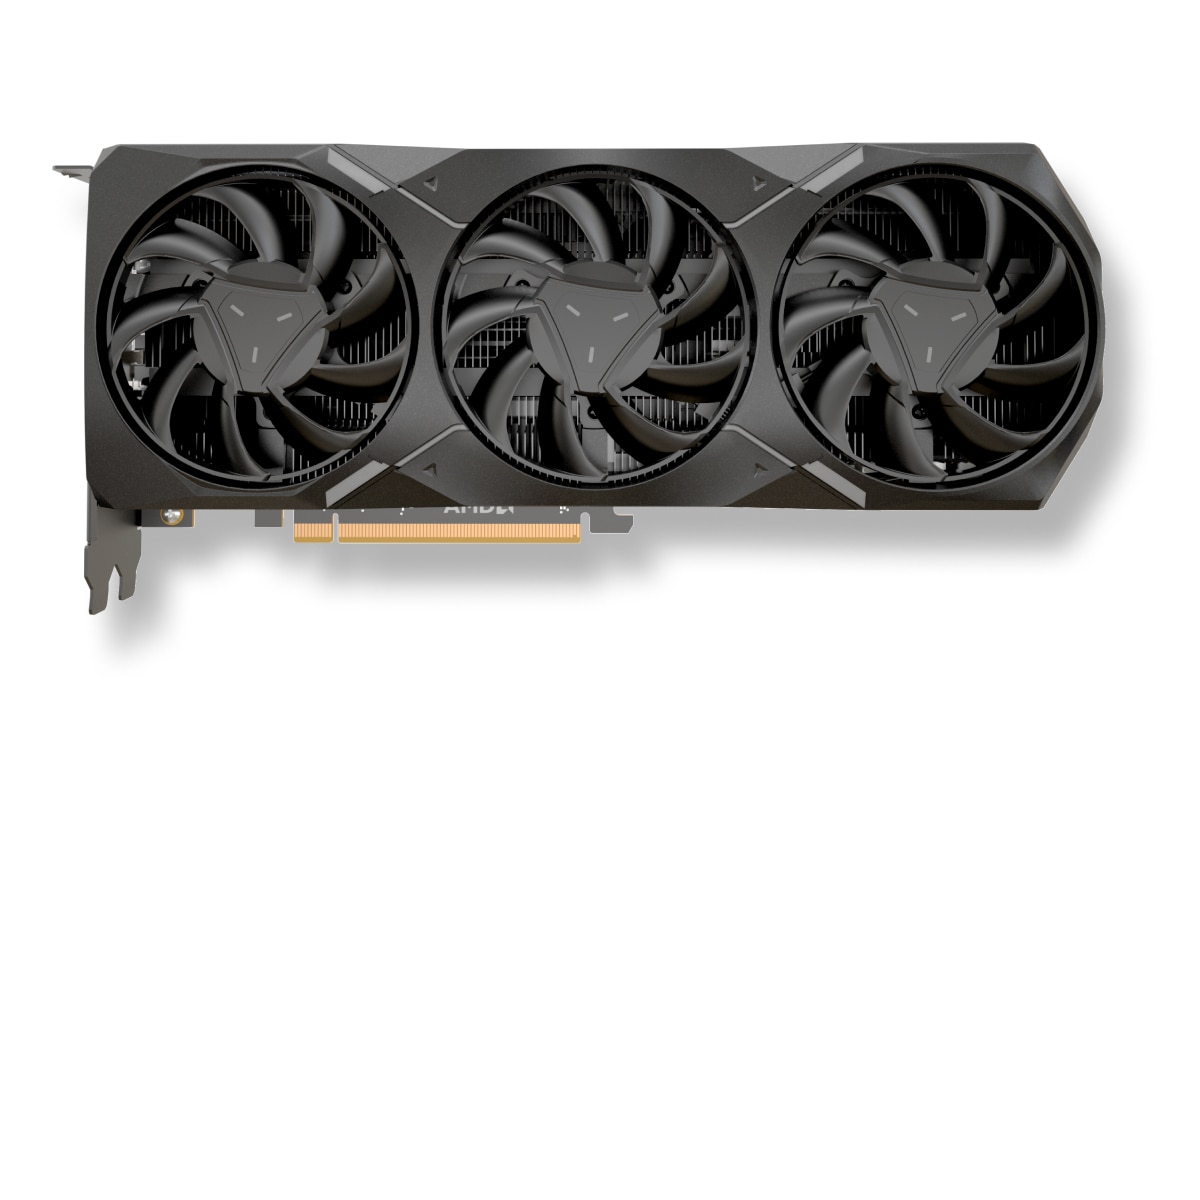
What's the best choice AMD Radeon RX 6750 XT or AMD Radeon RX 7900 GRE? Which graphics card is faster?
Compare the available specifications of these models.
AMD Radeon RX 6750 XT has a base frequency of 2.15 GHz. Memory size 12 GB. Memory type GDDR6. Released in 2022-05-10.
AMD Radeon RX 7900 GRE Memory size 16 GB. Memory type GDDR6. Released in 2023-07-27.
Reasons to consider Place in the overall ranking
(based on several benchmarks)
 place
Common positions AMD Radeon RX 6750 XT GPU in popular benchmarks, for comparison with other models.
Reasons to consider More memory
33% more memory
 12 GB
AMD Radeon RX 6750 XT
Comparison of basic technical data of graphics cards AMD Radeon RX 6750 XT and AMD Radeon RX 7900 GRE, chip, information processing units.
 AMD Radeon RX 7900 GRE
80
80
-
80
-
5120
-
160
RDNA 3
Video memory capacity, type, bus width and bandwidth describe different properties. These values alone do not determine graphics performance.
64 MB
576 GB/s
256 bit
-
18 Gbps
16 GB
GDDR6
Published GPU clock frequencies describe different operating modes. Clock speed alone does not determine graphics performance.
-
2245 MHz
1880 MHz
-
Graphics card power limits and recommended system power supply describe different specifications.
-
-
260 W
-
260 W
Types and sizes of coolers for graphics card cooling system AMD Radeon RX 6750 XT and AMD Radeon RX 7900 GRE.
-
-
-
-
-
-
Connectivity and connections.
-
-
-
-
2.1
-
-
2x8-Pin
-
-
2.1
Technical data that is used to its full potential in computer games.
-
-
-
-
-
Built-in support for video and image compression standards.
Decode / Encode
-
-
-
-
The difference in size, weight and slot of the compared devices
-
-
-
-
-
Comparison of interfaces and release dates for GPU AMD Radeon RX 7900 GRE and AMD Radeon RX 6750 XT.
-
-
-
-
2023-07-27
46 TFLOPS
Shared tests with results for both models: 11
Each row uses one Blender version, operating system and compute backend.
| Test and settings | AMD Radeon RX 6750 XT | AMD Radeon RX 7900 GRE | Result difference¹ |
|---|---|---|---|
| Blender 5.1.1 / HIP / Windows | 1773.294966 samples/min Submissions: 5 | 3362.628167 samples/min Submissions: 6 | +89.6 % |
| Blender 4.5.0 / HIP / Windows | 1543.348166 samples/min Submissions: 22 | 2904.040829 samples/min Submissions: 41 | +88.2 % |
| Blender 4.4.0 / HIP / Linux | 1537.197129 samples/min Submissions: 6 | 2522.33331 samples/min Submissions: 7 | +64.1 % |
| Blender 4.4.0 / HIP / Windows | 1544.842826 samples/min Submissions: 30 | 2755.073764 samples/min Submissions: 23 | +78.3 % |
| Blender 4.3.0 / HIP / Linux | 1709.784049 samples/min Submissions: 16 | 2850.718761 samples/min Submissions: 13 | +66.7 % |
| Blender 4.3.0 / HIP / Windows | 1651.191972 samples/min Submissions: 43 | 2779.253387 samples/min Submissions: 36 | +68.3 % |
| Blender 4.2.0 / HIP / Linux | 1725.322462 samples/min Submissions: 28 | 2892.788612 samples/min Submissions: 13 | +67.7 % |
| Blender 4.2.0 / HIP / Windows | 1662.164399 samples/min Submissions: 39 | 2811.331019 samples/min Submissions: 36 | +69.1 % |
| Blender 4.1.0 / HIP / Linux | 1693.192703 samples/min Submissions: 8 | 2638.239746 samples/min Submissions: 6 | +55.8 % |
| Blender 4.1.0 / HIP / Windows | 1685.260323 samples/min Submissions: 20 | 2795.052261 samples/min Submissions: 22 | +65.9 % |
| Blender 4.0.0 / HIP / Windows | 1606.147107 samples/min Submissions: 49 | 2609.153346 samples/min Submissions: 16 | +62.4 % |
¹ Difference of the second result relative to the first in that row. No percentage is calculated for different upscaling algorithms. This compares published results, not a universal performance index.
These results have no shared test of both models with the same version and settings. They are shown separately without a percentage difference.


 Russian
 German
 Portuguese
 Italian
 French
 Japan
 Spanish
 Polish
 Chinese
 Korean