Was ist die beste Wahl? Intel Core i5-13450HX oder AMD Ryzen 7 9700X? Welcher Prozessor ist schneller?
Compare the available specifications of these models.
Intel Core i5-13450HX has a base frequency of 1.40 GHz (4.60 GHz). 10 / 16 CPU Cores / Threads. Stated TDP / base power 55 W. Freigegeben in Q4/2022.
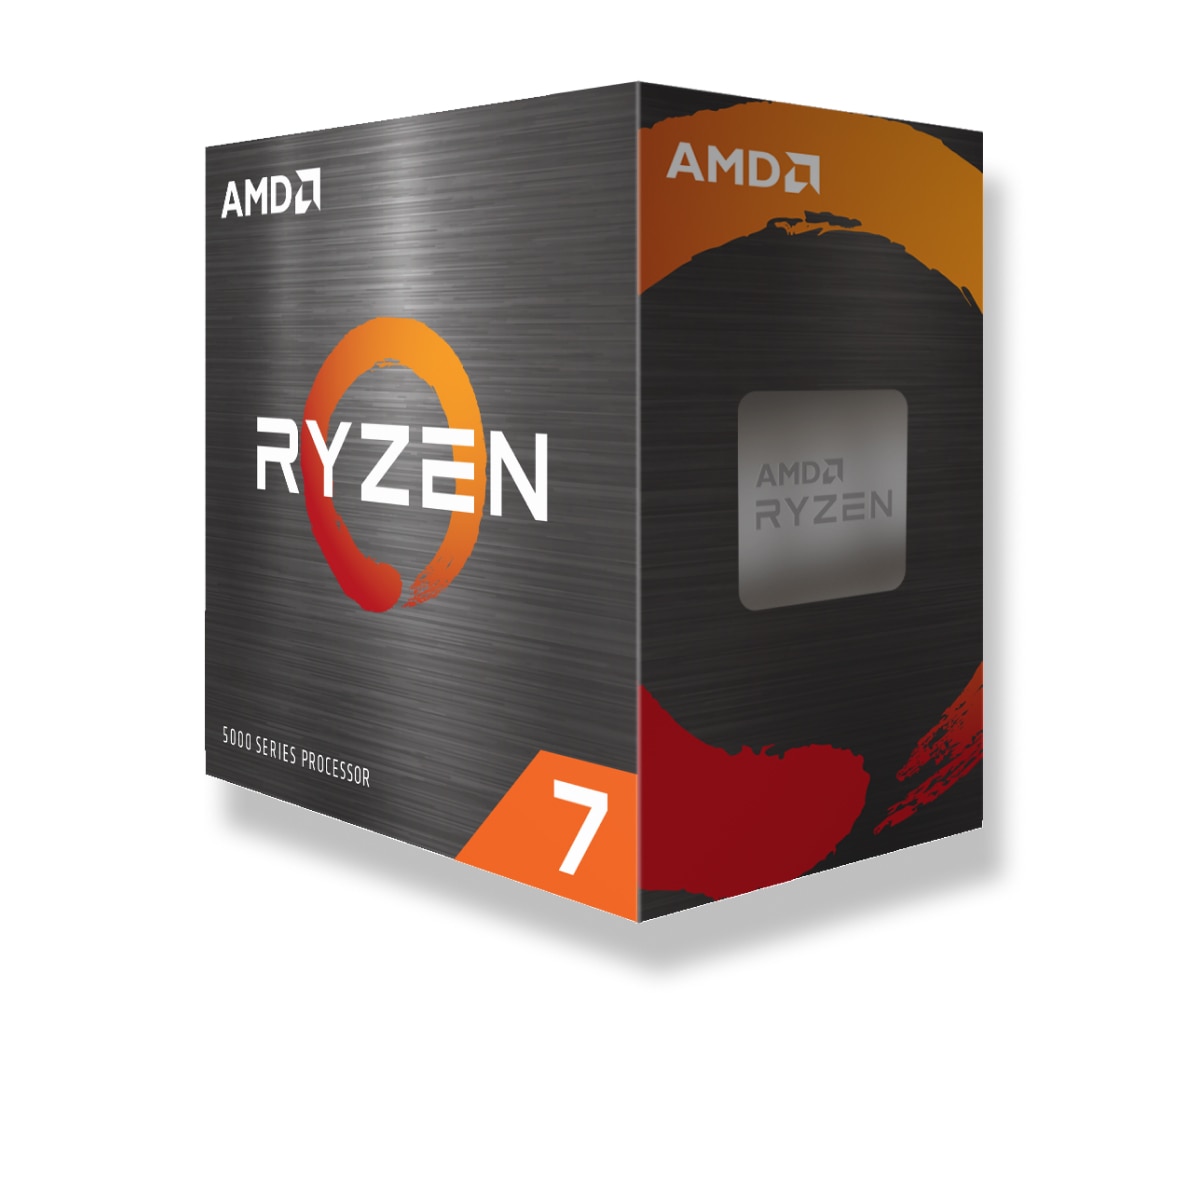
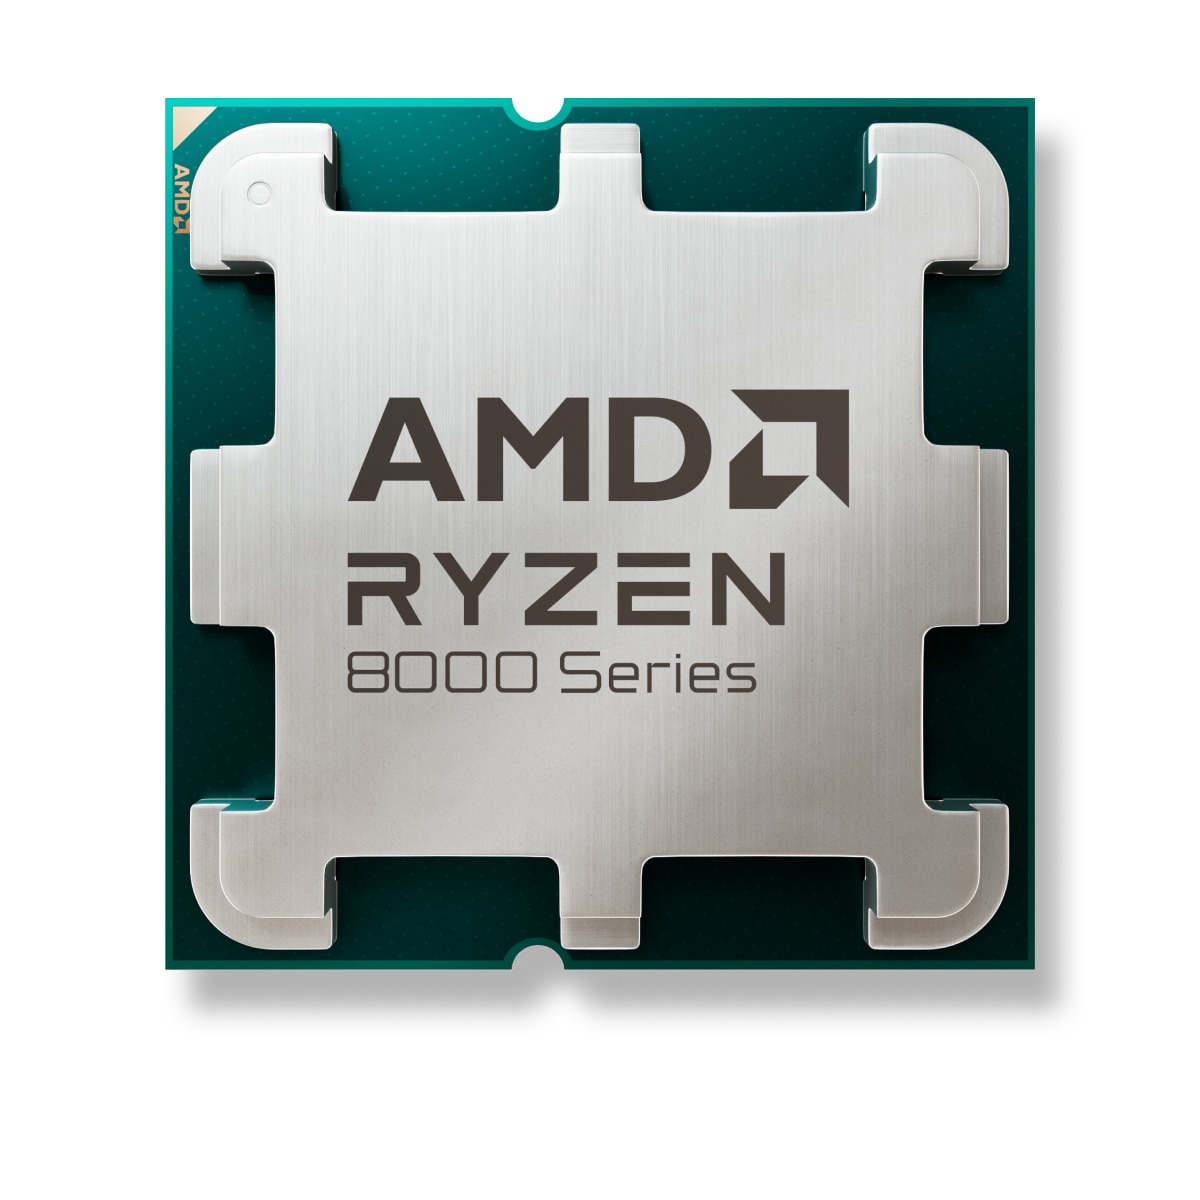
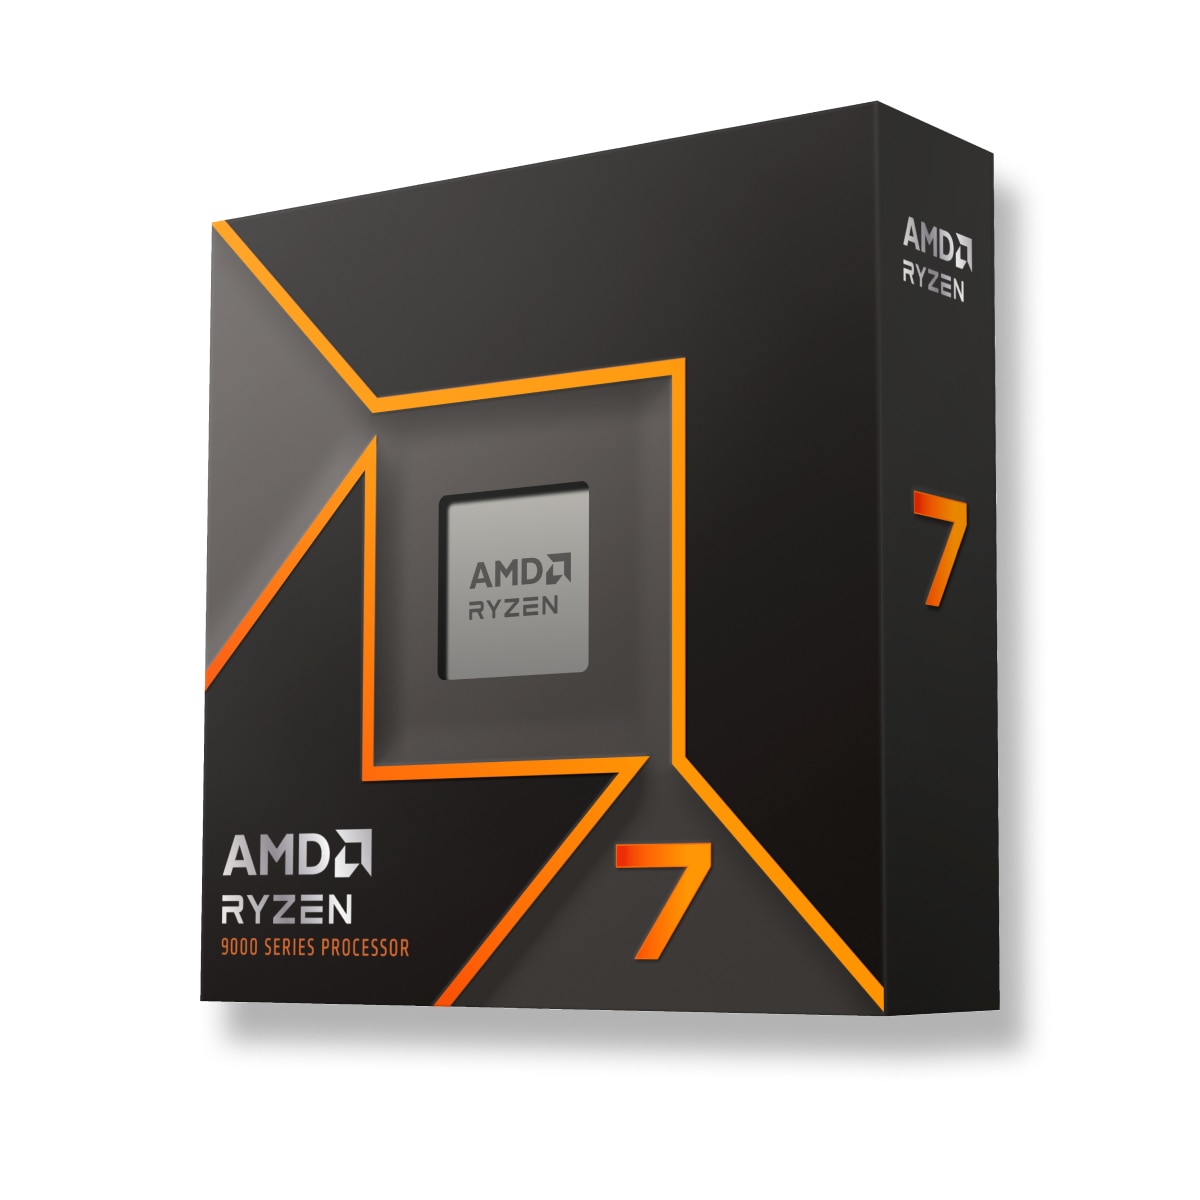
AMD Ryzen 7 9700X has a base frequency of 3.8 GHz. 8 / 16 CPU Cores / Threads. Stated TDP / base power 65 W. Freigegeben in 2024-08-08.
Gründe für die Berücksichtigung Größere Anzahl von Kernen
2 more cores
 8
Lower stated TDP / base power
Power limits alone do not measure performance per watt.
65 W
Gemeinsame Standpunkte Intel Core i5-13450HX CPU in gängigen Benchmarks, zum Vergleich mit anderen Modellen.
Gründe für die Berücksichtigung
Intel Core i5-13450HX
Hintergrundinformationen zu den verglichenen Prozessoren, Serien, Generationen und Marktsegmenten.
 -
Ryzen
-
-
Desktop
Desktops / Boxed Processor
Ryzen 9000 Series
Core counts, threads, cache and clock modes describe the CPU configuration. Performance depends on the workload and comparable measured results.
-
-
-
-
-
8
16
-
Ja
3.8 GHz
5.5 GHz
5.5 GHz
Interne Grafik beeinträchtigt nicht die Leistung der CPU, sondern übernimmt die Arbeit der Grafikkarte bei deren Abwesenheit oder auf mobilen Geräten.
-
-
-
2200 MHz
AMD Radeon Graphics
-
-
-
-
-
-
2
Integrierte Codecs für die Kodierung und Dekodierung von Inhalten. Erhebliche Beschleunigung der erforderlichen Vorgänge.
-
-
-
-
-
-
-
-
Typen, Kanalmenge des RAM, unterstützt von AMD Ryzen 7 9700X und Intel Core i5-13450HX. Je nach Motherboard können höhere oder niedrigere Speicherfrequenzen unterstützt werden.
-
-
-
2
DDR5
PCIe 5.0
-
Vergleichen Sie die TDP-Anforderungen von TDP Intel Core i5-13450HX und AMD Ryzen 7 9700X Power specifications describe different manufacturer limits. TDP, base power and maximum turbo power are separate values; they do not establish measured system consumption.
95 °C
-
-
-
-
65 W
65 W
Architektur, Schnittstellen, zusätzliche Anweisungen, die von Intel Core i5-13450HX und AMD Ryzen 7 9700X, Technologien für virtuelle Maschinen und Verfahrenstechnik.
Zen 5
-
-
-
8 MB
32 MB
-
2024-08-08
AM5
TSMC 4nm FinFET
-
Granite Ridge AM5
TSMC 6nm FinFET
Shared tests with results for both models: 8
Each row uses one Blender version, operating system and compute backend.
| Test and settings | Intel Core i5-13450HX | AMD Ryzen 7 9700X | Result difference¹ |
|---|---|---|---|
| Blender 5.2.0 / CPU / Windows | 189.649538 samples/min Submissions: 14 | 308.060499 samples/min Submissions: 57 | +62.4 % |
| Blender 5.1.1 / CPU / Windows | 191.169363 samples/min Submissions: 12 | 320.473967 samples/min Submissions: 81 | +67.6 % |
| Blender 4.5.0 / CPU / Linux | 227.473124 samples/min Submissions: 34 | 334.163366 samples/min Submissions: 36 | +46.9 % |
| Blender 4.5.0 / CPU / Windows | 180.832808 samples/min Submissions: 77 | 304.57062 samples/min Submissions: 403 | +68.4 % |
| Blender 4.4.0 / CPU / Windows | 185.99406 samples/min Submissions: 22 | 282.660046 samples/min Submissions: 115 | +52.0 % |
| Blender 4.3.0 / CPU / Windows | 187.499397 samples/min Submissions: 23 | 279.963397 samples/min Submissions: 158 | +49.3 % |
| Blender 4.2.0 / CPU / Windows | 182.067147 samples/min Submissions: 40 | 286.426028 samples/min Submissions: 109 | +57.3 % |
| Blender 4.1.0 / CPU / Windows | 191.829731 samples/min Submissions: 24 | 306.671773 samples/min Submissions: 5 | +59.9 % |
¹ Difference of the second result relative to the first in that row. No percentage is calculated for different upscaling algorithms. This compares published results, not a universal performance index.
These results have no shared test of both models with the same version and settings. They are shown separately without a percentage difference.
Published measurements are separate from the archived index. Incomplete conditions and unknown run counts do not support ranking positions or calculated performance differences.
| Model | Test | Result | Reported conditions |
|---|---|---|---|
| AMD Ryzen 7 9700X | Cinebench 2024 / multi-core | 1203 points | Graphics card: GeForce RTX 4090 System RAM: 32 GB |
| AMD Ryzen 7 9700X | Cinebench 2024 / single-core | 136 points | Graphics card: GeForce RTX 4090 System RAM: 32 GB |
| AMD Ryzen 7 9700X | Cinebench R15 / multi-core | 3178 points | Graphics card: GeForce RTX 4090 System RAM: 32 GB |
| AMD Ryzen 7 9700X | Cinebench R15 / single-core | 346 points | Graphics card: GeForce RTX 4090 System RAM: 32 GB |
| AMD Ryzen 7 9700X | Cinebench R20 / multi-core | 7956 points | Graphics card: GeForce RTX 4090 System RAM: 32 GB |
| AMD Ryzen 7 9700X | Cinebench R20 / single-core | 870 points | Graphics card: GeForce RTX 4090 System RAM: 32 GB |
| AMD Ryzen 7 9700X | Cinebench R23 / multi-core | 20485 points | Graphics card: GeForce RTX 4090 System RAM: 32 GB |
| AMD Ryzen 7 9700X | Cinebench R23 / single-core | 2211 points | Graphics card: GeForce RTX 4090 System RAM: 32 GB |
| AMD Ryzen 7 9700X | RandomX / XMRig 6.22.2 / 10M / 16 threads | 14490.17 H/s | System RAM: 64 GB OS: Windows NT 10.0 Motherboard: ASRock / B850I Lightning WiFi Duration: 690.123 s |
Results were obtained on the reported systems. Test versions and settings remain separate; incomplete conditions do not support calculated model performance differences.
| Model | Result | Reported conditions |
|---|---|---|
| AMD Ryzen 7 9700X | 10994.568683 H/s | RandomX / XMRig 6.26.0 / 1M / 16 threads / windows System RAM: 32 GB OS: Windows NT 10.0 Motherboard: Gigabyte Technology Co., Ltd. / B850 AORUS ELITE WIFI7 Duration: 90.954 s User-submitted run; tuning and power settings are incomplete. |
| Model | Result | Reported conditions |
|---|---|---|
| Intel Core i5-13450HX | 5433.459679 H/s | RandomX / XMRig 6.24.0 / 10M / 14 threads / windows System RAM: 16 GB OS: Windows NT 10.0 Motherboard: Dell Inc. / 04TT83 Duration: 1840.448 s User-submitted run; tuning and power settings are incomplete. |


 English
 Russian
 Portuguese
 Italian
 French
 Japan
 Spanish
 Polish
 Chinese
 Korean