What's the best choice Intel Core i5-13450HX or AMD Ryzen 7 9700X? Which processor is faster?
Compare the available specifications of these models.
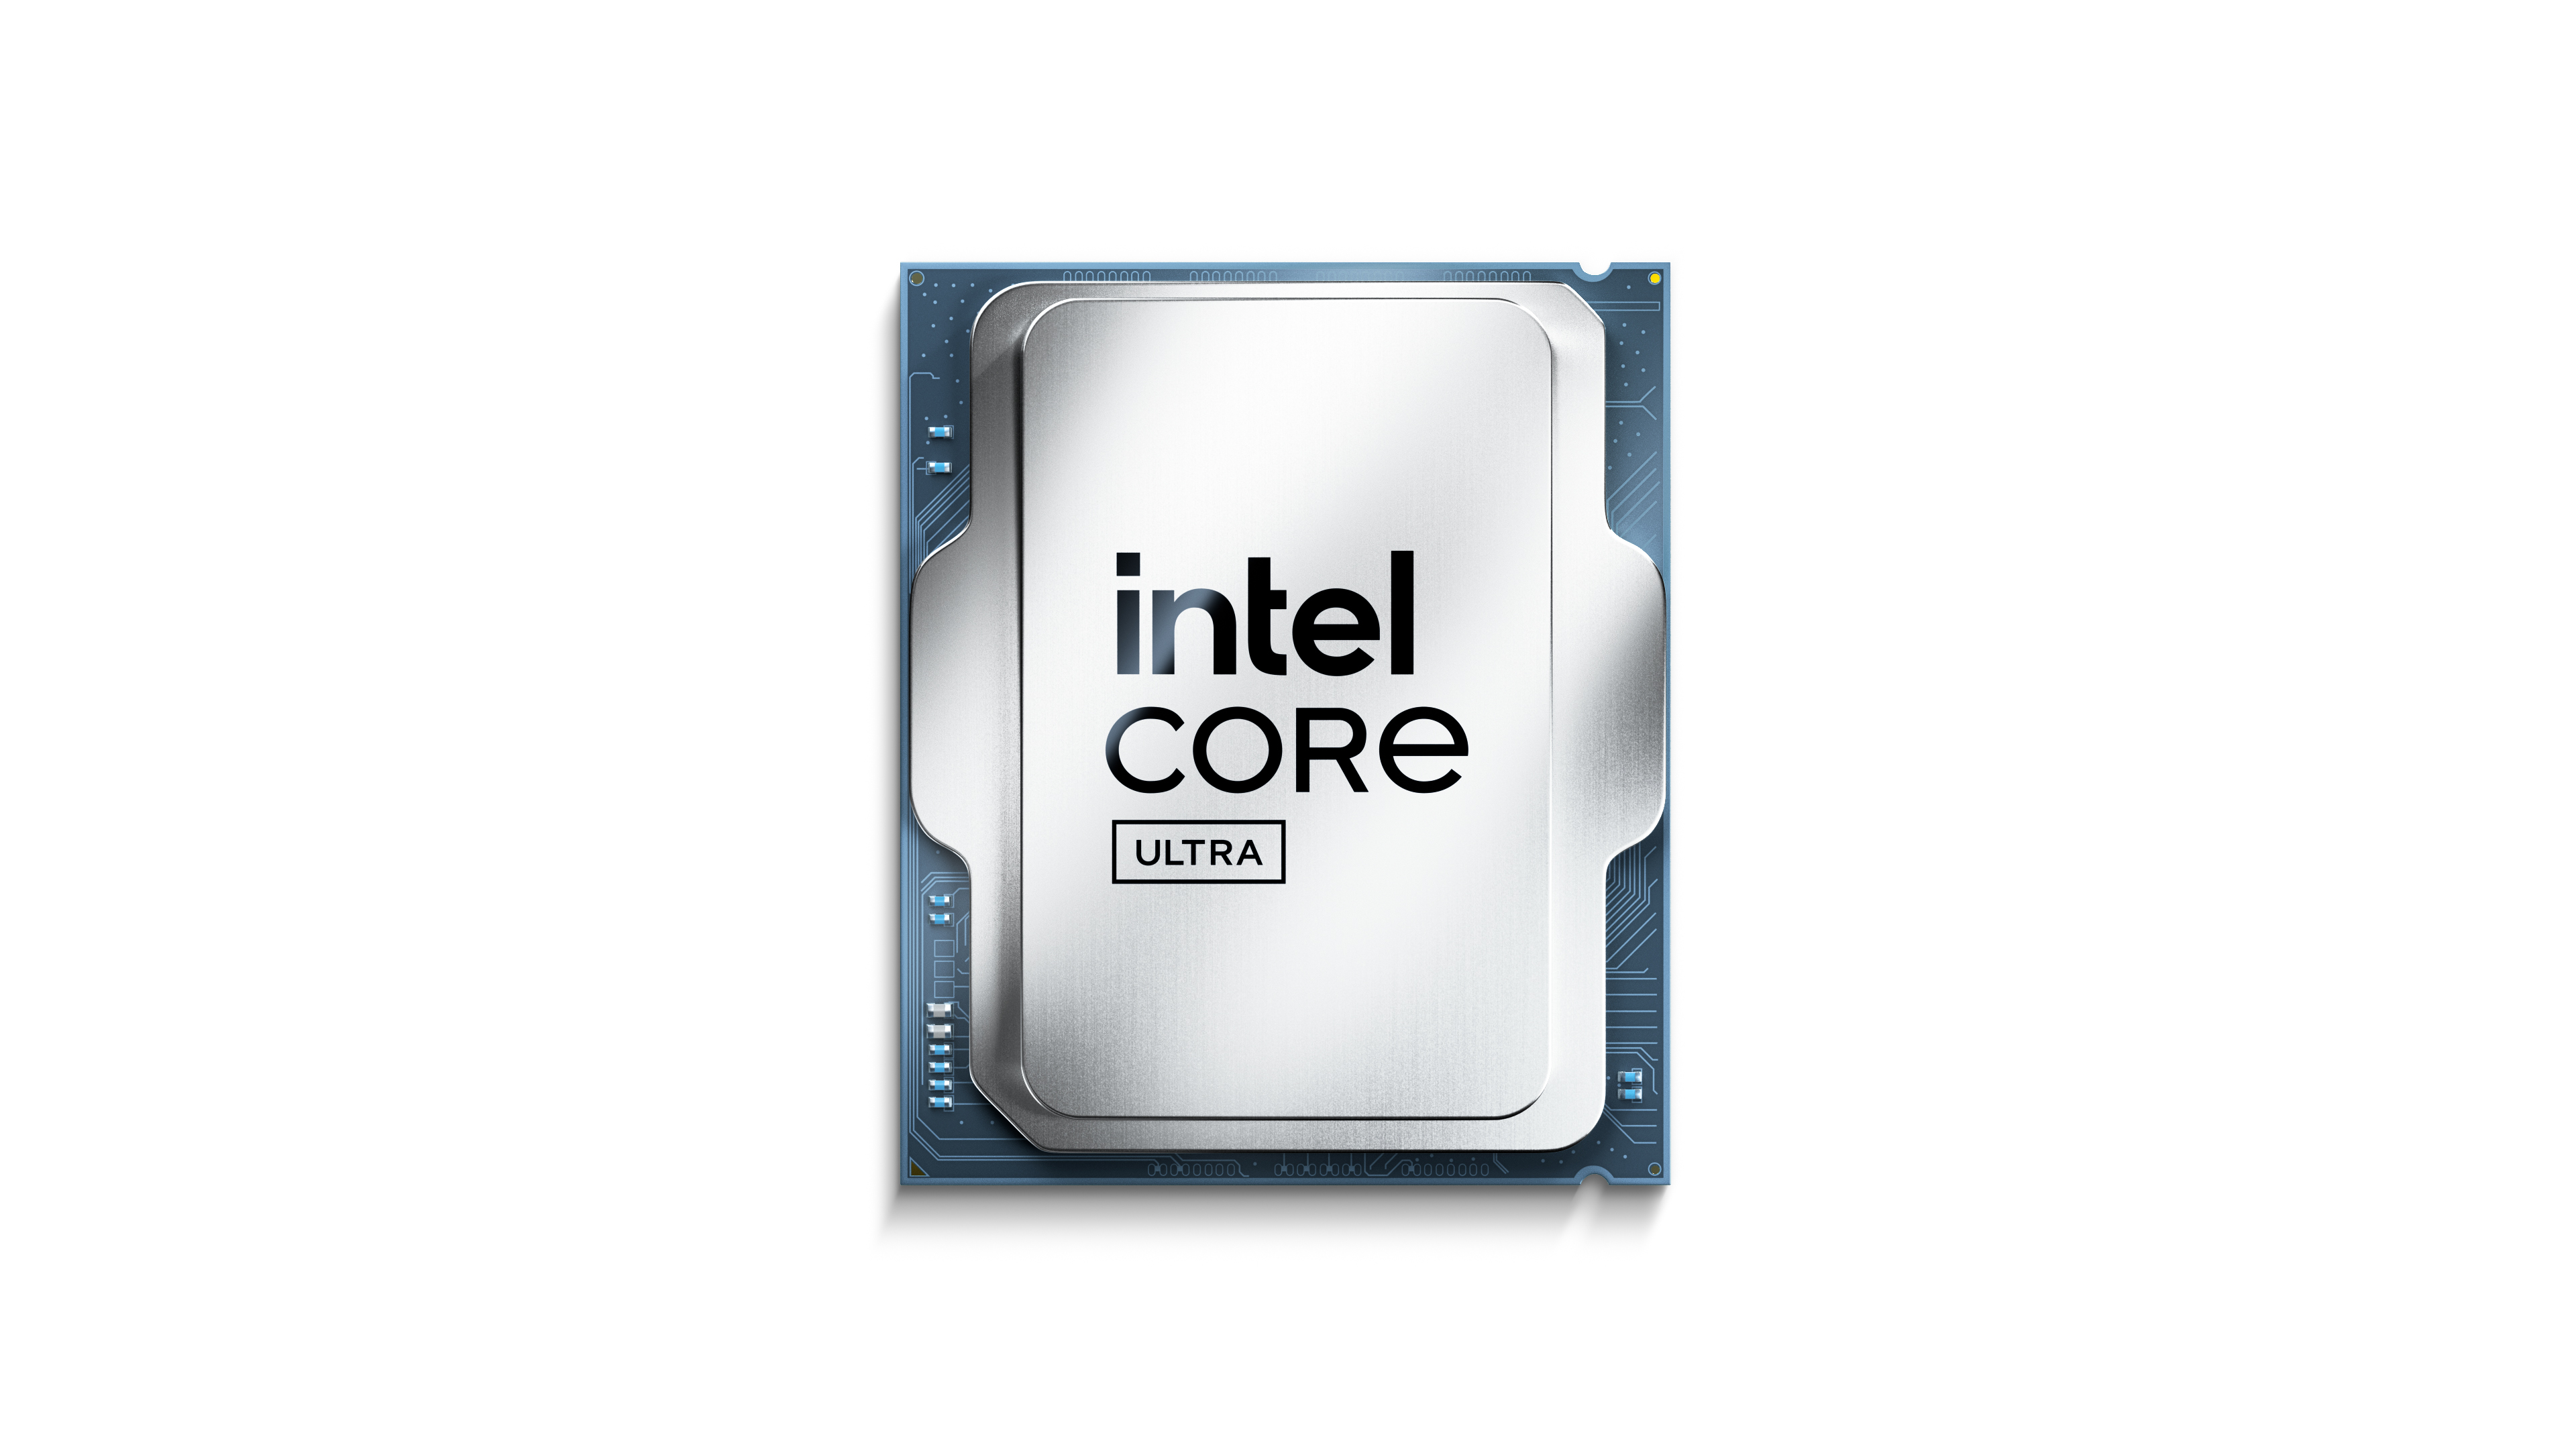
Intel Core i5-13450HX has a base frequency of 1.40 GHz (4.60 GHz). 10 / 16 CPU Cores / Threads. Stated TDP / base power 55 W. Released in Q4/2022.
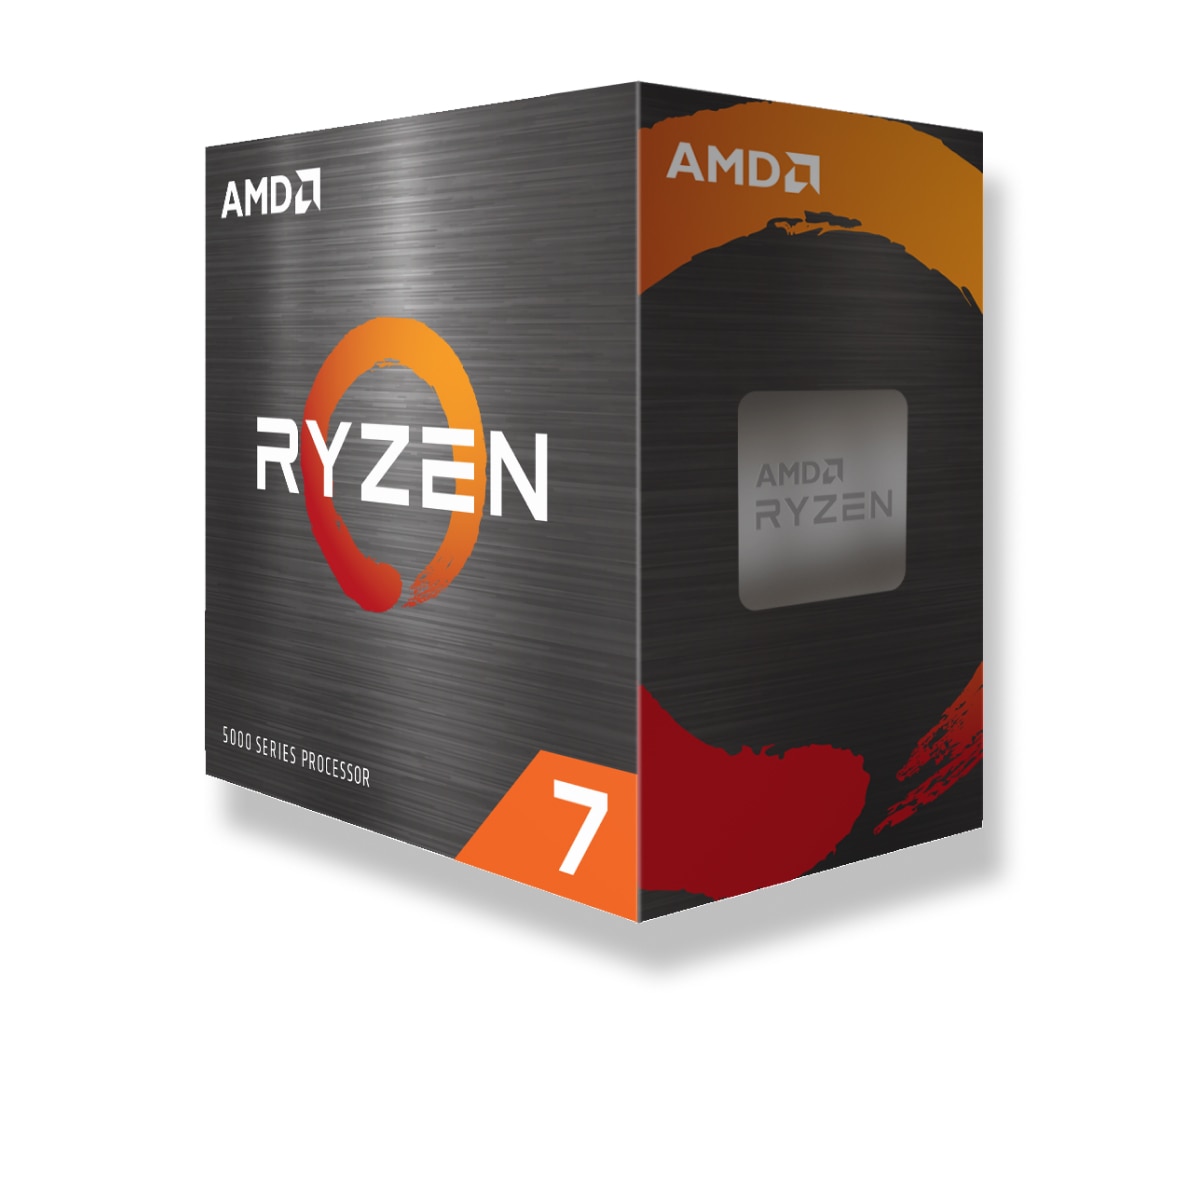
AMD Ryzen 7 9700X has a base frequency of 3.8 GHz. 8 / 16 CPU Cores / Threads. Stated TDP / base power 65 W. Released in 2024-08-08.
Reasons to consider More number of cores
2 more cores
 8
Lower stated TDP / base power
Power limits alone do not measure performance per watt.
65 W
Common positions Intel Core i5-13450HX CPU in popular benchmarks, for comparison with other models.
Reasons to consider
Intel Core i5-13450HX
Background information about the processors being compared, series, generation and market segment.
 -
Ryzen
-
-
Desktop
Desktops / Boxed Processor
Ryzen 9000 Series
Core counts, threads, cache and clock modes describe the CPU configuration. Performance depends on the workload and comparable measured results.
-
-
-
-
-
8
16
-
Yes
3.8 GHz
5.5 GHz
5.5 GHz
Internal Graphics does not affect the performance of the CPU, performs the work of the graphics card in its absence or on mobile devices.
-
-
-
2200 MHz
AMD Radeon Graphics
-
-
-
-
-
-
2
Built-in codecs used to encode and decode content. Significantly speeds up the required operations.
-
-
-
-
-
-
-
-
Types, channel quantity of RAM supported by AMD Ryzen 7 9700X and Intel Core i5-13450HX. Depending on the motherboards, higher or lower memory frequencies may be supported.
-
-
-
2
DDR5
PCIe 5.0
-
Compare the TDP requirements of TDP Intel Core i5-13450HX and AMD Ryzen 7 9700X Power specifications describe different manufacturer limits. TDP, base power and maximum turbo power are separate values; they do not establish measured system consumption.
95 °C
-
-
-
-
65 W
65 W
Architecture, interfaces, additional instructions supported by Intel Core i5-13450HX and AMD Ryzen 7 9700X, virtual machine technologies and process technology.
Zen 5
-
-
-
8 MB
32 MB
-
2024-08-08
AM5
TSMC 4nm FinFET
-
Granite Ridge AM5
TSMC 6nm FinFET
Shared tests with results for both models: 8
Each row uses one Blender version, operating system and compute backend.
| Test and settings | Intel Core i5-13450HX | AMD Ryzen 7 9700X | Result difference¹ |
|---|---|---|---|
| Blender 5.2.0 / CPU / Windows | 189.649538 samples/min Submissions: 14 | 308.060499 samples/min Submissions: 57 | +62.4 % |
| Blender 5.1.1 / CPU / Windows | 191.169363 samples/min Submissions: 12 | 320.473967 samples/min Submissions: 81 | +67.6 % |
| Blender 4.5.0 / CPU / Linux | 227.473124 samples/min Submissions: 34 | 334.163366 samples/min Submissions: 36 | +46.9 % |
| Blender 4.5.0 / CPU / Windows | 180.832808 samples/min Submissions: 77 | 304.57062 samples/min Submissions: 403 | +68.4 % |
| Blender 4.4.0 / CPU / Windows | 185.99406 samples/min Submissions: 22 | 282.660046 samples/min Submissions: 115 | +52.0 % |
| Blender 4.3.0 / CPU / Windows | 187.499397 samples/min Submissions: 23 | 279.963397 samples/min Submissions: 158 | +49.3 % |
| Blender 4.2.0 / CPU / Windows | 182.067147 samples/min Submissions: 40 | 286.426028 samples/min Submissions: 109 | +57.3 % |
| Blender 4.1.0 / CPU / Windows | 191.829731 samples/min Submissions: 24 | 306.671773 samples/min Submissions: 5 | +59.9 % |
¹ Difference of the second result relative to the first in that row. No percentage is calculated for different upscaling algorithms. This compares published results, not a universal performance index.
These results have no shared test of both models with the same version and settings. They are shown separately without a percentage difference.
Published measurements are separate from the archived index. Incomplete conditions and unknown run counts do not support ranking positions or calculated performance differences.
| Model | Test | Result | Reported conditions |
|---|---|---|---|
| AMD Ryzen 7 9700X | Cinebench 2024 / multi-core | 1203 points | Graphics card: GeForce RTX 4090 System RAM: 32 GB |
| AMD Ryzen 7 9700X | Cinebench 2024 / single-core | 136 points | Graphics card: GeForce RTX 4090 System RAM: 32 GB |
| AMD Ryzen 7 9700X | Cinebench R15 / multi-core | 3178 points | Graphics card: GeForce RTX 4090 System RAM: 32 GB |
| AMD Ryzen 7 9700X | Cinebench R15 / single-core | 346 points | Graphics card: GeForce RTX 4090 System RAM: 32 GB |
| AMD Ryzen 7 9700X | Cinebench R20 / multi-core | 7956 points | Graphics card: GeForce RTX 4090 System RAM: 32 GB |
| AMD Ryzen 7 9700X | Cinebench R20 / single-core | 870 points | Graphics card: GeForce RTX 4090 System RAM: 32 GB |
| AMD Ryzen 7 9700X | Cinebench R23 / multi-core | 20485 points | Graphics card: GeForce RTX 4090 System RAM: 32 GB |
| AMD Ryzen 7 9700X | Cinebench R23 / single-core | 2211 points | Graphics card: GeForce RTX 4090 System RAM: 32 GB |
| AMD Ryzen 7 9700X | RandomX / XMRig 6.22.2 / 10M / 16 threads | 14490.17 H/s | System RAM: 64 GB OS: Windows NT 10.0 Motherboard: ASRock / B850I Lightning WiFi Duration: 690.123 s |
Results were obtained on the reported systems. Test versions and settings remain separate; incomplete conditions do not support calculated model performance differences.
| Model | Result | Reported conditions |
|---|---|---|
| AMD Ryzen 7 9700X | 10994.568683 H/s | RandomX / XMRig 6.26.0 / 1M / 16 threads / windows System RAM: 32 GB OS: Windows NT 10.0 Motherboard: Gigabyte Technology Co., Ltd. / B850 AORUS ELITE WIFI7 Duration: 90.954 s User-submitted run; tuning and power settings are incomplete. |
| Model | Result | Reported conditions |
|---|---|---|
| Intel Core i5-13450HX | 5433.459679 H/s | RandomX / XMRig 6.24.0 / 10M / 14 threads / windows System RAM: 16 GB OS: Windows NT 10.0 Motherboard: Dell Inc. / 04TT83 Duration: 1840.448 s User-submitted run; tuning and power settings are incomplete. |


 Russian
 German
 Portuguese
 Italian
 French
 Japan
 Spanish
 Polish
 Chinese
 Korean