Ogólna ocena strony Cpu-compare. Obliczona na podstawie innych benchmarków.
| # | Photo | Nazwa | miejsce | Porównaj |
|---|---|---|---|---|
| 481 | 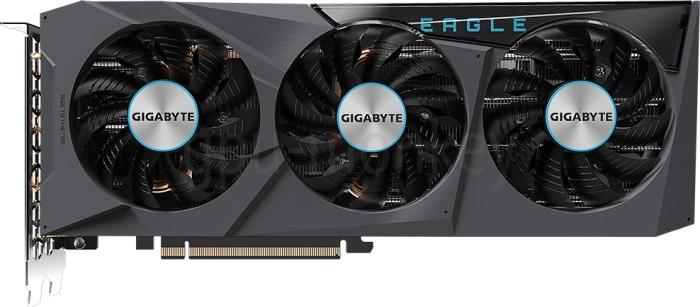 | GIGABYTE GeForce RTX 3070 Eagle OC 8G | 481 | |
| 482 |  | MSI GeForce RTX 3070 Gaming Trio 8G | 482 | |
| 483 |  | Palit GeForce RTX 3070 GamingPro OC | 483 | |
| 484 | 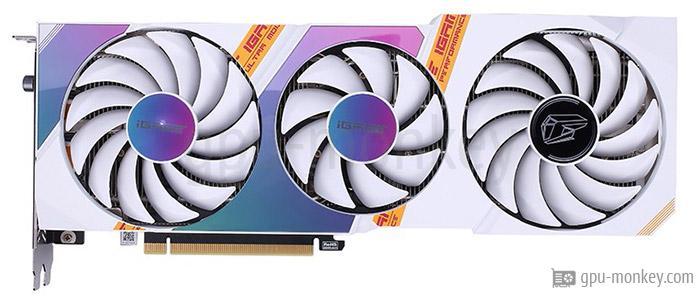 | Colorful iGame GeForce RTX 3070 Ultra W OC-V | 484 | |
| 485 | 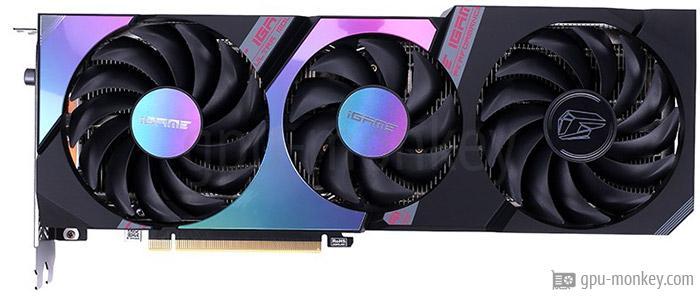 | Colorful iGame GeForce RTX 3070 Ultra OC-V | 485 | |
| 486 | 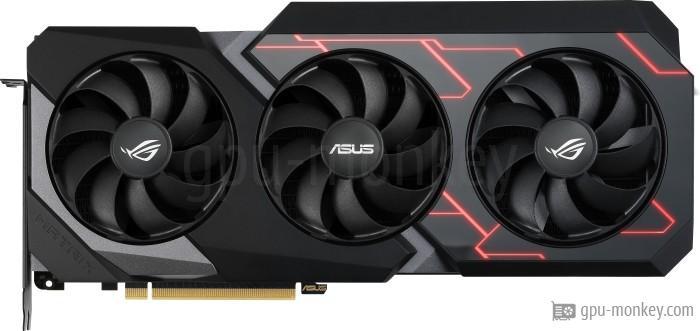 | ASUS ROG Matrix GeForce RTX 2080 Ti Platinum | 486 | |
| 487 | 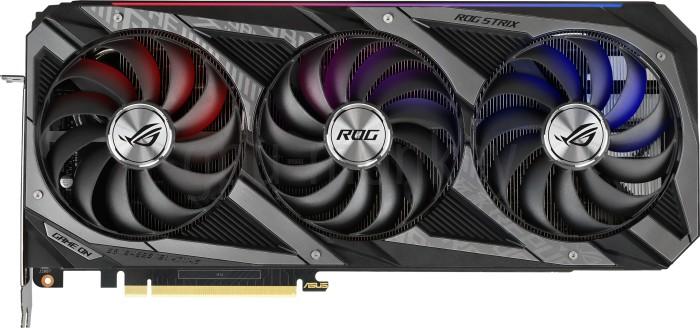 | ASUS ROG Strix GeForce RTX 3070 | 487 | |
| 488 | 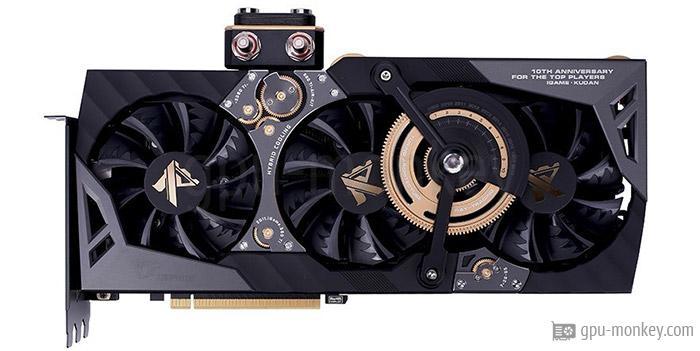 | Colorful iGame GeForce RTX 2080 Ti Kudan-V | 488 | |
| 489 |  | ZOTAC GAMING GeForce RTX 2080 Ti AMP Extreme | 489 | |
| 490 |  | ASUS EKWB GeForce RTX 3070 | 490 | |
| 491 | 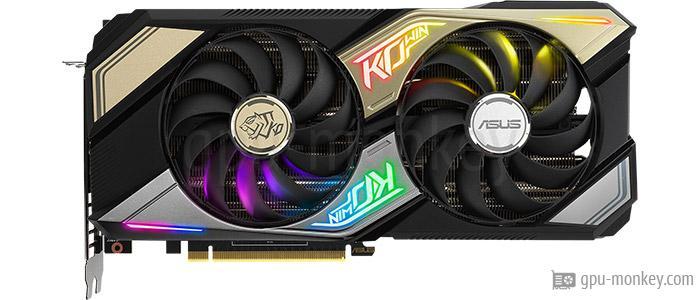 | ASUS KO GeForce RTX 3070 | 491 | |
| 492 | 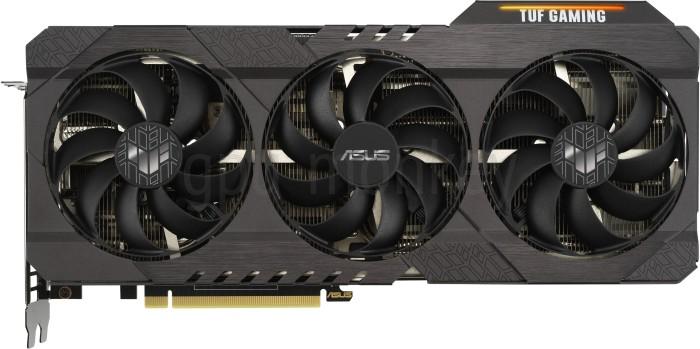 | ASUS TUF Gaming GeForce RTX 3070 | 492 | |
| 493 |  | ASUS Turbo GeForce RTX 3070 | 493 | |
| 494 |  | MSI GeForce RTX 3070 Ventus 2X 8G OC | 494 | |
| 495 | 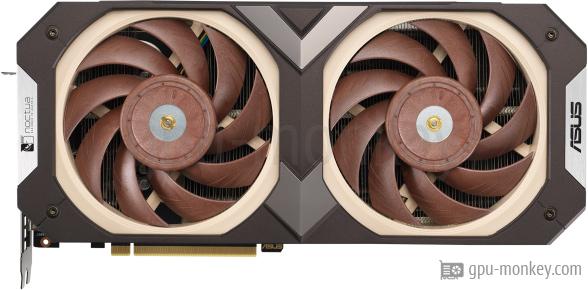 | ASUS GeForce RTX 3070 Noctua Edition | 495 | |
| 496 | 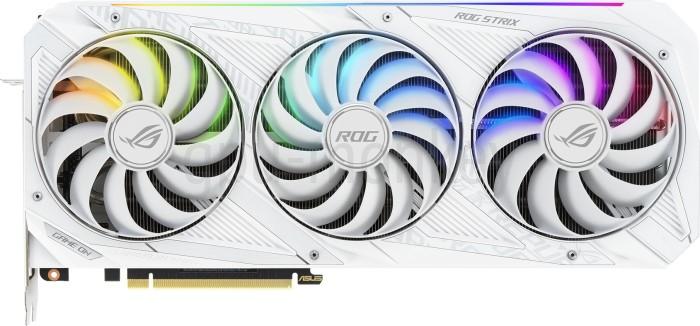 | ASUS ROG Strix GeForce RTX 3070 White | 496 | |
| 497 | 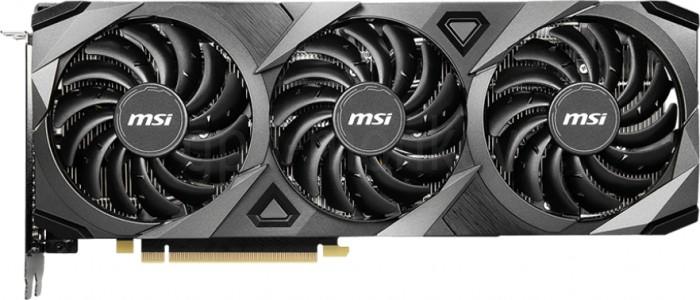 | MSI GeForce RTX 3070 Ventus 3X 8G OC | 497 | |
| 498 | 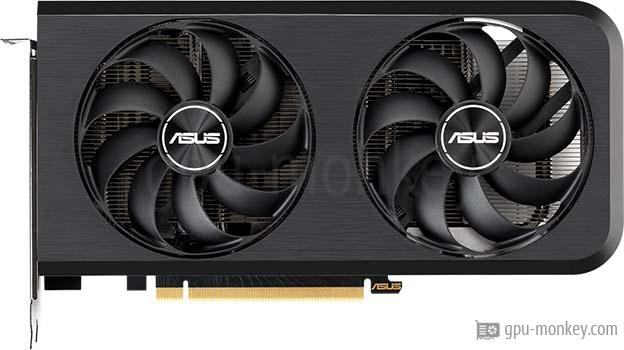 | ASUS Dual GeForce RTX 3070 SI Edition | 498 | |
| 499 | 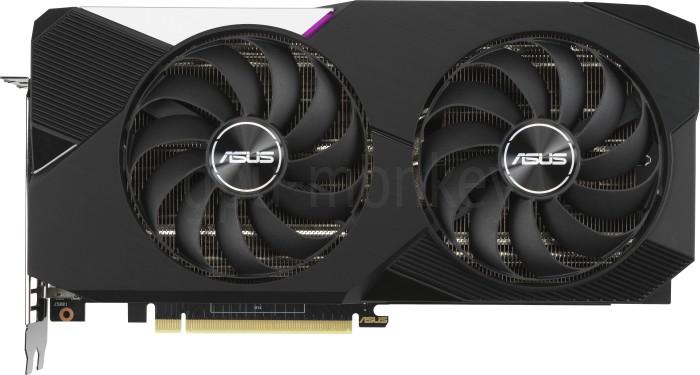 | ASUS Dual GeForce RTX 3070 | 499 | |
| 500 | 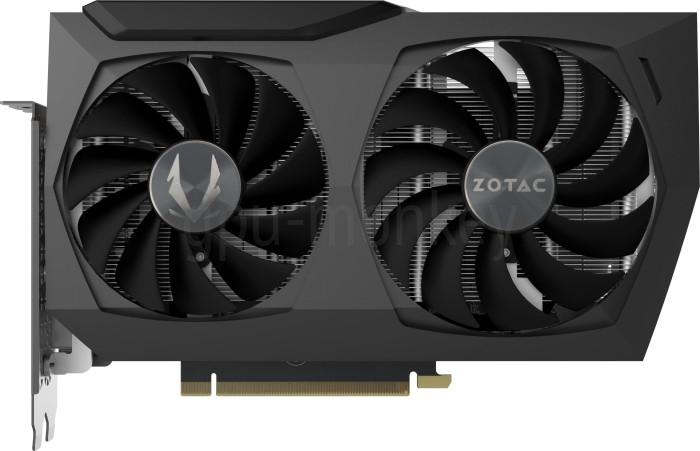 | ZOTAC Gaming GeForce RTX 3070 Twin Edge OC | 500 |
