
什么是最好的选择 Intel Core i9-13900 或 Intel Core i9-13900K? 哪种处理器更快?
我们准备了一份比较,帮助你选择最好的处理器。比较它们的规格和基准。
Intel Core i9-13900 has a base frequency of 2.00 GHz (5.60 GHz). 24 / 32 CPU Cores / Threads. Stated TDP / base power 65 W. 发布于 Q1/2023.
Intel Core i9-13900K has a base frequency of 3.80 GHz. 24 CPU Cores / Threads. Stated TDP / base power 125 W. 发布于 Q4/2022.
需要考虑的原因 Lower stated TDP / base power
Power limits alone do not measure performance per watt.
 125 W
125 W
共同立场 Intel Core i9-13900 在流行的基准测试中的CPU,用于与其他型号进行比较.
需要考虑的原因 在总排名中的位置
(基于几个基准)
 地点
地点
共同立场 Intel Core i9-13900K 在流行的基准测试中的CPU,用于与其他型号进行比较.
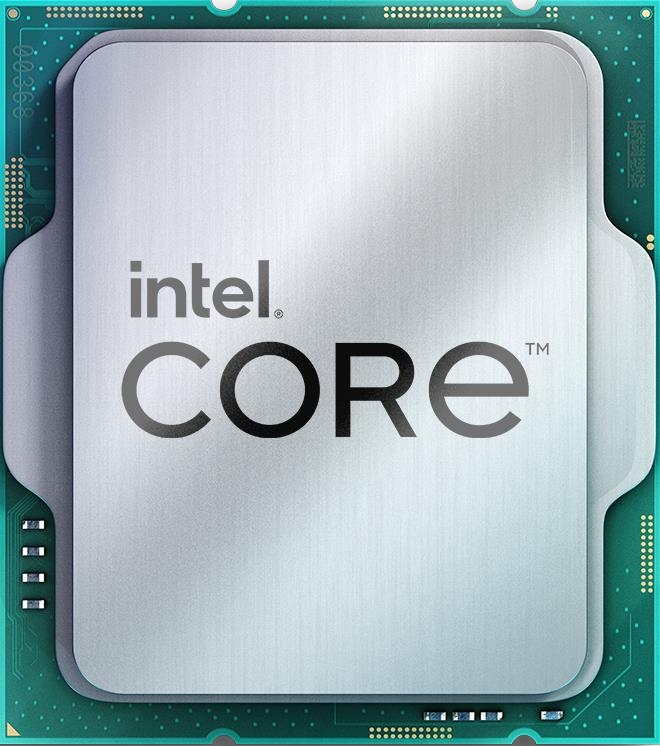
Intel Core i9-13900
有关被比较的处理器、系列、代数和细分市场的背景信息。
 Intel Core i 13000
Intel Core i9
13
Intel Core i9-12900K
Desktop / Server
没有
Intel Core i 13000
Intel Core i9
13
Intel Core i9-12900K
Desktop / Server
没有
Core counts, threads, cache and clock modes describe the CPU configuration. Performance depends on the workload and comparable measured results.
8x Raptor Cove / 3.80 GHz (5.70 GHz)
-
16x Gracemont / 3.00 GHz (4.20 GHz)
-
hybrid
24
32
是
没有
3.8 GHz
没有
没有涡轮增压
内部图形不影响CPU的性能,在没有显卡或在移动设备上执行显卡的工作。
12
32
12
400 MHz
Intel Iris Xe Graphics 32
1450 MHz
4
16 GB
Q4/2022
256
10 nm
用于编码和解码内容的内置编解码器。大大地加快了所需的操作。
Decode
Decode / Encode
Decode / Encode
Decode / Encode
Decode / Encode
Decode
Decode
Decode / Encode
支持的RAM的类型、通道数量 Intel Core i9-13900K 和 Intel Core i9-13900. 根据主板的不同,可能支持更高或更低的内存频率。
是
128 GB
89.6 GB/s
2
DDR5-5600
5.0 x 20
是
比较TDP的要求 Intel Core i9-13900 和 Intel Core i9-13900K Power specifications describe different manufacturer limits. TDP, base power and maximum turbo power are separate values; they do not establish measured system consumption.
100 °C
125 W
241 W
没有
没有
架构、接口、所支持的额外指令 Intel Core i9-13900 和 Intel Core i9-13900K, 虚拟机技术和工艺技术。
Raptor Lake S
-
x86-64 (64 bit)
SSE4.1, SSE4.2, AVX2, AVX2+
32 MB
36 MB
-
Q4/2022
LGA 1700
10 nm
VT-x, VT-x EPT, VT-d
Shared tests with results for both models: 4
Each row uses one Blender version, operating system and compute backend.
| Test and settings | Intel Core i9-13900 | Intel Core i9-13900K | Result difference¹ |
|---|---|---|---|
| Blender 5.2.0 / CPU / Windows | 388.183102 samples/min Submissions: 8 | 511.547382 samples/min Submissions: 12 | +31.8 % |
| Blender 4.5.0 / CPU / Windows | 319.733075 samples/min Submissions: 5 | 483.50998 samples/min Submissions: 68 | +51.2 % |
| Blender 4.2.0 / CPU / Windows | 354.424627 samples/min Submissions: 12 | 480.196647 samples/min Submissions: 241 | +35.5 % |
| Blender 4.0.0 / CPU / Windows | 353.267411 samples/min Submissions: 19 | 506.012269 samples/min Submissions: 251 | +43.2 % |
¹ Difference of the second result relative to the first in that row. No percentage is calculated for different upscaling algorithms. This compares published results, not a universal performance index.
These results have no shared test of both models with the same version and settings. They are shown separately without a percentage difference.
Published measurements are separate from the archived index. Incomplete conditions and unknown run counts do not support ranking positions or calculated performance differences.
| Model | Test | Result | Reported conditions |
|---|---|---|---|
| Intel Core i9-13900K | Cinebench R15 / multi-core | 6191 points | Graphics card: GeForce RTX 3090 |
| Intel Core i9-13900K | Cinebench R15 / single-core | 327 points | Graphics card: GeForce RTX 3090 |
| Intel Core i9-13900K | Cinebench R20 / multi-core | 15181 points | Graphics card: GeForce RTX 3090 |
| Intel Core i9-13900K | Cinebench R20 / single-core | 828 points | Graphics card: GeForce RTX 3090 |
| Intel Core i9-13900K | Cinebench R23 / multi-core | 40103 points | Graphics card: GeForce RTX 3090 |
| Intel Core i9-13900K | Cinebench R23 / single-core | 2267 points | Graphics card: GeForce RTX 3090 |
Results were obtained on the reported systems. Test versions and settings remain separate; incomplete conditions do not support calculated model performance differences.
| Model | Result | Reported conditions |
|---|---|---|
| Intel Core i9-13900K | 9028.644277 H/s | RandomX / XMRig 6.22.2 / 10M / 32 threads / windows System RAM: 32 GB OS: Windows NT 10.0 Motherboard: ASRock / B760M-H2/M.2 Duration: 1107.586 s User-submitted run; tuning and power settings are incomplete. |
| Model | Result | Reported conditions |
|---|---|---|
| Intel Core i9-13900 | 10112.654976 H/s | RandomX / XMRig 6.22.2 / 1M / 32 threads / windows System RAM: 32 GB OS: Windows NT 10.0 Motherboard: Gigabyte Technology Co., Ltd. / B760M GAMING X AX Duration: 98.886 s User-submitted run; tuning and power settings are incomplete. |
根据几项基准测试的结果,你可以更准确地估计出以下两者的性能差异 Intel Core i9-13900 和 Intel Core i9-13900K.
比较合成测试值,选择最好的处理器!
These are saved results from the earlier catalog. Measurement dates and test configurations were not recorded. Models with no comparable results are omitted.
Recent models: test results with identified primary sources — Cinebench R23 · Cinebench R20 · Cinebench R15 · Cinebench 2026 · RandomX benchmark
Higher values are better in this metric.
Higher values are better in this metric.
Higher values are better in this metric.
Higher values are better in this metric.
Higher values are better in this metric.
Higher values are better in this metric.


 English
 Russian
 German
 Portuguese
 Italian
 French
 Japan
Japan Spanish
 Polish
 Korean