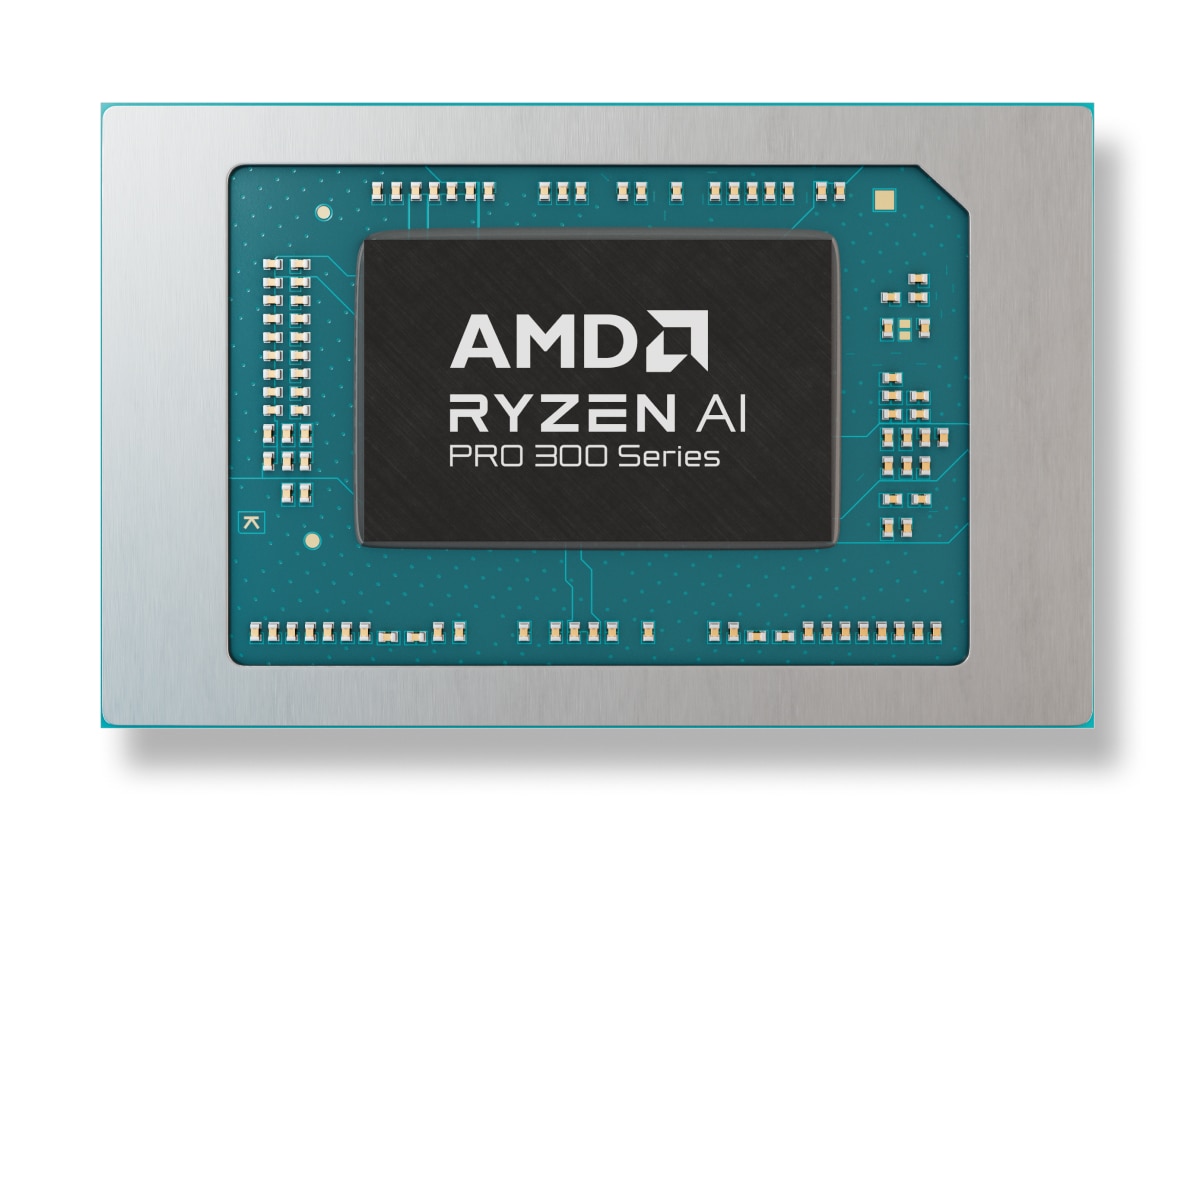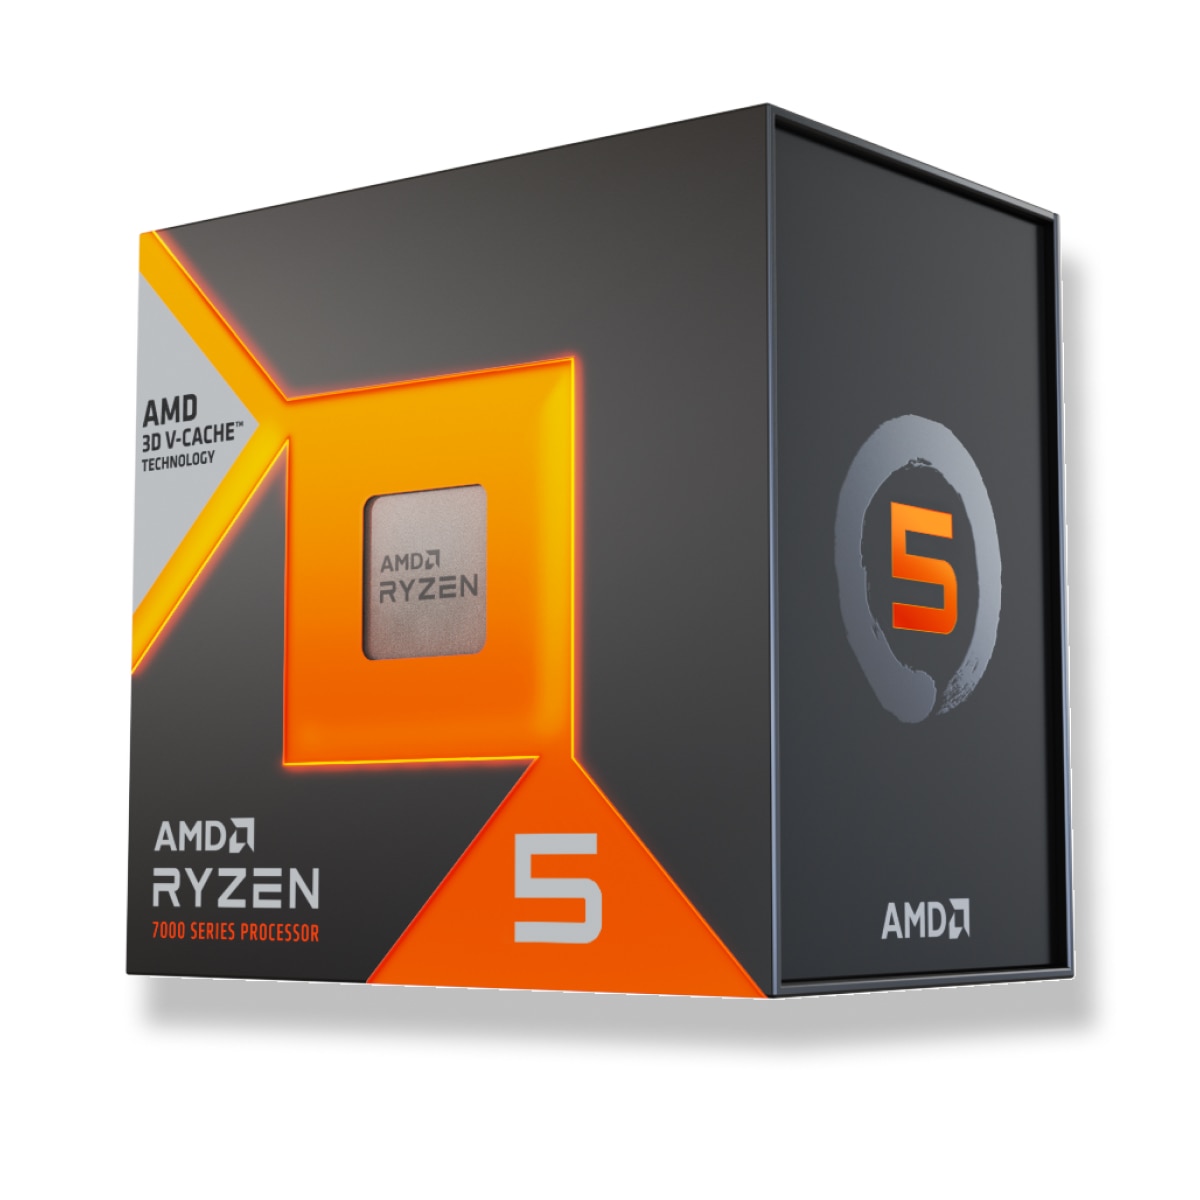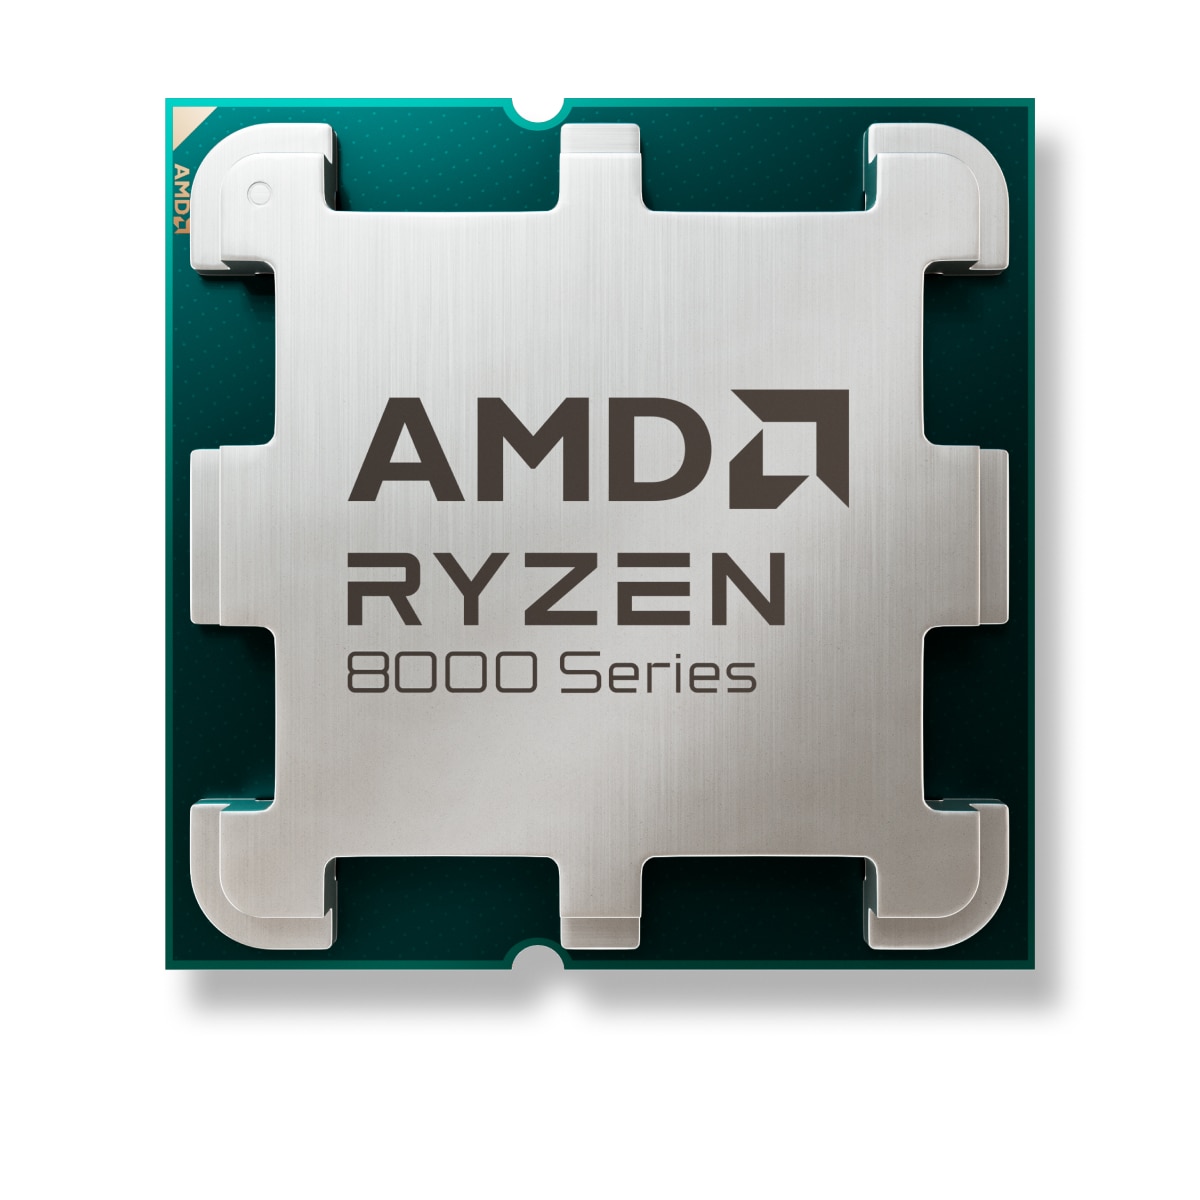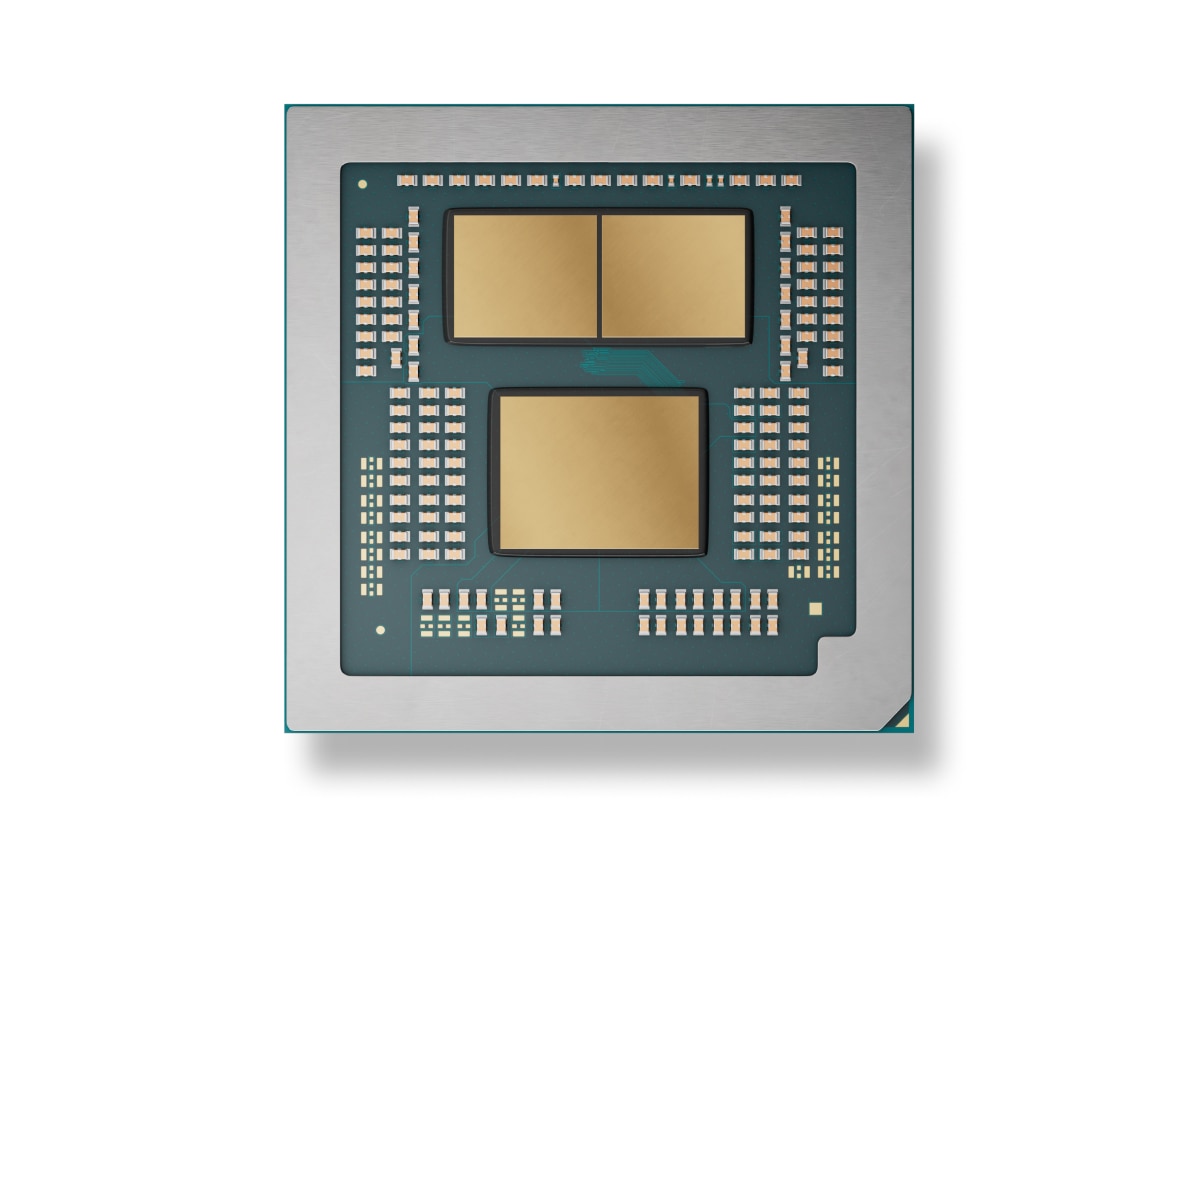
제품군 예시 이미지.
최선의 선택은 무엇인가요? AMD Ryzen 5 7500F 또는 AMD Ryzen 9 7900X? 哪种处理器更快?
Compare the available specifications of these models.
AMD Ryzen 5 7500F has a base frequency of 3.7 GHz. 6 / 12 CPU Cores / Threads. Stated TDP / base power 65 W. 에 출시 2023-07-22.
AMD Ryzen 9 7900X has a base frequency of 4.7 GHz. 12 / 24 CPU Cores / Threads. Stated TDP / base power 170 W. 에 출시 2022-09-27.
고려해야 하는 이유 Lower stated TDP / base power
Power limits alone do not measure performance per watt.
 170 W
고려해야 하는 이유
170 W
고려해야 하는 이유 전체 랭킹 순위
(여러 벤치마크 기준)
 장소
장소
더 빠른 클럭 속도
주변 27% 더 나은 클럭 속도
3.7 GHz
더 많은 코어 수
6 more cores
6
더 빠른 터보 클럭 속도
주변 12 % higher specified turbo frequency
5 GHz
공통 위치 AMD Ryzen 9 7900X 다른 모델과의 비교를 위한 인기 벤치마크의 CPU.
AMD Ryzen 5 7500F
비교 대상 프로세서, 시리즈, 세대 및 시장 부문에 대한 배경 정보.
 Ryzen
Desktops / Boxed Processor
Desktop
Ryzen 7000 Series
AMD Ryzen 7000
6
AMD Ryzen 9 5900X
Ryzen
Desktops / Boxed Processor
Desktop
Ryzen 7000 Series
AMD Ryzen 7000
6
AMD Ryzen 9 5900X
Core counts, threads, cache and clock modes describe the CPU configuration. Performance depends on the workload and comparable measured results.
4.7 GHz
12
24
5.6 GHz
예
normal
12x
예
5.6 GHz
5.4 GHz
내부 그래픽은 CPU의 성능에 영향을 미치지 않으며, 부재 시 또는 모바일 장치에서 그래픽 카드의 작업을 수행합니다.
AMD Radeon Graphics
12
2
9
2200 MHz
2200 MHz
2
3
8 GB
Q3/2022
128
5 nm
콘텐츠 인코딩 및 디코딩에 사용되는 코덱이 내장되어 있습니다. 필요한 작업 속도를 크게 높입니다.
아니요
Decode / Encode
Decode / Encode
Decode / Encode
Decode / Encode
Decode
Decode / Encode
Decode / Encode
지원되는 RAM의 유형, 채널 수량 AMD Ryzen 9 7900X 그리고 AMD Ryzen 5 7500F. 마더보드에 따라 더 높거나 낮은 메모리 주파수가 지원될 수 있습니다.
2
DDR5
5.0 x 24
예
128 GB
83.2 GB/s
예
TDP 요구 사항 비교 AMD Ryzen 5 7500F 그리고 AMD Ryzen 9 7900X Power specifications describe different manufacturer limits. TDP, base power and maximum turbo power are separate values; they do not establish measured system consumption.
170 W
95 °C
170 W
230 W
아키텍처, 인터페이스, 지원되는 추가 지침 AMD Ryzen 5 7500F 그리고 AMD Ryzen 9 7900X, 가상 머신 기술 및 프로세스 기술.
Raphael AM5
12 MB
64 MB
2022-09-27
AM5
TSMC 5nm FinFET
Raphael (Zen 4)
Chiplet
Technical data sheet
x86-64 (64 bit)
SSE4a, SSE4.1, SSE4.2,FMA3, AVX2, AVX512
Windows 10, Windows 11, Linux
100-100000589WOF
549 $
AMD-V, SVM
Shared tests with results for both models: 12
Each row uses one Blender version, operating system and compute backend.
| Test and settings | AMD Ryzen 5 7500F | AMD Ryzen 9 7900X | Result difference¹ |
|---|---|---|---|
| Blender 5.2.0 / CPU / Windows | 202.875257 samples/min Submissions: 20 | 444.104583 samples/min Submissions: 23 | +118.9 % |
| Blender 5.1.1 / CPU / Windows | 211.016448 samples/min Submissions: 32 | 402.994833 samples/min Submissions: 143 | +91.0 % |
| Blender 4.5.0 / CPU / Linux | 226.467652 samples/min Submissions: 9 | 481.361918 samples/min Submissions: 34 | +112.6 % |
| Blender 4.5.0 / CPU / Windows | 193.086364 samples/min Submissions: 85 | 406.708812 samples/min Submissions: 127 | +110.6 % |
| Blender 4.4.0 / CPU / Windows | 191.747448 samples/min Submissions: 63 | 390.634852 samples/min Submissions: 206 | +103.7 % |
| Blender 4.3.0 / CPU / Linux | 241.602998 samples/min Submissions: 6 | 482.755636 samples/min Submissions: 9 | +99.8 % |
| Blender 4.3.0 / CPU / Windows | 188.964731 samples/min Submissions: 55 | 391.064336 samples/min Submissions: 145 | +107.0 % |
| Blender 4.2.0 / CPU / Linux | 238.274443 samples/min Submissions: 6 | 493.686905 samples/min Submissions: 23 | +107.2 % |
| Blender 4.2.0 / CPU / Windows | 191.434044 samples/min Submissions: 85 | 396.197227 samples/min Submissions: 309 | +107.0 % |
| Blender 4.1.0 / CPU / Linux | 250.362812 samples/min Submissions: 9 | 510.14922 samples/min Submissions: 16 | +103.8 % |
| Blender 4.1.0 / CPU / Windows | 208.496404 samples/min Submissions: 66 | 400.971593 samples/min Submissions: 148 | +92.3 % |
| Blender 4.0.0 / CPU / Windows | 198.856133 samples/min Submissions: 40 | 412.755161 samples/min Submissions: 318 | +107.6 % |
¹ Difference of the second result relative to the first in that row. No percentage is calculated for different upscaling algorithms. This compares published results, not a universal performance index.
These results have no shared test of both models with the same version and settings. They are shown separately without a percentage difference.
Published measurements are separate from the archived index. Incomplete conditions and unknown run counts do not support ranking positions or calculated performance differences.
| Model | Test | Result | Reported conditions |
|---|---|---|---|
| AMD Ryzen 9 7900X | Cinebench R15 / multi-core | 4856 points | Graphics card: GeForce RTX 3090 System RAM: 32 GB |
| AMD Ryzen 9 7900X | Cinebench R15 / single-core | 324 points | Graphics card: GeForce RTX 3090 System RAM: 32 GB |
| AMD Ryzen 9 7900X | Cinebench R20 / multi-core | 11563 points | Graphics card: GeForce RTX 3090 System RAM: 32 GB |
| AMD Ryzen 9 7900X | Cinebench R20 / single-core | 786 points | Graphics card: GeForce RTX 3090 System RAM: 32 GB |
| AMD Ryzen 9 7900X | Cinebench R23 / multi-core | 29480 points | Graphics card: GeForce RTX 3090 System RAM: 32 GB |
| AMD Ryzen 9 7900X | Cinebench R23 / single-core | 2039 points | Graphics card: GeForce RTX 3090 System RAM: 32 GB |
Results were obtained on the reported systems. Test versions and settings remain separate; incomplete conditions do not support calculated model performance differences.
| Model | Result | Reported conditions |
|---|---|---|
| AMD Ryzen 5 7500F | 9236.168837 H/s | RandomX / XMRig 6.26.0 / 1M / 12 threads / windows System RAM: 32 GB OS: Windows NT 10.0 Motherboard: ASUSTeK COMPUTER INC. / ROG STRIX B650E-F GAMING WIFI Duration: 108.27 s User-submitted run; tuning and power settings are incomplete. |
| Model | Result | Reported conditions |
|---|---|---|
| AMD Ryzen 9 7900X | 16626.209557 H/s | RandomX / XMRig 6.26.0 / 1M / 24 threads / windows System RAM: 32 GB OS: Windows NT 10.0 Motherboard: ASUSTeK COMPUTER INC. / TUF GAMING B650-PLUS WIFI Duration: 60.146 s User-submitted run; tuning and power settings are incomplete. |


 English
 Russian
 German
 Portuguese
 Italian
 French
 Japan
Japan Spanish
 Polish
 Chinese