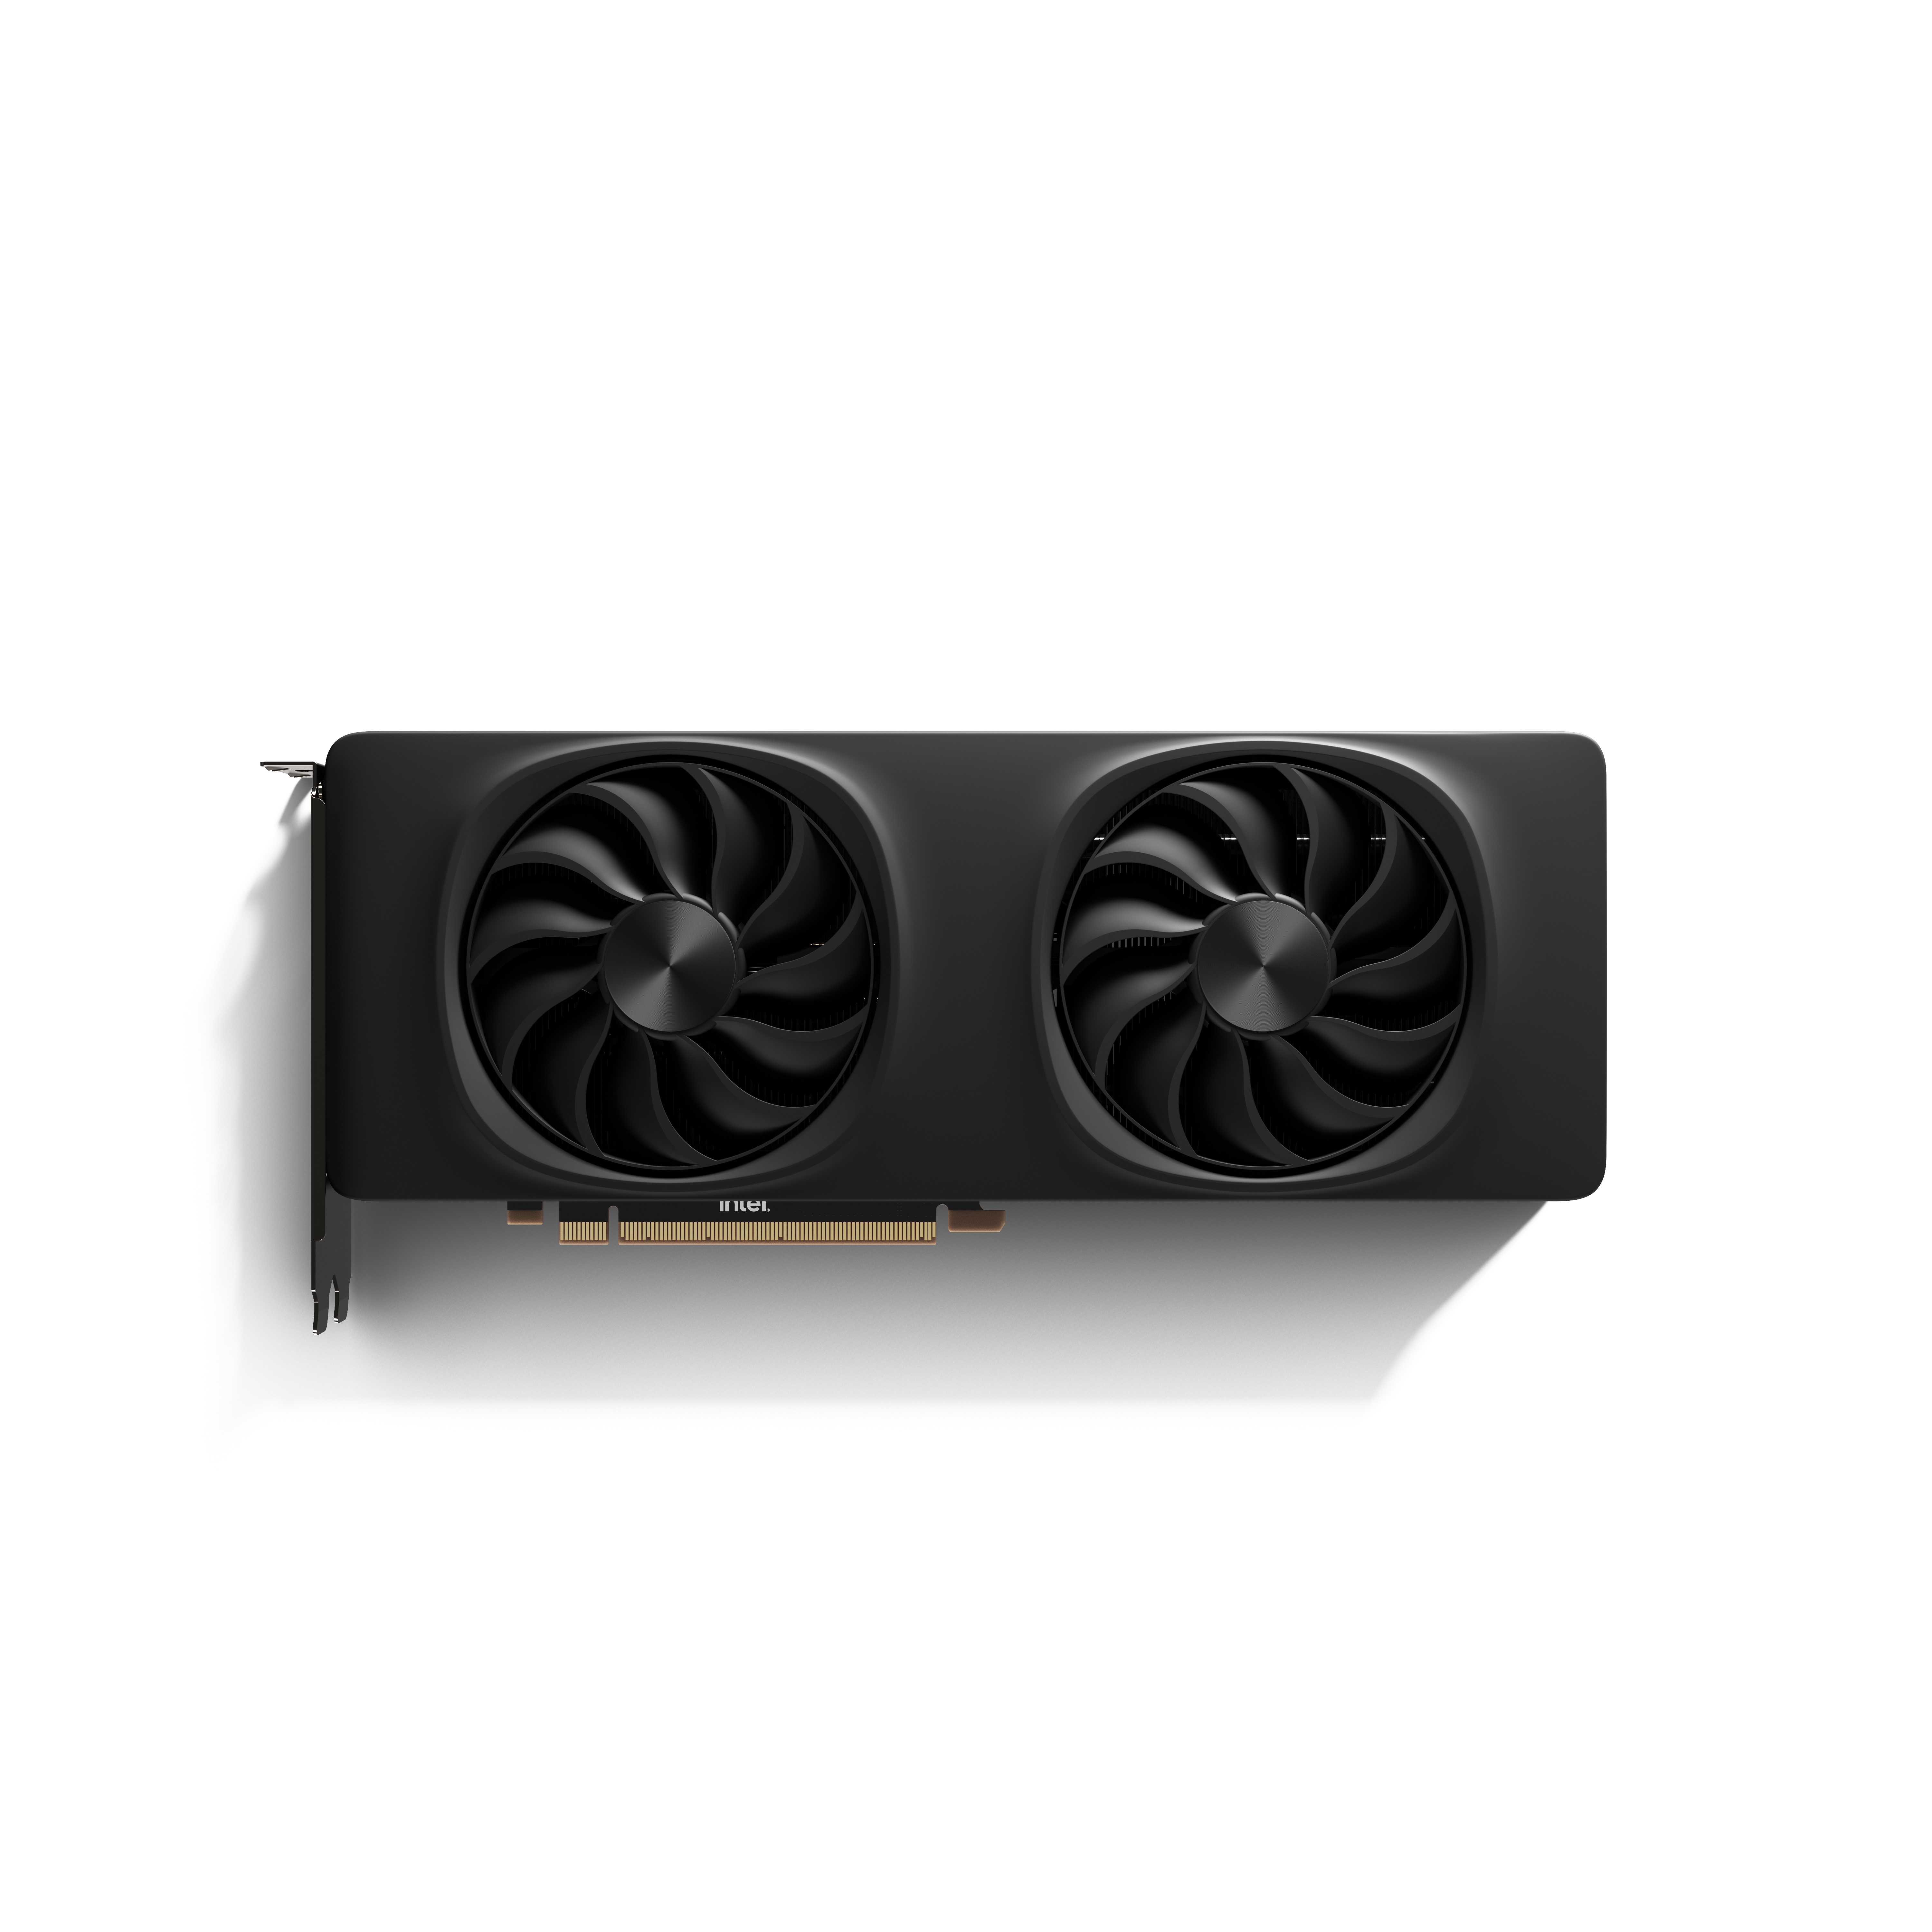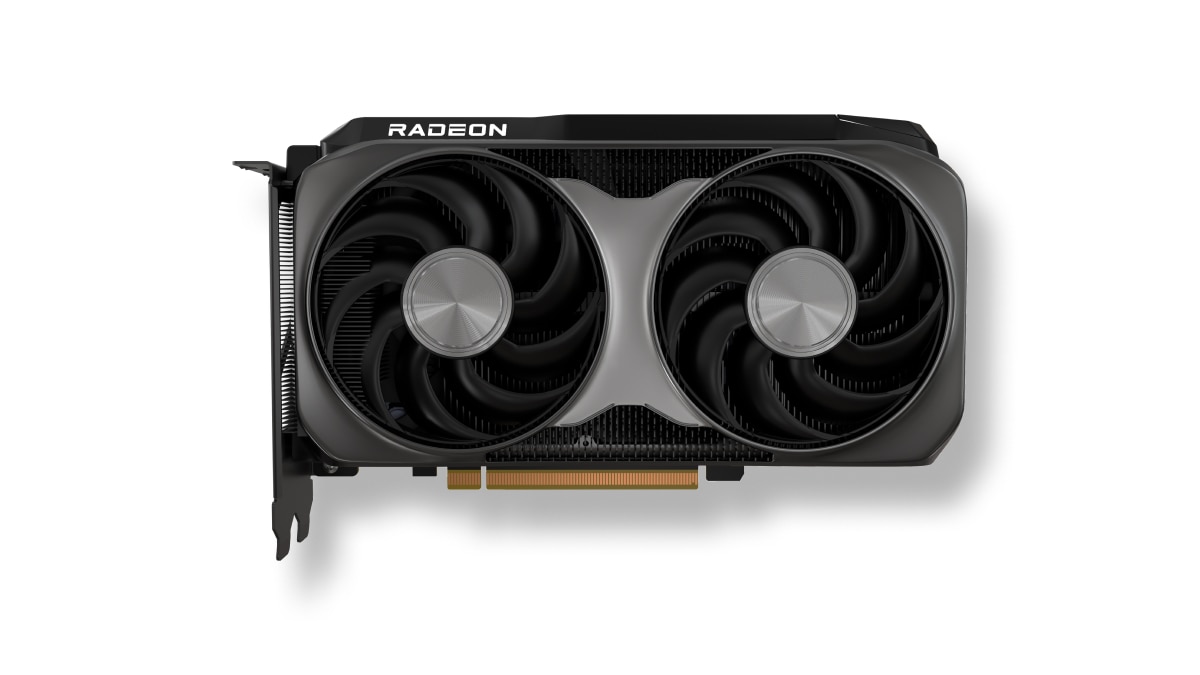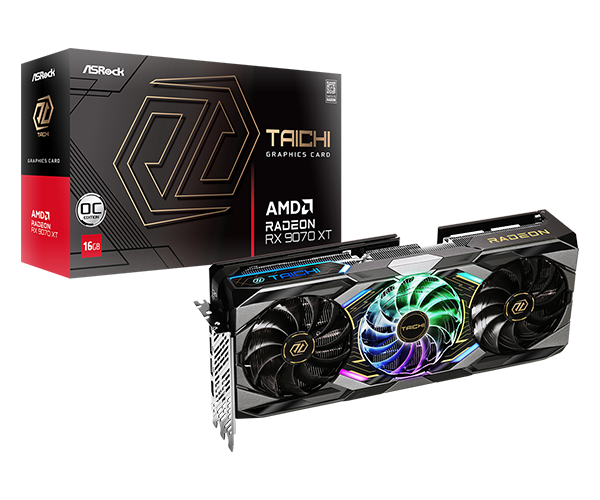
Was ist die beste Wahl? GIGABYTE Radeon RX 5500 XT OC 4G oder NVIDIA GeForce RTX 4060? Welche Grafikkarte ist schneller?
Wir haben einen Vergleich vorbereitet, um Ihnen bei der Auswahl der besten Grafikkarte zu helfen. Vergleichen Sie deren Spezifikationen und Benchmarks.
GIGABYTE Radeon RX 5500 XT OC 4G has a base frequency of 1.607 GHz. Speichergröße 4 GB. Speicher Typ GDDR6. Freigegeben in Q3/2019.
NVIDIA GeForce RTX 4060 has a base frequency of 1.83 GHz. Speichergröße 8 GB. Speicher Typ GDDR6. Freigegeben in Q3/2023.
Gründe für die Berücksichtigung Platz in der Gesamtwertung
(basierend auf mehreren Benchmarks)
 Ort
Gemeinsame Standpunkte GIGABYTE Radeon RX 5500 XT OC 4G GPU in gängigen Benchmarks, zum Vergleich mit anderen Modellen.
Gründe für die Berücksichtigung Höhere Taktfrequenz
Rund um 14% höhere taktfrequenz
 1.607 GHz
Mehr Speicher
100% mehr Speicher
4 GB
Gemeinsame Standpunkte NVIDIA GeForce RTX 4060 GPU in gängigen Benchmarks, zum Vergleich mit anderen Modellen.
GIGABYTE Radeon RX 5500 XT OC 4G
Vergleich der grundlegenden technischen Daten von Grafikkarten GIGABYTE Radeon RX 5500 XT OC 4G und NVIDIA GeForce RTX 4060, Chip, Informationsverarbeitungseinheiten.
 NVIDIA GeForce RTX 4060
-
AD107
32
3072
96
Ada Lovelace
3072
24
24
Video memory capacity, type, bus width and bandwidth describe different properties. These values alone do not determine graphics performance.
272 GB/s
128 bit
8 GB
-
GDDR6
2125 MHz
17 Gbps
Published GPU clock frequencies describe different operating modes. Clock speed alone does not determine graphics performance.
1830 MHz
2460 MHz
-
Ja
Graphics card power limits and recommended system power supply describe different specifications.
90 °C
115 W
-
90 °C
550 W (System power requirement)
115 W
Arten und Größen von Kühlern für das Kühlsystem von Grafikkarten GIGABYTE Radeon RX 5500 XT OC 4G und NVIDIA GeForce RTX 4060.
Air cooling
-
-
-
0 dB / Silent
-
Konnektivität und Verbindungen.
3 × DisplayPort
-
2.3
1 × HDMI 2.1a
4
PCIe 4.0 x8
1x PCIe 8-pin cables (adapter in box) OR 300 W or greater PCIe Gen 5 cable. Certain manufacturer models may use 1x PCIe 6-pin cable or 1x PCIe 8-pin cable
-
-
HDMI
Technische Daten, die in Computerspielen voll ausgeschöpft werden.
12_2 (Ultimate)
Ja
No LED lighting
7680 × 4320
Ja
Integrierte Unterstützung für Video- und Bildkompressionsstandards.
Decode / Encode
Decode / Encode
Decode / Encode
Decode
Decode
Der Unterschied in Größe, Gewicht und Steckplatz der verglichenen Geräte
-
-
-
-
-
Vergleich von Schnittstellen und Freigabeterminen für GPU NVIDIA GeForce RTX 4060 und GIGABYTE Radeon RX 5500 XT OC 4G.
data sheet
299 $
-
4 nm
Q3/2023
NVIDIA Founders Edition/reference design. Clock specifications apply to gaming use. AIB shipping specifications and complete-system power needs may differ.
Shared tests with results for both models: 2
Each row is a separate graphics subtest. Scores are not game FPS.
| Test and settings | GIGABYTE Radeon RX 5500 XT OC 4G | NVIDIA GeForce RTX 4060 | Result difference¹ |
|---|---|---|---|
| 3DMark – Steel Nomad — Steel Nomad Score / DirectX 12 | 432 points Base GPU test: AMD Radeon RX 5500 XT 4 GB VRAM: 4 GBOS: Windows 11Graphics API: DirectX 12HVCI: enabledApplication version unreported | 2354 points Base GPU test: Nvidia GeForce RTX 4060 VRAM: 8 GBOS: Windows 11Graphics API: DirectX 12HVCI: enabledApplication version unreported | +444.9 % |
| 3DMark – Time Spy — Graphics Score / DirectX 12 | 5016 points Base GPU test: AMD Radeon RX 5500 XT 4 GB VRAM: 4 GBTest CPU: AMD Ryzen 9 7950X3DOS: Windows 11Graphics API: DirectX 12HVCI: enabledApplication version unreported | 10596 points Base GPU test: Nvidia GeForce RTX 4060 VRAM: 8 GBTest CPU: AMD Ryzen 9 7950X3DOS: Windows 11Graphics API: DirectX 12HVCI: enabledApplication version unreported | +111.2 % |
¹ Difference of the second result relative to the first in that row. No percentage is calculated for different upscaling algorithms. This compares published results, not a universal performance index.
A base GPU test is a reference for cards using that GPU and the same memory capacity. Board overclocking, cooling and power limits can change the result.
These results have no shared test of both models with the same version and settings. They are shown separately without a percentage difference.
Anhand der Ergebnisse mehrerer gängiger Benchmarks können Sie den Leistungsunterschied zwischen GIGABYTE Radeon RX 5500 XT OC 4G und NVIDIA GeForce RTX 4060.
Vergleichen Sie synthetische Benchmarks und wählen Sie die beste Grafikkarte für Sie!
These are saved results from the earlier catalog. Measurement dates and test configurations were not recorded. Models with no comparable results are omitted.
Recent models: test results with identified primary sources — Game frame rates
Archived results. The original measurement method and test conditions have not been verified.
Higher values are better in this metric.


 English
 Russian
 Portuguese
 Italian
 French
 Japan
 Spanish
 Polish
 Chinese
 Korean