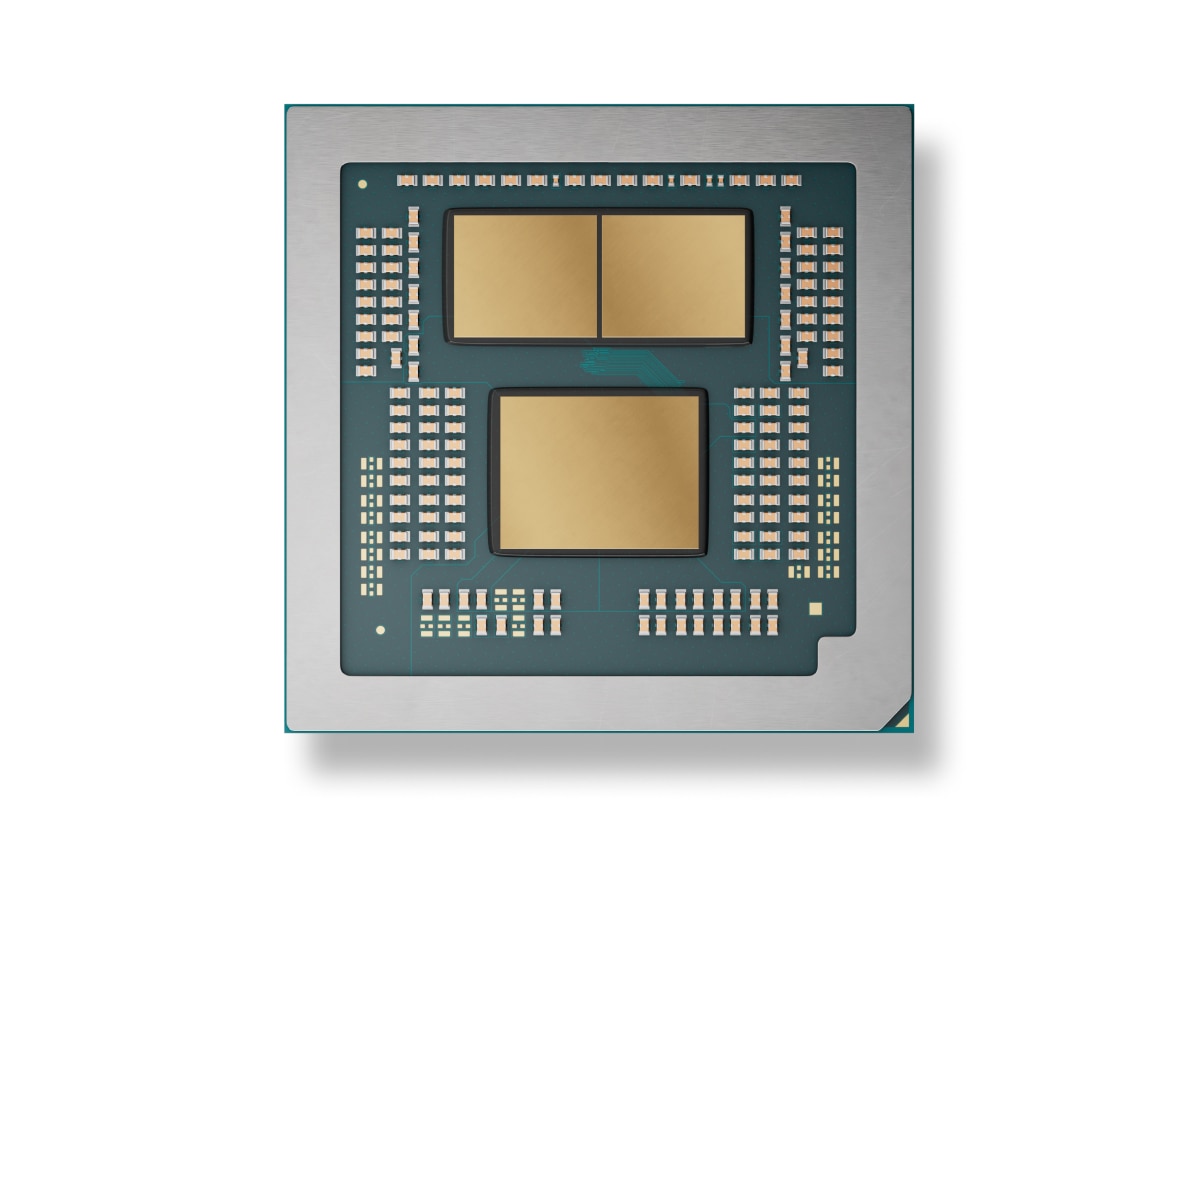
共同立场 Intel Core i9-13900H 在流行的基准测试中的CPU,用于与其他型号进行比较.
Published results: 13
Each row uses one Blender version, operating system and compute backend.
| Test and settings | Intel Core i9-13900H |
|---|---|
| Blender 4.0.0 / CPU / Linux | 258.238432 samples/min Submissions: 13 |
| Blender 4.0.0 / CPU / Windows | 212.627128 samples/min Submissions: 118 |
| Blender 4.1.0 / CPU / Windows | 201.364266 samples/min Submissions: 31 |
| Blender 4.2.0 / CPU / Linux | 195.081862 samples/min Submissions: 8 |
| Blender 4.2.0 / CPU / Windows | 151.490866 samples/min Submissions: 53 |
| Blender 4.3.0 / CPU / Windows | 206.012944 samples/min Submissions: 49 |
| Blender 4.4.0 / CPU / Linux | 180.382133 samples/min Submissions: 13 |
| Blender 4.4.0 / CPU / Windows | 196.311314 samples/min Submissions: 39 |
| Blender 4.5.0 / CPU / Linux | 239.172077 samples/min Submissions: 10 |
| Blender 4.5.0 / CPU / Windows | 183.738244 samples/min Submissions: 56 |
| Blender 5.1.1 / CPU / Linux | 230.78364 samples/min Submissions: 6 |
| Blender 5.1.1 / CPU / Windows | 165.950779 samples/min Submissions: 16 |
| Test and settings | Intel Core i9-13900H |
|---|---|
| Blender 5.2.0 / CPU / Windows | 203.029651 samples/min Submissions: 5 |
Results were obtained on the reported systems. Test versions and settings remain separate; incomplete conditions do not support calculated model performance differences.
| Result | Reported conditions |
|---|---|
| 5067.113924 H/s | RandomX / XMRig 6.26.0 / 1M / 17 threads / windows System RAM: 32 GB OS: Windows NT 10.0 Duration: 197.351 s User-submitted run; tuning and power settings are incomplete. |
比较流行基准的分数 Intel Core i9-13900H 与其他处理器相比,了解CPU处理内容时的真实速度.
测试包括数学计算、创建3D模型、加密货币挖掘、单核和多核模式下的测试.
These are saved results from the earlier catalog. Measurement dates and test configurations were not recorded. Models with no comparable results are omitted.
Recent models: test results with identified primary sources — Cinebench R23 · Cinebench R20 · Cinebench R15 · Cinebench 2026 · RandomX benchmark
Higher values are better in this metric.
Higher values are better in this metric.
Higher values are better in this metric.
Higher values are better in this metric.
Higher values are better in this metric.
Higher values are better in this metric.
Comparable benchmark results are required to suggest performance alternatives.
*
PL1 is the sustained processor power limit; PL2 is the short-term turbo power limit. They are not measured performance or efficiency.
这些数值被用来选择最佳的冷却系统和电源。


 English
 Russian
 German
 Portuguese
 Italian
 French
 Japan
Japan Spanish
 Polish
 Korean