
Jaki jest najlepszy wybór Intel Core i9-13900 lub AMD Ryzen 7 5800X3D? Który procesor jest szybszy?
Compare the available specifications of these models.
Intel Core i9-13900 has a base frequency of 2.00 GHz (5.60 GHz). 24 / 32 CPU Cores / Threads. Stated TDP / base power 65 W. Wydany w Q1/2023.
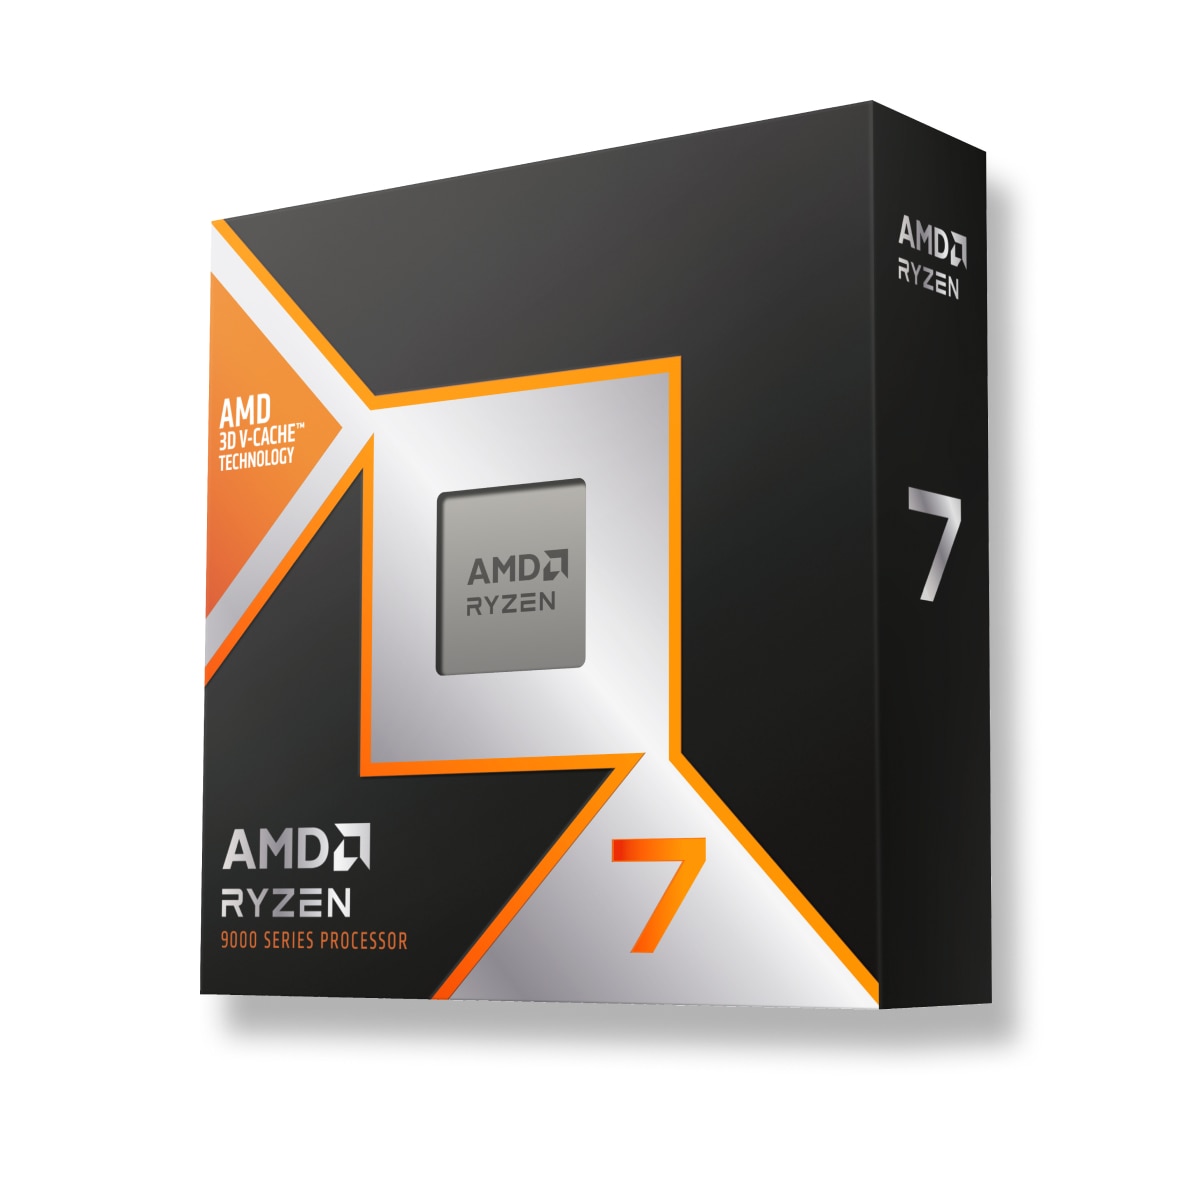
AMD Ryzen 7 5800X3D has a base frequency of 3.4 GHz. 8 / 16 CPU Cores / Threads. Stated TDP / base power 105 W. Wydany w 2022-04-20.
Powody do rozważenia Większa liczba rdzeni
16 more cores
 8
Lower stated TDP / base power
Power limits alone do not measure performance per watt.
105 W
Wspólne stanowiska Intel Core i9-13900 Procesor w popularnych benchmarkach, dla porównania z innymi modelami.
Powody do rozważenia
Intel Core i9-13900
Informacje ogólne o porównywanych procesorach, serii, generacji i segmencie rynku.
 AMD Ryzen 5000
Ryzen
4
-
Desktop
Desktops / Boxed Processor
Ryzen 5000 Series
Core counts, threads, cache and clock modes describe the CPU configuration. Performance depends on the workload and comparable measured results.
-
-
-
-
normal
8
16
Tak
Tak
3.4 GHz
4.5 GHz
4.5 GHz
4.2 GHz
Internal Graphics nie wpływa na wydajność procesora, wykonuje pracę karty graficznej w przypadku jej braku lub na urządzeniach mobilnych.
-
-
-
-
None
-
-
-
-
-
-
Wbudowane kodeki wykorzystywane do kodowania i dekodowania treści. Znacznie przyspiesza wymagane operacje.
Nie
Nie
Nie
Nie
Nie
Nie
Nie
Nie
Typy, kanały ilość pamięci RAM obsługiwanych przez AMD Ryzen 7 5800X3D oraz Intel Core i9-13900. W zależności od płyt głównych mogą być obsługiwane wyższe lub niższe częstotliwości pamięci.
Tak
128 GB
-
2
DDR4
PCIe 4.0
Tak
Porównaj wymagania TDP Intel Core i9-13900 oraz AMD Ryzen 7 5800X3D Power specifications describe different manufacturer limits. TDP, base power and maximum turbo power are separate values; they do not establish measured system consumption.
90 °C
105 W
-
105 W
Architektura, interfejsy, dodatkowe instrukcje obsługiwane przez Intel Core i9-13900 oraz AMD Ryzen 7 5800X3D, technologie maszyn wirtualnych i technologie procesowe.
Vermeer (Zen 3)
-
x86-64 (64 bit)
SSE4a, SSE4.1, SSE4.2, AVX2, FMA3
4 MB
96 MB
-
2022-04-20
AM4
TSMC 7nm FinFET
AMD-V, SVM
Vermeer
Shared tests with results for both models: 4
Each row uses one Blender version, operating system and compute backend.
| Test and settings | Intel Core i9-13900 | AMD Ryzen 7 5800X3D | Result difference¹ |
|---|---|---|---|
| Blender 5.2.0 / CPU / Windows | 388.183102 samples/min Submissions: 8 | 222.029305 samples/min Submissions: 54 | -42.8 % |
| Blender 4.5.0 / CPU / Windows | 319.733075 samples/min Submissions: 5 | 208.927487 samples/min Submissions: 115 | -34.7 % |
| Blender 4.2.0 / CPU / Windows | 354.424627 samples/min Submissions: 12 | 199.315512 samples/min Submissions: 103 | -43.8 % |
| Blender 4.0.0 / CPU / Windows | 353.267411 samples/min Submissions: 19 | 204.632802 samples/min Submissions: 179 | -42.1 % |
¹ Difference of the second result relative to the first in that row. No percentage is calculated for different upscaling algorithms. This compares published results, not a universal performance index.
These results have no shared test of both models with the same version and settings. They are shown separately without a percentage difference.
Results were obtained on the reported systems. Test versions and settings remain separate; incomplete conditions do not support calculated model performance differences.
| Model | Result | Reported conditions |
|---|---|---|
| AMD Ryzen 7 5800X3D | 7597.91817 H/s | RandomX / XMRig 6.26.0 / 1M / 16 threads / windows System RAM: 48 GB OS: Windows NT 10.0 Motherboard: ASUSTeK COMPUTER INC. / PRIME B450M-A II Duration: 131.615 s User-submitted run; tuning and power settings are incomplete. |
| Model | Result | Reported conditions |
|---|---|---|
| Intel Core i9-13900 | 10112.654976 H/s | RandomX / XMRig 6.22.2 / 1M / 32 threads / windows System RAM: 32 GB OS: Windows NT 10.0 Motherboard: Gigabyte Technology Co., Ltd. / B760M GAMING X AX Duration: 98.886 s User-submitted run; tuning and power settings are incomplete. |


 English
 Russian
 German
 Portuguese
 Italian
 French
 Japan
 Spanish
 Chinese
 Korean