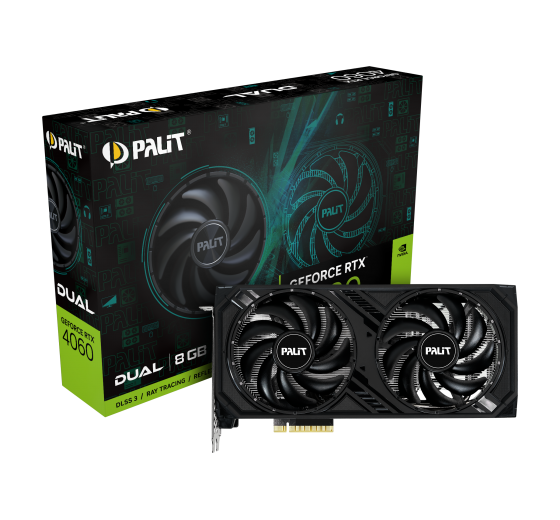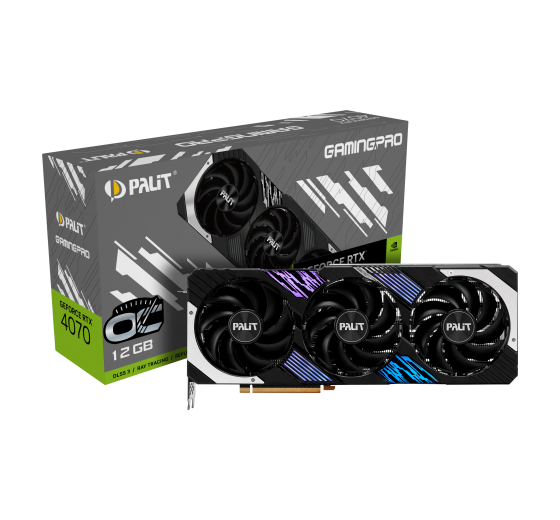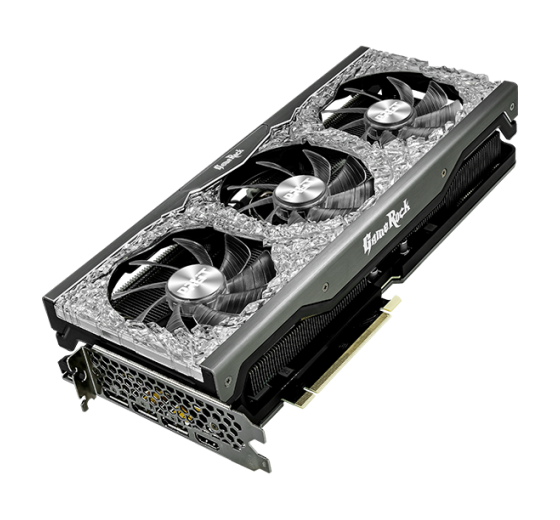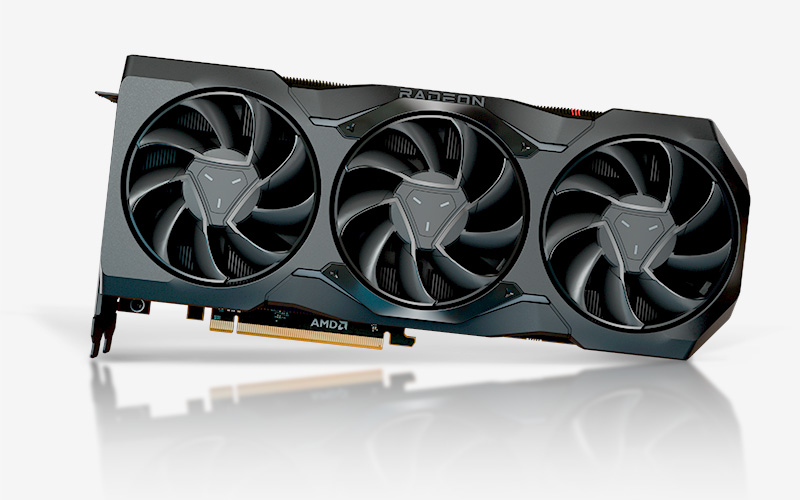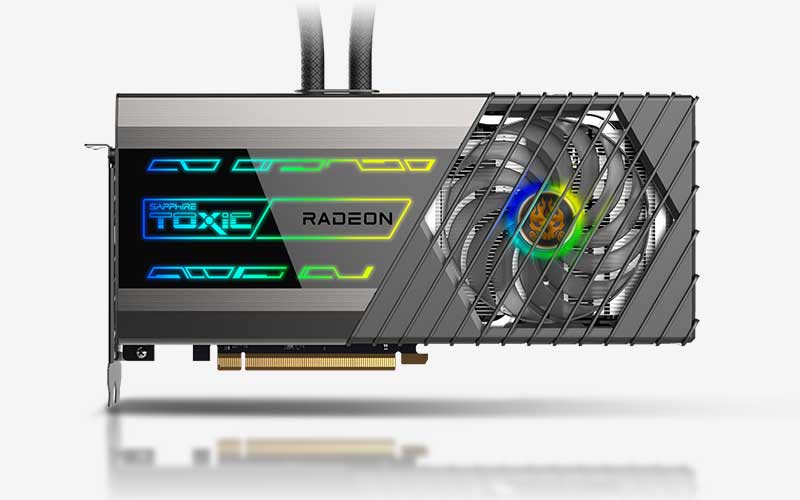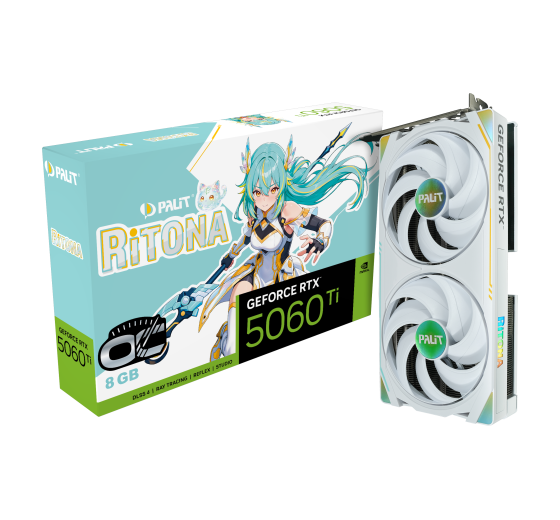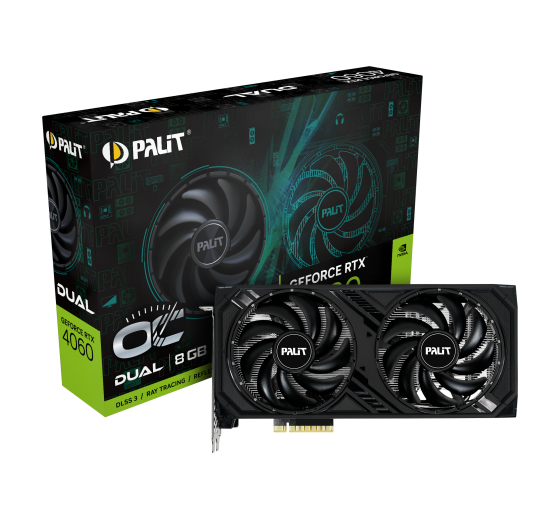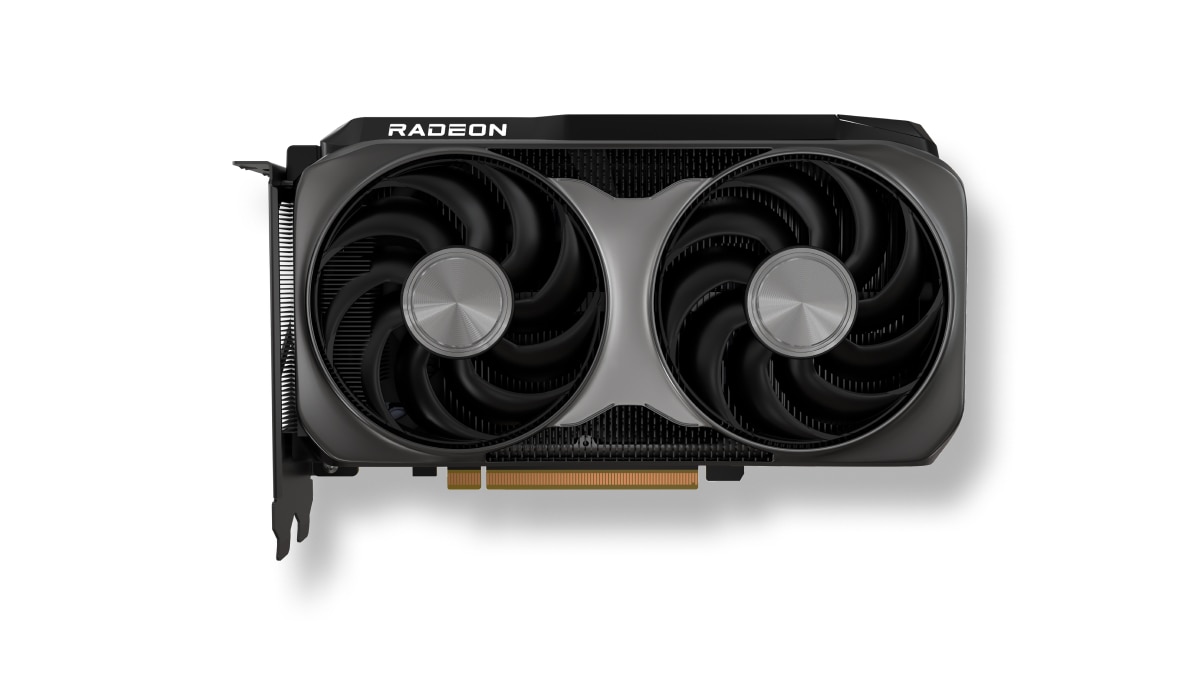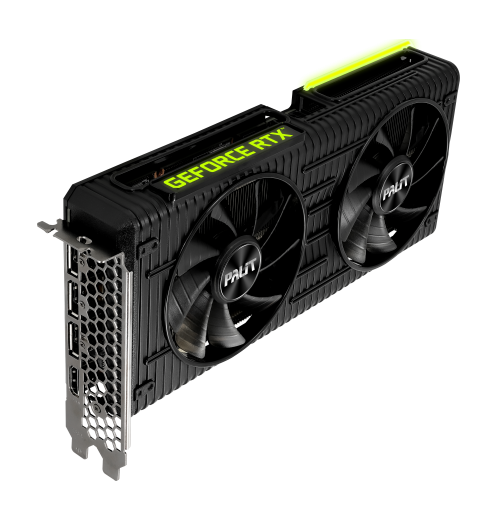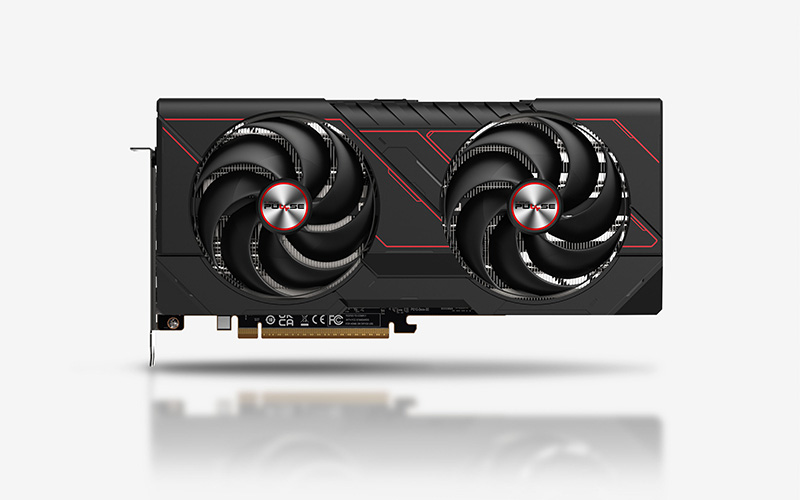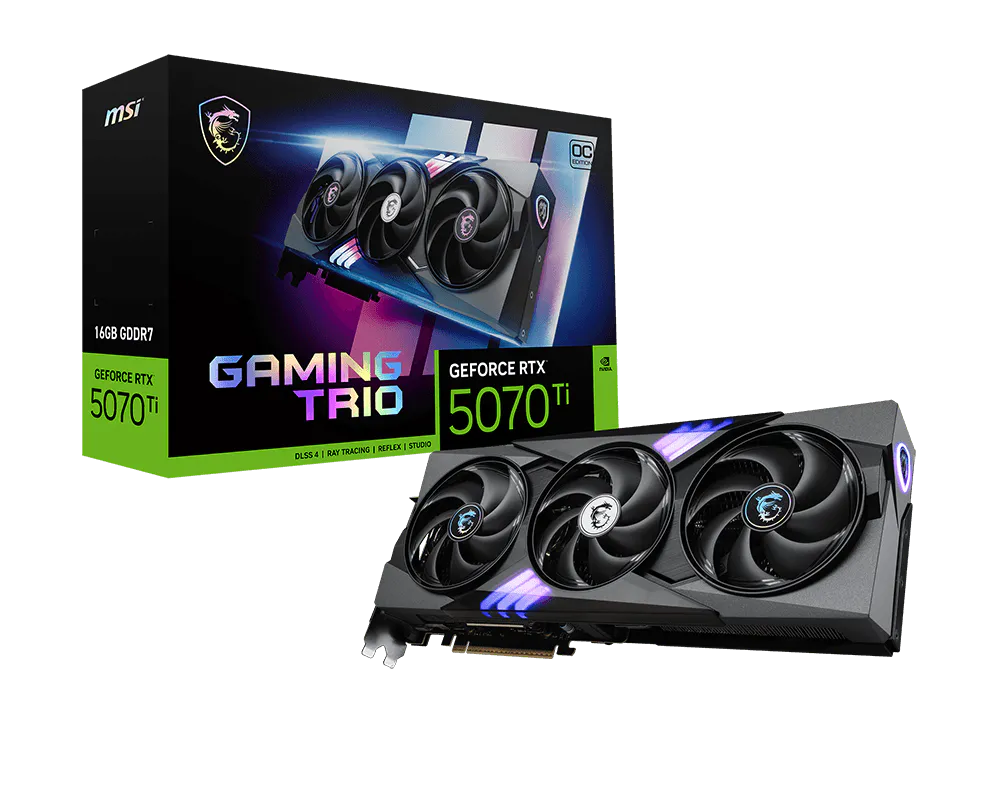

What's the best choice NVIDIA GeForce GTX 1660 Ti or NVIDIA GeForce RTX 3090 Ti? Which graphics card is faster?
Compare the available specifications of these models.
NVIDIA GeForce GTX 1660 Ti has a base frequency of 1.5 GHz. Memory size 6 GB. Memory type GDDR6. Released in Q3/2019.
NVIDIA GeForce RTX 3090 Ti has a base frequency of 1.56 GHz. Memory size 24 GB. Memory type GDDR6X. Released in Q1/2022.
Reasons to consider
Reasons to consider Higher clock speed
Around 4% better clock speed
 1.5 GHz
More memory
300% more memory
6 GB
Common positions NVIDIA GeForce RTX 3090 Ti GPU in popular benchmarks, for comparison with other models.
NVIDIA GeForce GTX 1660 Ti
Comparison of basic technical data of graphics cards NVIDIA GeForce GTX 1660 Ti and NVIDIA GeForce RTX 3090 Ti, chip, information processing units.
 Ampere
10752
-
GA102-350-A1
128 KB
6 MB
112
336
GA102
10752
Ampere
10752
-
GA102-350-A1
128 KB
6 MB
112
336
GA102
10752
Video memory capacity, type, bus width and bandwidth describe different properties. These values alone do not determine graphics performance.
1,008 GB/s
384 bit
-
-
24 GB
GDDR6X
1300 MHz
Published GPU clock frequencies describe different operating modes. Clock speed alone does not determine graphics performance.
1560 MHz
1860 MHz
No
Graphics card power limits and recommended system power supply describe different specifications.
450 W
92 °C
850 W (System power requirement)
450 W
Connectivity and connections.
3 × DisplayPort 1.4a
-
1 × HDMI 2.1
4
HDMI
PCIe 4.0 x16
3x PCIe 8-pin cables (adapter in box) OR 450W or greater PCIe Gen 5 cable
2.3
Technical data that is used to its full potential in computer games.
-
12_2
7680 × 4320
3.0
4.6
6.6
1.3
The difference in size, weight and slot of the compared devices
-
-
-
-
Comparison of interfaces and release dates for GPU NVIDIA GeForce RTX 3090 Ti and NVIDIA GeForce GTX 1660 Ti.
NVIDIA Founders Edition/reference design. Clock specifications apply to gaming use. AIB shipping specifications and complete-system power needs may differ.
-
8 nm
-
40 TFLOPS
40 TFLOPS
0.625 TFLOPS
208.3 GPixel/s
625.0 GTexel/s
Shared tests with results for both models: 14
Each row uses one Blender version, operating system and compute backend.
| Test and settings | NVIDIA GeForce GTX 1660 Ti | NVIDIA GeForce RTX 3090 Ti | Result difference¹ |
|---|---|---|---|
| Blender 5.2.0 / OPTIX / Windows | 682.003803 samples/min Submissions: 22 | 5250.819731 samples/min Submissions: 11 | +669.9 % |
| Blender 5.1.1 / OPTIX / Linux | 740.029214 samples/min Submissions: 8 | 5601.471369 samples/min Submissions: 7 | +656.9 % |
| Blender 5.1.1 / OPTIX / Windows | 686.620607 samples/min Submissions: 18 | 5459.157697 samples/min Submissions: 5 | +695.1 % |
| Blender 4.5.0 / OPTIX / Linux | 786.110434 samples/min Submissions: 8 | 5309.43807 samples/min Submissions: 24 | +575.4 % |
| Blender 4.5.0 / OPTIX / Windows | 741.389241 samples/min Submissions: 54 | 5585.151795 samples/min Submissions: 115 | +653.3 % |
| Blender 4.4.0 / OPTIX / Linux | 768.158139 samples/min Submissions: 12 | 4979.851473 samples/min Submissions: 8 | +548.3 % |
| Blender 4.4.0 / OPTIX / Windows | 743.205149 samples/min Submissions: 26 | 5700.575741 samples/min Submissions: 51 | +667.0 % |
| Blender 4.3.0 / OPTIX / Windows | 755.765834 samples/min Submissions: 19 | 5490.159484 samples/min Submissions: 35 | +626.4 % |
| Blender 4.2.0 / OPTIX / Linux | 759.319183 samples/min Submissions: 9 | 5972.585335 samples/min Submissions: 15 | +686.6 % |
| Blender 4.2.0 / OPTIX / Windows | 740.194812 samples/min Submissions: 45 | 5673.136912 samples/min Submissions: 51 | +666.4 % |
| Blender 4.1.0 / OPTIX / Linux | 802.562755 samples/min Submissions: 5 | 6034.022292 samples/min Submissions: 7 | +651.8 % |
| Blender 4.1.0 / OPTIX / Windows | 788.558198 samples/min Submissions: 19 | 5769.869986 samples/min Submissions: 32 | +631.7 % |
| Test and settings | NVIDIA GeForce GTX 1660 Ti | NVIDIA GeForce RTX 3090 Ti | Result difference¹ |
|---|---|---|---|
| Blender 4.0.0 / OPTIX / Linux | 803.98389 samples/min Submissions: 6 | 6168.026652 samples/min Submissions: 16 | +667.2 % |
| Blender 4.0.0 / OPTIX / Windows | 776.75797 samples/min Submissions: 72 | 5124.064923 samples/min Submissions: 111 | +559.7 % |
¹ Difference of the second result relative to the first in that row. No percentage is calculated for different upscaling algorithms. This compares published results, not a universal performance index.
These results have no shared test of both models with the same version and settings. They are shown separately without a percentage difference.


 Russian
 German
 Portuguese
 Italian
 French
 Japan
Japan Spanish
 Polish
 Chinese
 Korean