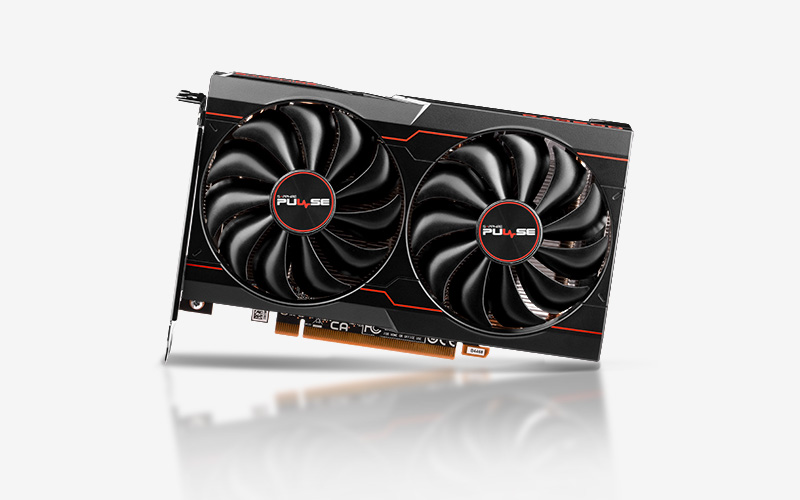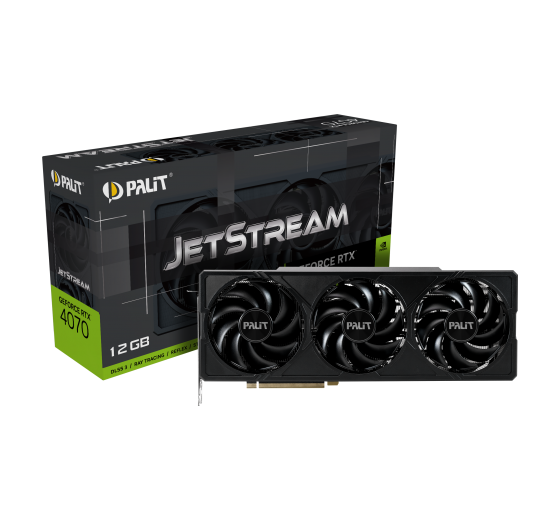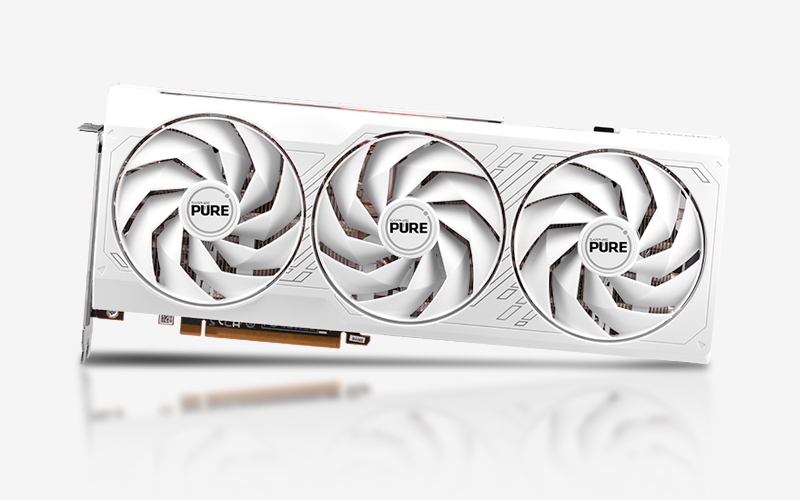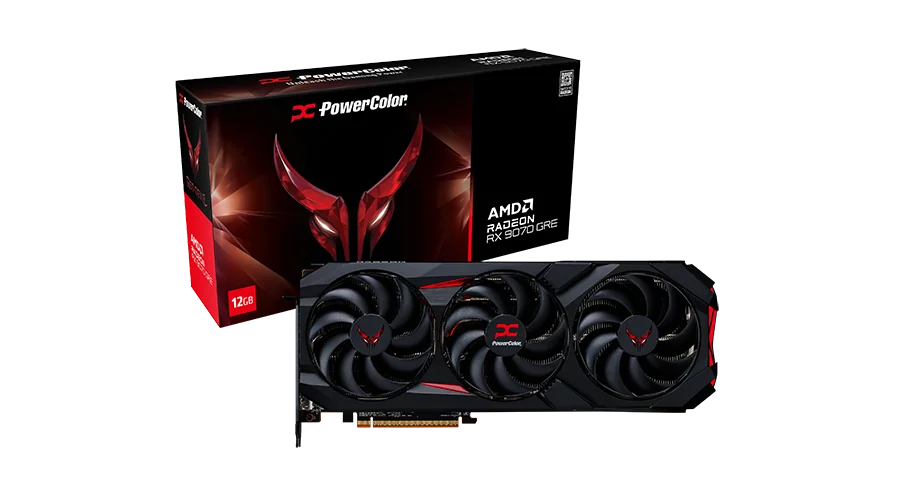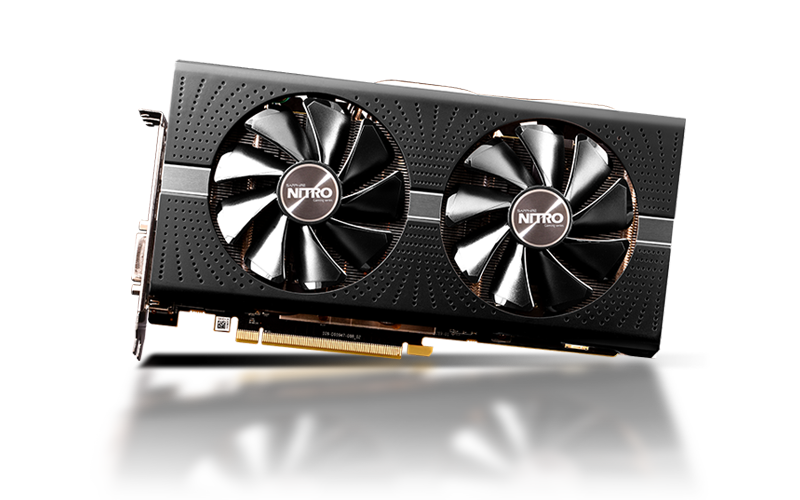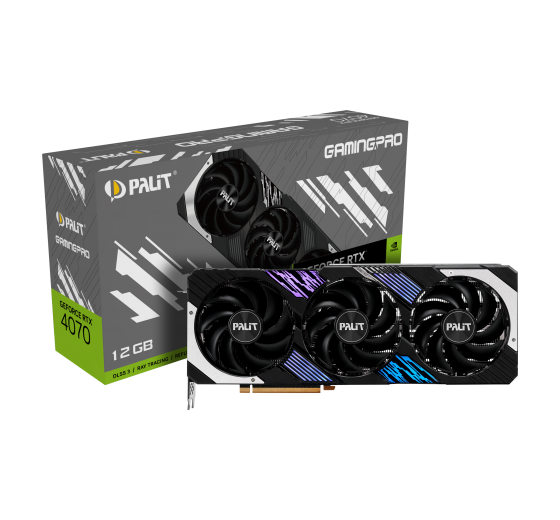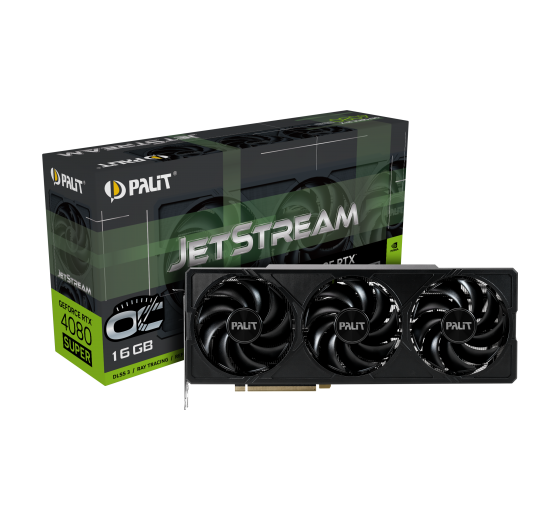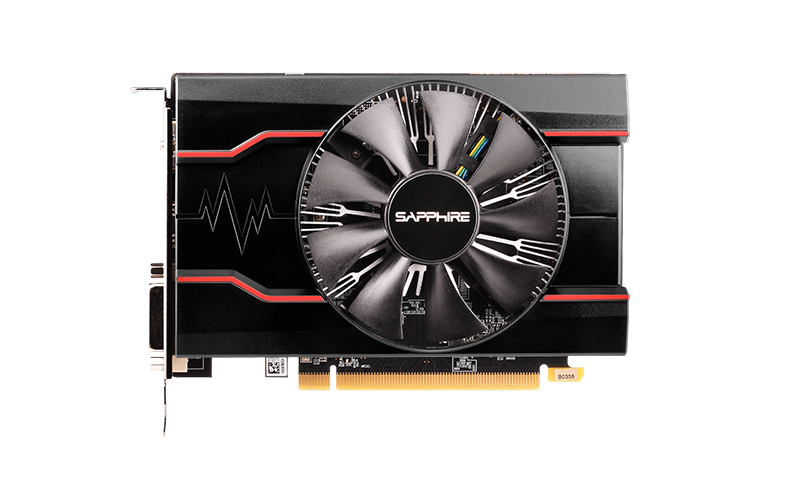

什么是最好的选择 Gainward GeForce RTX 2070 或 INNO3D GeForce RTX 2070 Twin X2? 哪种显卡速度更快?
我们准备了一份比较,帮助你选择最好的显卡。比较它们的规格和基准。
Gainward GeForce RTX 2070 has a base frequency of 1.410 GHz. 内存大小 8 GB. 存储器类型 GDDR6. 发布于 Q4/2018.
INNO3D GeForce RTX 2070 Twin X2 has a base frequency of 1.410 GHz. 内存大小 8 GB. 存储器类型 GDDR6. 发布于 Q2/2019.
需要考虑的原因 在总排名中的位置
(基于几个基准)
 地点
地点
共同立场 Gainward GeForce RTX 2070 在流行的基准测试中的GPU,用于与其他模型进行比较.
在总排名中的位置
(基于几个基准)
地点
共同立场 INNO3D GeForce RTX 2070 Twin X2 在流行的基准测试中的GPU,用于与其他模型进行比较.
Gainward GeForce RTX 2070
显卡的基本技术数据比较 Gainward GeForce RTX 2070 和 INNO3D GeForce RTX 2070 Twin X2, 芯片,信息处理单元.
 NVIDIA GeForce RTX 2070
36
TU106
64
2304
144
NVIDIA GeForce RTX 2070
36
TU106
64
2304
144
Video memory capacity, type, bus width and bandwidth describe different properties. These values alone do not determine graphics performance.
448 GB/s
256 bit
8 GB
1750 MHz
GDDR6
Published GPU clock frequencies describe different operating modes. Clock speed alone does not determine graphics performance.
1410 MHz
1620 MHz
-
是
Graphics card power limits and recommended system power supply describe different specifications.
-
175 W
-
用于显卡冷却系统的冷却器的类型和尺寸 Gainward GeForce RTX 2070 和 INNO3D GeForce RTX 2070 Twin X2.
Air cooling
Axial
2 x 80 mm
-
0 dB / Silent
-
连通性和连接.
3 × DisplayPort 1.4a
-
2.2
1 × HDMI 2.0b
4
PCIe 3.0 x16
1 x 8-Pin
-
-
在电脑游戏中被充分使用的技术数据.
12_2
是
No LED lighting
7680 × 4320
是
内置对视频和图像压缩标准的支持.
没有
Decode / Encode
Decode / Encode
Decode
Decode
所比较的设备在尺寸、重量和插槽上的差异
113 mm
196 mm
2 PCIe-Slots
-
-
GPU的接口和发布日期的比较 INNO3D GeForce RTX 2070 Twin X2 和 Gainward GeForce RTX 2070.
data sheet
-
N20702-08D6-1710VA23
12 nm
Q2/2019
Shared tests with results for both models: 2
Each row is a separate graphics subtest. Scores are not game FPS.
| Test and settings | Gainward GeForce RTX 2070 | INNO3D GeForce RTX 2070 Twin X2 | Result difference¹ |
|---|---|---|---|
| 3DMark – Steel Nomad — Steel Nomad Score / DirectX 12 | 2095 points Base GPU test: Nvidia GeForce RTX 2070 VRAM: 8 GBOS: Windows 11Graphics API: DirectX 12HVCI: enabledApplication version unreported | 2095 points Base GPU test: Nvidia GeForce RTX 2070 VRAM: 8 GBOS: Windows 11Graphics API: DirectX 12HVCI: enabledApplication version unreported | 0.0 % |
| 3DMark – Time Spy — Graphics Score / DirectX 12 | 8874 points Base GPU test: Nvidia GeForce RTX 2070 VRAM: 8 GBTest CPU: AMD Ryzen 9 7950X3DOS: Windows 11Graphics API: DirectX 12HVCI: enabledApplication version unreported | 8874 points Base GPU test: Nvidia GeForce RTX 2070 VRAM: 8 GBTest CPU: AMD Ryzen 9 7950X3DOS: Windows 11Graphics API: DirectX 12HVCI: enabledApplication version unreported | 0.0 % |
¹ Difference of the second result relative to the first in that row. No percentage is calculated for different upscaling algorithms. This compares published results, not a universal performance index.
A base GPU test is a reference for cards using that GPU and the same memory capacity. Board overclocking, cooling and power limits can change the result.
根据几个流行的基准测试的结果,你可以更准确地估计出以下几个方面的性能差异 Gainward GeForce RTX 2070 和 INNO3D GeForce RTX 2070 Twin X2.
比较合成基准,选择最适合你的显卡!
These are saved results from the earlier catalog. Measurement dates and test configurations were not recorded. Models with no comparable results are omitted.
Recent models: test results with identified primary sources — Game frame rates
Archived results. The original measurement method and test conditions have not been verified.
Higher values are better in this metric.
Higher values are better in this metric.
Higher values are better in this metric.
Higher values are better in this metric.
Higher values are better in this metric.
Higher values are better in this metric.
Higher values are better in this metric.
Higher values are better in this metric.


 English
 Russian
 German
 Portuguese
 Italian
 French
 Japan
Japan Spanish
 Polish
 Korean