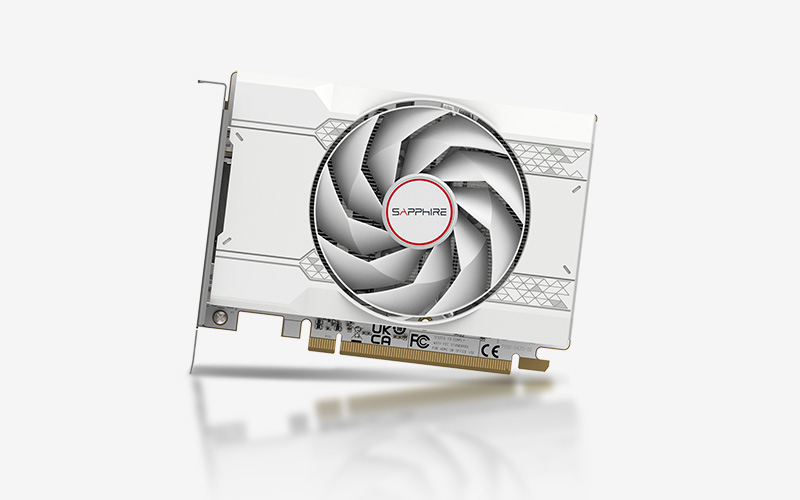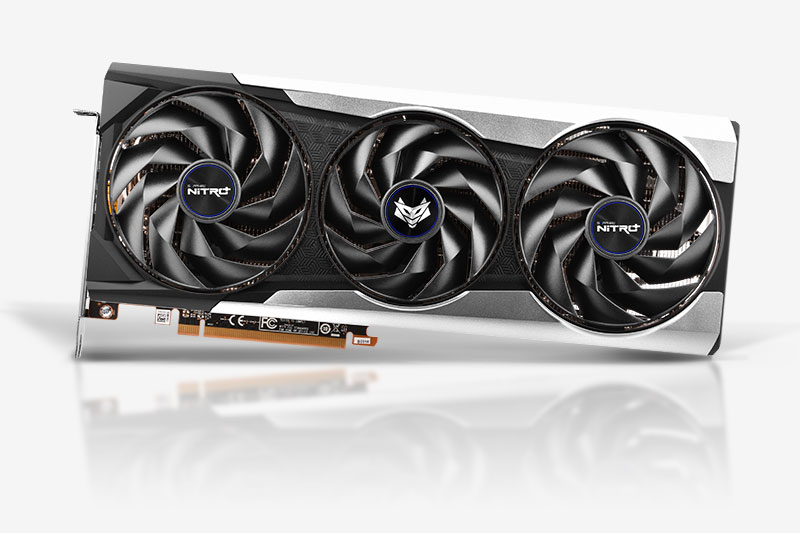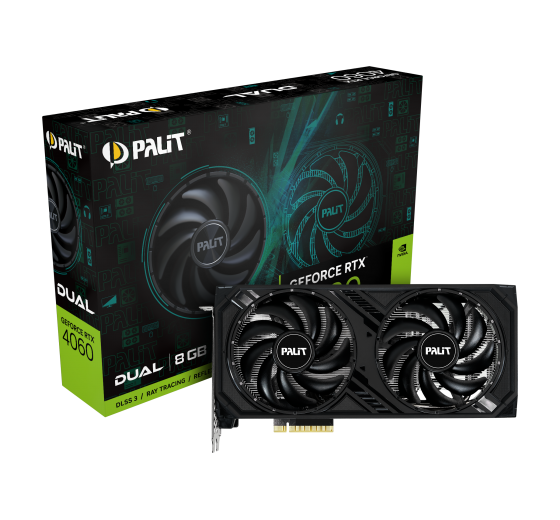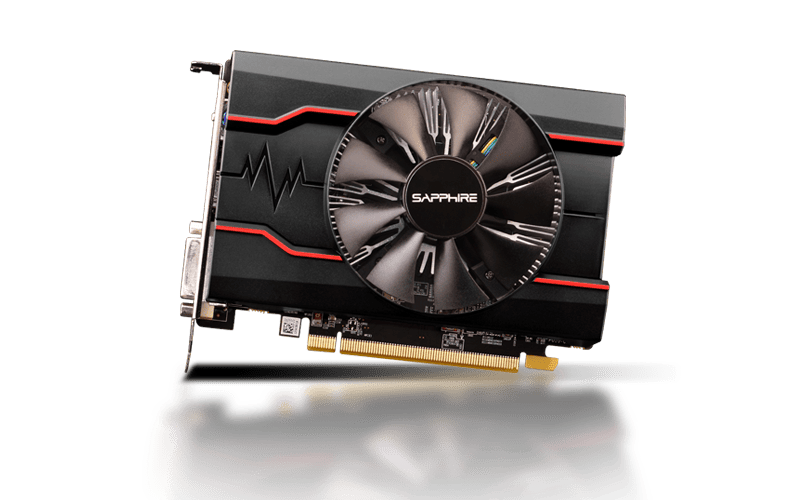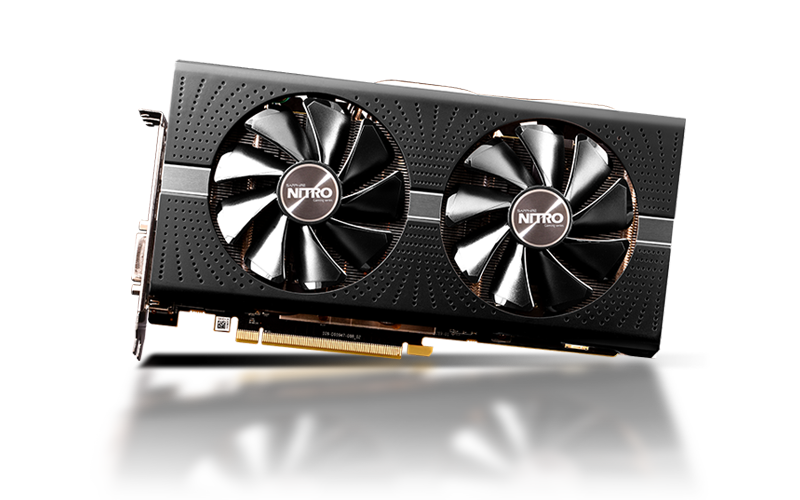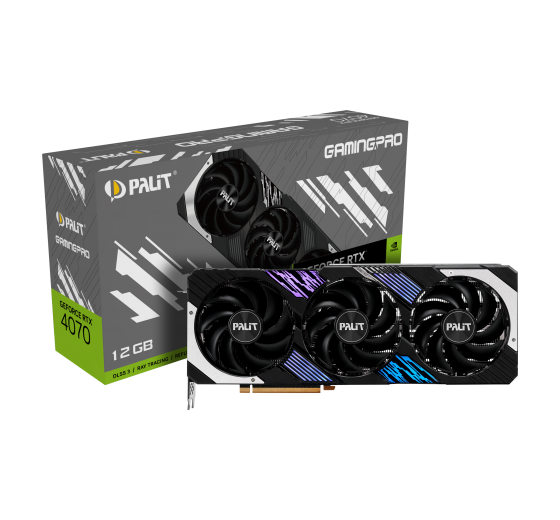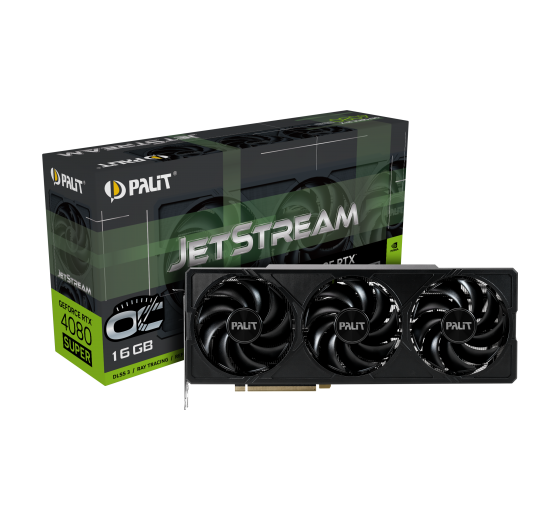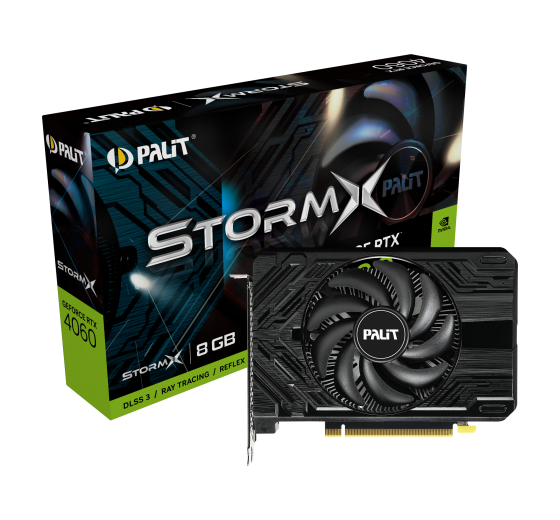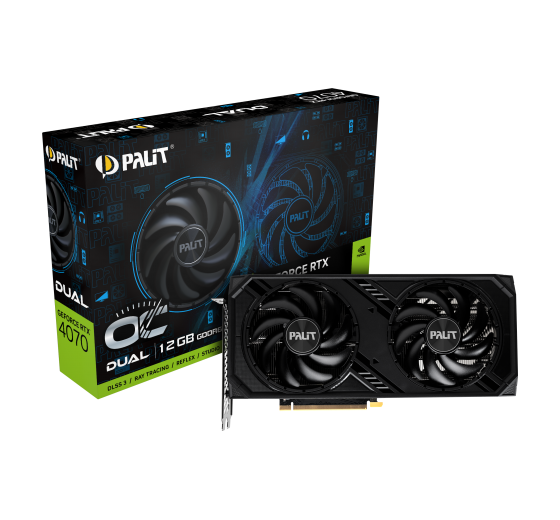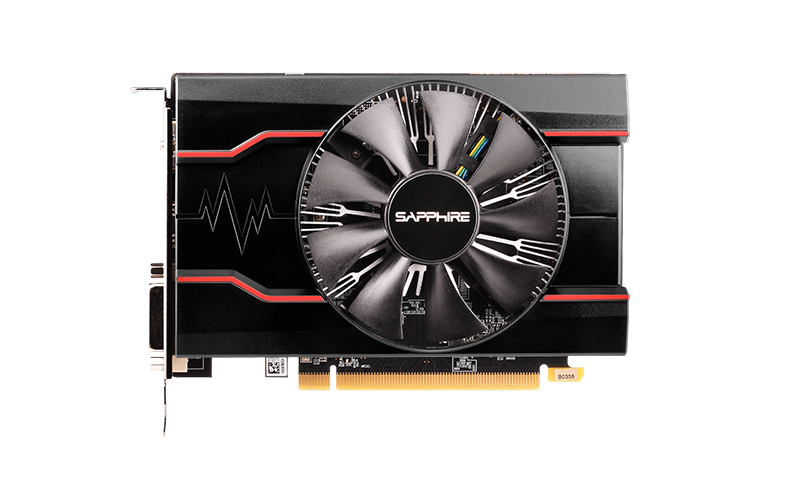

최선의 선택은 무엇인가요? Gainward GeForce RTX 2070 또는 INNO3D GeForce RTX 2070 Twin X2? 어떤 그래픽 카드가 더 빠르나요?
최고의 그래픽 카드를 선택하는 데 도움이 되는 비교 자료를 준비했습니다. 사양과 벤치마크를 비교해 보세요.
Gainward GeForce RTX 2070 has a base frequency of 1.410 GHz. 메모리 크기 8 GB. 메모리 유형 GDDR6. 에 출시 Q4/2018.
INNO3D GeForce RTX 2070 Twin X2 has a base frequency of 1.410 GHz. 메모리 크기 8 GB. 메모리 유형 GDDR6. 에 출시 Q2/2019.
고려해야 하는 이유 전체 랭킹 순위
(여러 벤치마크 기준)
 장소
장소
공통 위치 Gainward GeForce RTX 2070 다른 모델과의 비교를 위한 인기 벤치마크의 GPU.
고려해야 하는 이유 전체 랭킹 순위
(여러 벤치마크 기준)
장소
공통 위치 INNO3D GeForce RTX 2070 Twin X2 다른 모델과의 비교를 위한 인기 벤치마크의 GPU.
Gainward GeForce RTX 2070
그래픽 카드의 기본 기술 데이터 비교 Gainward GeForce RTX 2070 그리고 INNO3D GeForce RTX 2070 Twin X2, 칩, 정보 처리 장치.
 NVIDIA GeForce RTX 2070
36
TU106
64
2304
144
NVIDIA GeForce RTX 2070
36
TU106
64
2304
144
Video memory capacity, type, bus width and bandwidth describe different properties. These values alone do not determine graphics performance.
448 GB/s
256 bit
8 GB
1750 MHz
GDDR6
Published GPU clock frequencies describe different operating modes. Clock speed alone does not determine graphics performance.
1410 MHz
1620 MHz
-
예
Graphics card power limits and recommended system power supply describe different specifications.
-
175 W
-
그래픽 카드 냉각 시스템용 쿨러의 종류와 크기 Gainward GeForce RTX 2070 그리고 INNO3D GeForce RTX 2070 Twin X2.
Air cooling
Axial
2 x 80 mm
-
0 dB / Silent
-
연결 및 연결.
3 × DisplayPort 1.4a
-
2.2
1 × HDMI 2.0b
4
PCIe 3.0 x16
1 x 8-Pin
-
-
컴퓨터 게임에서 최대한 활용되는 기술 데이터.
12_2
예
No LED lighting
7680 × 4320
예
비디오 및 이미지 압축 표준 기본 지원.
아니요
Decode / Encode
Decode / Encode
Decode
Decode
비교 장치의 크기, 무게 및 슬롯 차이
113 mm
196 mm
2 PCIe-Slots
-
-
GPU의 인터페이스 및 출시일 비교 INNO3D GeForce RTX 2070 Twin X2 그리고 Gainward GeForce RTX 2070.
data sheet
-
N20702-08D6-1710VA23
12 nm
Q2/2019
Shared tests with results for both models: 2
Each row is a separate graphics subtest. Scores are not game FPS.
| Test and settings | Gainward GeForce RTX 2070 | INNO3D GeForce RTX 2070 Twin X2 | Result difference¹ |
|---|---|---|---|
| 3DMark – Steel Nomad — Steel Nomad Score / DirectX 12 | 2095 points Base GPU test: Nvidia GeForce RTX 2070 VRAM: 8 GBOS: Windows 11Graphics API: DirectX 12HVCI: enabledApplication version unreported | 2095 points Base GPU test: Nvidia GeForce RTX 2070 VRAM: 8 GBOS: Windows 11Graphics API: DirectX 12HVCI: enabledApplication version unreported | 0.0 % |
| 3DMark – Time Spy — Graphics Score / DirectX 12 | 8874 points Base GPU test: Nvidia GeForce RTX 2070 VRAM: 8 GBTest CPU: AMD Ryzen 9 7950X3DOS: Windows 11Graphics API: DirectX 12HVCI: enabledApplication version unreported | 8874 points Base GPU test: Nvidia GeForce RTX 2070 VRAM: 8 GBTest CPU: AMD Ryzen 9 7950X3DOS: Windows 11Graphics API: DirectX 12HVCI: enabledApplication version unreported | 0.0 % |
¹ Difference of the second result relative to the first in that row. No percentage is calculated for different upscaling algorithms. This compares published results, not a universal performance index.
A base GPU test is a reference for cards using that GPU and the same memory capacity. Board overclocking, cooling and power limits can change the result.
여러 유명 벤치마크의 결과를 기반으로 다음과 같은 성능 차이를 보다 정확하게 예측할 수 있습니다. Gainward GeForce RTX 2070 그리고 INNO3D GeForce RTX 2070 Twin X2.
가상 벤치마크를 비교하고 자신에게 가장 적합한 그래픽 카드를 선택하세요!
These are saved results from the earlier catalog. Measurement dates and test configurations were not recorded. Models with no comparable results are omitted.
Recent models: test results with identified primary sources — Game frame rates
Archived results. The original measurement method and test conditions have not been verified.
Higher values are better in this metric.
Higher values are better in this metric.
Higher values are better in this metric.
Higher values are better in this metric.
Higher values are better in this metric.
Higher values are better in this metric.
Higher values are better in this metric.
Higher values are better in this metric.


 English
 Russian
 German
 Portuguese
 Italian
 French
 Japan
Japan Spanish
 Polish
 Chinese