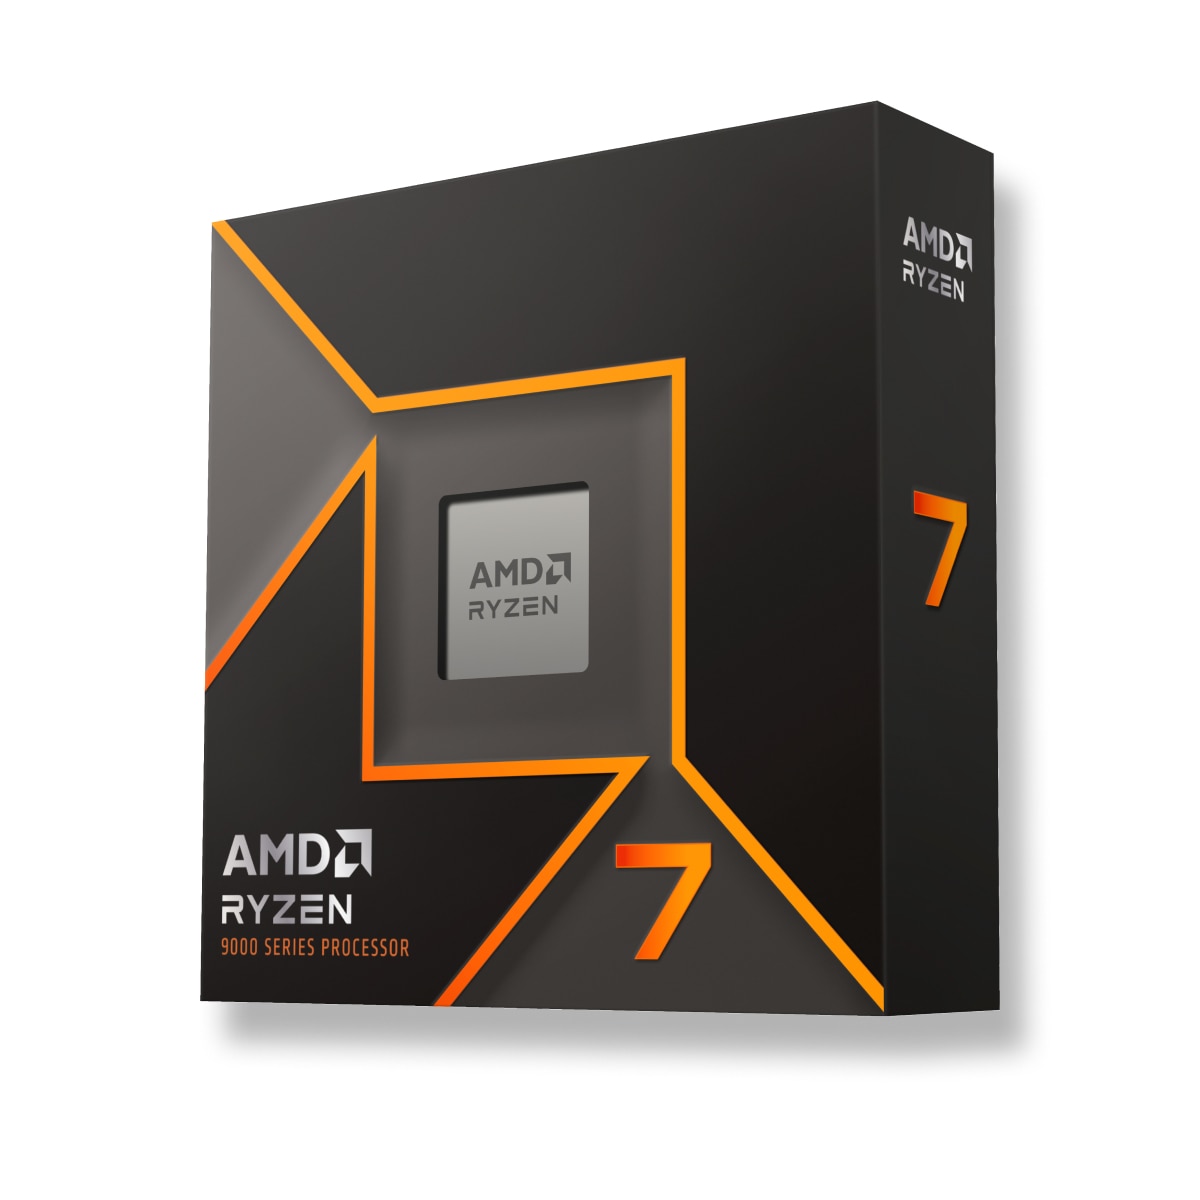
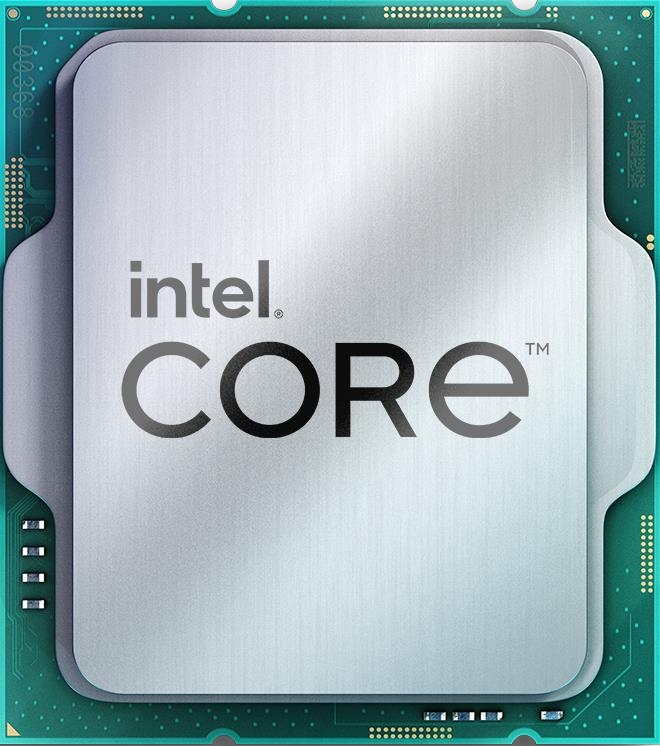
Family illustration.
What's the best choice AMD Ryzen 7 9700X or Intel Core i5-14600K? Which processor is faster?
Compare the available specifications of these models.
AMD Ryzen 7 9700X has a base frequency of 3.8 GHz. 8 / 16 CPU Cores / Threads. Stated TDP / base power 65 W. Released in 2024-08-08.
Intel Core i5-14600K has a base frequency of 3.50 GHz. 14 / 20 CPU Cores / Threads. Stated TDP / base power 125 W. Released in Q4/2023.
Reasons to consider Higher clock speed
Around 9% better clock speed
 3.50 GHz
Higher turbo clock speed
Around 4% higher specified turbo frequency
5.30 GHz
Lower stated TDP / base power
Power limits alone do not measure performance per watt.
125 W
Reasons to consider More number of cores
6 more cores
8
AMD Ryzen 7 9700X
Background information about the processors being compared, series, generation and market segment.
 Intel Core i (14th Gen)
-
Desktop
-
Intel Core i (14th Gen)
-
Desktop
-
Core counts, threads, cache and clock modes describe the CPU configuration. Performance depends on the workload and comparable measured results.
3.5 GHz
14
20
-
-
5.3 GHz
2.6 GHz
4 GHz
8
3.5 GHz
5.3 GHz
6
Internal Graphics does not affect the performance of the CPU, performs the work of the graphics card in its absence or on mobile devices.
300 MHz
Intel UHD Graphics 770
-
32
1550 MHz
Types, channel quantity of RAM supported by Intel Core i5-14600K and AMD Ryzen 7 9700X. Depending on the motherboards, higher or lower memory frequencies may be supported.
2
DDR5-5600 / DDR4-3200
-
192 GB
Compare the TDP requirements of TDP AMD Ryzen 7 9700X and Intel Core i5-14600K Power specifications describe different manufacturer limits. TDP, base power and maximum turbo power are separate values; they do not establish measured system consumption.
-
-
125 W
181 W
Architecture, interfaces, additional instructions supported by AMD Ryzen 7 9700X and Intel Core i5-14600K, virtual machine technologies and process technology.
Raptor Lake
-
-
20 MB
24 MB
Q4/2023
FCLGA1700
Intel 7
24 MB
Shared tests with results for both models: 11
Each row uses one Blender version, operating system and compute backend.
| Test and settings | AMD Ryzen 7 9700X | Intel Core i5-14600K | Result difference¹ |
|---|---|---|---|
| Blender 5.2.0 / CPU / Linux | 339.305393 samples/min Submissions: 18 | 343.604474 samples/min Submissions: 5 | +1.3 % |
| Blender 5.2.0 / CPU / Windows | 310.396961 samples/min Submissions: 51 | 318.74675 samples/min Submissions: 21 | +2.7 % |
| Blender 5.1.1 / CPU / Linux | 371.865671 samples/min Submissions: 32 | 338.239757 samples/min Submissions: 12 | -9.0 % |
| Blender 5.1.1 / CPU / Windows | 320.473967 samples/min Submissions: 79 | 311.979665 samples/min Submissions: 7 | -2.7 % |
| Blender 5.1.0 / CPU / Windows | 311.067135 samples/min Submissions: 35 | 322.758515 samples/min Submissions: 17 | +3.8 % |
| Blender 4.5.0 / CPU / Linux | 334.163366 samples/min Submissions: 36 | 300.096793 samples/min Submissions: 8 | -10.2 % |
| Blender 4.5.0 / CPU / Windows | 304.57062 samples/min Submissions: 403 | 299.897209 samples/min Submissions: 93 | -1.5 % |
| Blender 4.4.0 / CPU / Windows | 282.660046 samples/min Submissions: 115 | 301.862874 samples/min Submissions: 47 | +6.8 % |
| Blender 4.3.0 / CPU / Windows | 279.963397 samples/min Submissions: 158 | 297.597714 samples/min Submissions: 32 | +6.3 % |
| Blender 4.2.0 / CPU / Windows | 286.426028 samples/min Submissions: 109 | 293.011509 samples/min Submissions: 48 | +2.3 % |
| Blender 4.1.0 / CPU / Windows | 306.671773 samples/min Submissions: 5 | 303.901316 samples/min Submissions: 31 | -0.9 % |
¹ Difference of the second result relative to the first in that row. No percentage is calculated for different upscaling algorithms. This compares published results, not a universal performance index.
These results have no shared test of both models with the same version and settings. They are shown separately without a percentage difference.
Published measurements are separate from the archived index. Incomplete conditions and unknown run counts do not support ranking positions or calculated performance differences.
| Model | Test | Result | Reported conditions |
|---|---|---|---|
| Intel Core i5-14600K | Cinebench 2024 / multi-core | 1392 points | Graphics card: GeForce RTX 4090 System RAM: 32 GB |
| AMD Ryzen 7 9700X | Cinebench 2024 / multi-core | 1203 points | Graphics card: GeForce RTX 4090 System RAM: 32 GB |
| AMD Ryzen 7 9700X | Cinebench 2024 / single-core | 136 points | Graphics card: GeForce RTX 4090 System RAM: 32 GB |
| Intel Core i5-14600K | Cinebench 2024 / single-core | 122 points | Graphics card: GeForce RTX 4090 System RAM: 32 GB |
| Intel Core i5-14600K | Cinebench R15 / multi-core | 3640 points | Graphics card: GeForce RTX 4090 System RAM: 32 GB |
| AMD Ryzen 7 9700X | Cinebench R15 / multi-core | 3178 points | Graphics card: GeForce RTX 4090 System RAM: 32 GB |
| AMD Ryzen 7 9700X | Cinebench R15 / single-core | 346 points | Graphics card: GeForce RTX 4090 System RAM: 32 GB |
| Intel Core i5-14600K | Cinebench R15 / single-core | 297 points | Graphics card: GeForce RTX 4090 System RAM: 32 GB |
| Intel Core i5-14600K | Cinebench R20 / multi-core | 9371 points | Graphics card: GeForce RTX 4090 System RAM: 32 GB |
| AMD Ryzen 7 9700X | Cinebench R20 / multi-core | 7956 points | Graphics card: GeForce RTX 4090 System RAM: 32 GB |
| AMD Ryzen 7 9700X | Cinebench R20 / single-core | 870 points | Graphics card: GeForce RTX 4090 System RAM: 32 GB |
| Intel Core i5-14600K | Cinebench R20 / single-core | 790 points | Graphics card: GeForce RTX 4090 System RAM: 32 GB |
| Intel Core i5-14600K | Cinebench R23 / multi-core | 24491 points | Graphics card: GeForce RTX 4090 System RAM: 32 GB |
| AMD Ryzen 7 9700X | Cinebench R23 / multi-core | 20485 points | Graphics card: GeForce RTX 4090 System RAM: 32 GB |
| AMD Ryzen 7 9700X | Cinebench R23 / single-core | 2211 points | Graphics card: GeForce RTX 4090 System RAM: 32 GB |
| Intel Core i5-14600K | Cinebench R23 / single-core | 2064 points | Graphics card: GeForce RTX 4090 System RAM: 32 GB |
| AMD Ryzen 7 9700X | RandomX / XMRig 6.22.2 / 10M / 16 threads | 14490.17 H/s | System RAM: 64 GB OS: Windows NT 10.0 Motherboard: ASRock / B850I Lightning WiFi Duration: 690.123 s |
Results were obtained on the reported systems. Test versions and settings remain separate; incomplete conditions do not support calculated model performance differences.
| Model | Result | Reported conditions |
|---|---|---|
| AMD Ryzen 7 9700X | 12730.096494 H/s | RandomX / XMRig 6.26.0 / 1M / 16 threads / windows System RAM: 32 GB OS: Windows NT 10.0 Motherboard: ASUSTeK COMPUTER INC. / ROG STRIX X870E-E GAMING WIFI Duration: 78.554 s User-submitted run; tuning and power settings are incomplete. |
| Model | Result | Reported conditions |
|---|---|---|
| Intel Core i5-14600K | 6351.182273 H/s | RandomX / XMRig 6.26.0 / 1M / 20 threads / windows System RAM: 32 GB OS: Windows NT 10.0 Motherboard: Gigabyte Technology Co., Ltd. / B760M GAMING X AX Duration: 157.451 s User-submitted run; tuning and power settings are incomplete. |


 Russian
 German
 Portuguese
 Italian
 French
 Japan
Japan Spanish
 Polish
 Chinese
 Korean