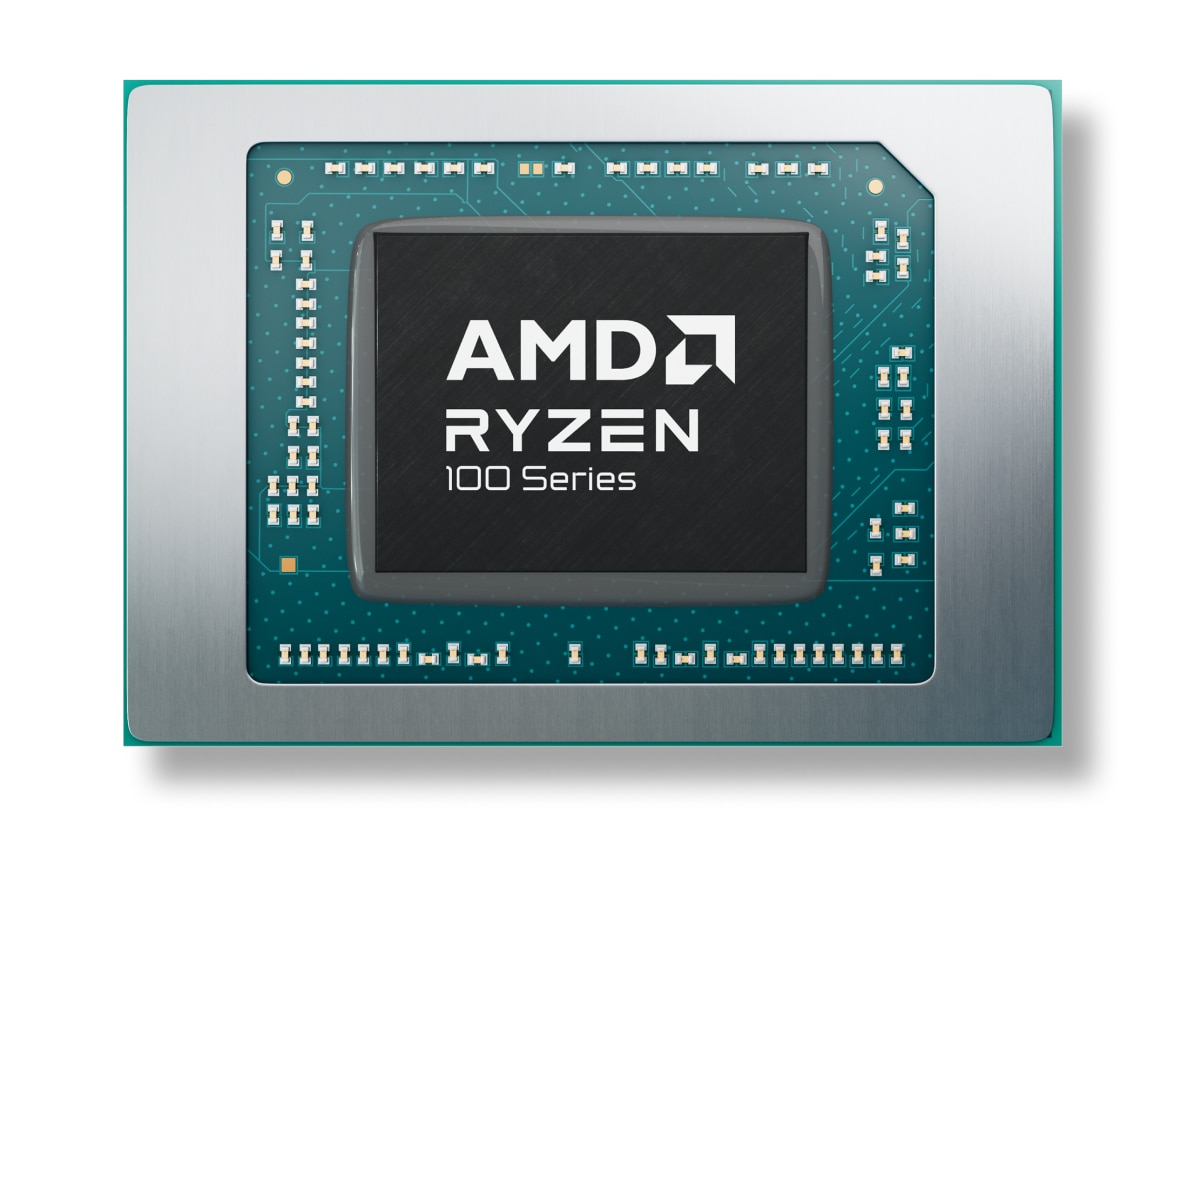
什么是最好的选择 AMD Ryzen 7 7800X3D 或 Intel Core i5-12500H? 哪种处理器更快?
我们准备了一份比较,帮助你选择最好的处理器。比较它们的规格和基准。
AMD Ryzen 7 7800X3D has a base frequency of 4.2 GHz. 8 / 16 CPU Cores / Threads. Stated TDP / base power 120 W. 发布于 2023-04-06.
Intel Core i5-12500H has a base frequency of 2.50 GHz. 12 / 16 CPU Cores / Threads. Stated TDP / base power 45 W. 发布于 Q1/2022.
需要考虑的原因 更高的时钟速度
左右 68% 更好的时钟速度
 2.50 GHz
更高的涡轮增压时钟速度
左右 11% higher specified turbo frequency
4.50 GHz
共同立场 AMD Ryzen 7 7800X3D 在流行的基准测试中的CPU,用于与其他型号进行比较.
需要考虑的原因 更多的核心数量
4 more cores
8
Lower stated TDP / base power
Power limits alone do not measure performance per watt.
120 W
共同立场 Intel Core i5-12500H 在流行的基准测试中的CPU,用于与其他型号进行比较.
AMD Ryzen 7 7800X3D
有关被比较的处理器、系列、代数和细分市场的背景信息。
 Intel Core i 12000H
Intel Core i5
-
12
Intel Core i5-11500H
Mobile
-
Core counts, threads, cache and clock modes describe the CPU configuration. Performance depends on the workload and comparable measured results.
2.5 GHz
hybrid (big.LITTLE)
-
12
16
是
-
没有
4.5 GHz
-
4x Golden Cove
8x Gracemont
3.2 GHz
内部图形不影响CPU的性能,在没有显卡或在移动设备上执行显卡的工作。
12.1
80
13
400 MHz
Intel Iris Xe Graphics 80 (Alder Lake)
1300 MHz
-
4
64 GB
Q1/2022
640
10 nm
用于编码和解码内容的内置编解码器。大大地加快了所需的操作。
Decode
Decode / Encode
Decode / Encode
Decode / Encode
Decode / Encode
Decode
Decode
Decode / Encode
支持的RAM的类型、通道数量 Intel Core i5-12500H 和 AMD Ryzen 7 7800X3D. 根据主板的不同,可能支持更高或更低的内存频率。
没有
64 GB
-
2
DDR4-3200DDR5-4800LPDDR4X-4266LPDDR5-5200
4.0 x 28
是
比较TDP的要求 AMD Ryzen 7 7800X3D 和 Intel Core i5-12500H Power specifications describe different manufacturer limits. TDP, base power and maximum turbo power are separate values; they do not establish measured system consumption.
-
100 °C
45 W
115 W
架构、接口、所支持的额外指令 AMD Ryzen 7 7800X3D 和 Intel Core i5-12500H, 虚拟机技术和工艺技术。
Alder Lake H
-
-
x86-64 (64 bit)
SSE4.1, SSE4.2, AVX2, AVX2+
9 MB
18 MB
-
Q1/2022
BGA 1744
10 nm
VT-x, VT-x EPT, VT-d
Shared tests with results for both models: 11
Each row uses one Blender version, operating system and compute backend.
| Test and settings | AMD Ryzen 7 7800X3D | Intel Core i5-12500H | Result difference¹ |
|---|---|---|---|
| Blender 5.1.1 / CPU / Windows | 293.059443 samples/min Submissions: 72 | 104.793666 samples/min Submissions: 10 | -64.2 % |
| Blender 5.1.0 / CPU / Windows | 289.884349 samples/min Submissions: 32 | 149.533488 samples/min Submissions: 6 | -48.4 % |
| Blender 4.5.0 / CPU / Linux | 318.901589 samples/min Submissions: 58 | 170.586795 samples/min Submissions: 6 | -46.5 % |
| Blender 4.5.0 / CPU / Windows | 262.013881 samples/min Submissions: 304 | 137.652303 samples/min Submissions: 65 | -47.5 % |
| Blender 4.4.0 / CPU / Windows | 255.841339 samples/min Submissions: 169 | 142.023008 samples/min Submissions: 27 | -44.5 % |
| Blender 4.3.0 / CPU / Windows | 252.365344 samples/min Submissions: 333 | 143.993174 samples/min Submissions: 23 | -42.9 % |
| Blender 4.2.0 / CPU / Linux | 318.647564 samples/min Submissions: 48 | 172.389039 samples/min Submissions: 5 | -45.9 % |
| Blender 4.2.0 / CPU / Windows | 255.855441 samples/min Submissions: 410 | 149.547825 samples/min Submissions: 54 | -41.5 % |
| Blender 4.1.0 / CPU / Windows | 264.848985 samples/min Submissions: 310 | 140.3944 samples/min Submissions: 20 | -47.0 % |
| Blender 4.0.0 / CPU / Linux | 324.125082 samples/min Submissions: 44 | 140.320401 samples/min Submissions: 12 | -56.7 % |
| Blender 4.0.0 / CPU / Windows | 265.58705 samples/min Submissions: 555 | 139.293078 samples/min Submissions: 65 | -47.6 % |
¹ Difference of the second result relative to the first in that row. No percentage is calculated for different upscaling algorithms. This compares published results, not a universal performance index.
These results have no shared test of both models with the same version and settings. They are shown separately without a percentage difference.
Published measurements are separate from the archived index. Incomplete conditions and unknown run counts do not support ranking positions or calculated performance differences.
| Model | Test | Result | Reported conditions |
|---|---|---|---|
| AMD Ryzen 7 7800X3D | Cinebench R15 / multi-core | 2974 points | Graphics card: GeForce RTX 4090 System RAM: 32 GB |
| AMD Ryzen 7 7800X3D | Cinebench R15 / single-core | 291 points | Graphics card: GeForce RTX 4090 System RAM: 32 GB |
| AMD Ryzen 7 7800X3D | Cinebench R20 / multi-core | 7121 points | Graphics card: GeForce RTX 4090 System RAM: 32 GB |
| AMD Ryzen 7 7800X3D | Cinebench R20 / single-core | 709 points | Graphics card: GeForce RTX 4090 System RAM: 32 GB |
| AMD Ryzen 7 7800X3D | Cinebench R23 / multi-core | 18086 points | Graphics card: GeForce RTX 4090 System RAM: 32 GB |
| AMD Ryzen 7 7800X3D | Cinebench R23 / single-core | 1820 points | Graphics card: GeForce RTX 4090 System RAM: 32 GB |
Results were obtained on the reported systems. Test versions and settings remain separate; incomplete conditions do not support calculated model performance differences.
| Model | Result | Reported conditions |
|---|---|---|
| AMD Ryzen 7 7800X3D | 10164.770937 H/s | RandomX / XMRig 6.26.0 / 1M / 16 threads / windows System RAM: 96 GB OS: Windows NT 10.0 Motherboard: Gigabyte Technology Co., Ltd. / B650I AORUS ULTRA Duration: 98.379 s User-submitted run; tuning and power settings are incomplete. |
| Model | Result | Reported conditions |
|---|---|---|
| Intel Core i5-12500H | 2569.472102 H/s | RandomX / XMRig 6.24.0 / 1M / 13 threads / windows System RAM: 16 GB OS: Windows NT 10.0 Motherboard: ASUSTeK COMPUTER INC. / FX507ZC4 Duration: 389.185 s User-submitted run; tuning and power settings are incomplete. |
根据几项基准测试的结果,你可以更准确地估计出以下两者的性能差异 AMD Ryzen 7 7800X3D 和 Intel Core i5-12500H.
比较合成测试值,选择最好的处理器!
These are saved results from the earlier catalog. Measurement dates and test configurations were not recorded. Models with no comparable results are omitted.
Recent models: test results with identified primary sources — Cinebench R23 · Cinebench R20 · Cinebench R15 · Cinebench 2026 · RandomX benchmark
Higher values are better in this metric.


 English
 Russian
 German
 Portuguese
 Italian
 French
 Japan
 Spanish
 Polish
 Korean