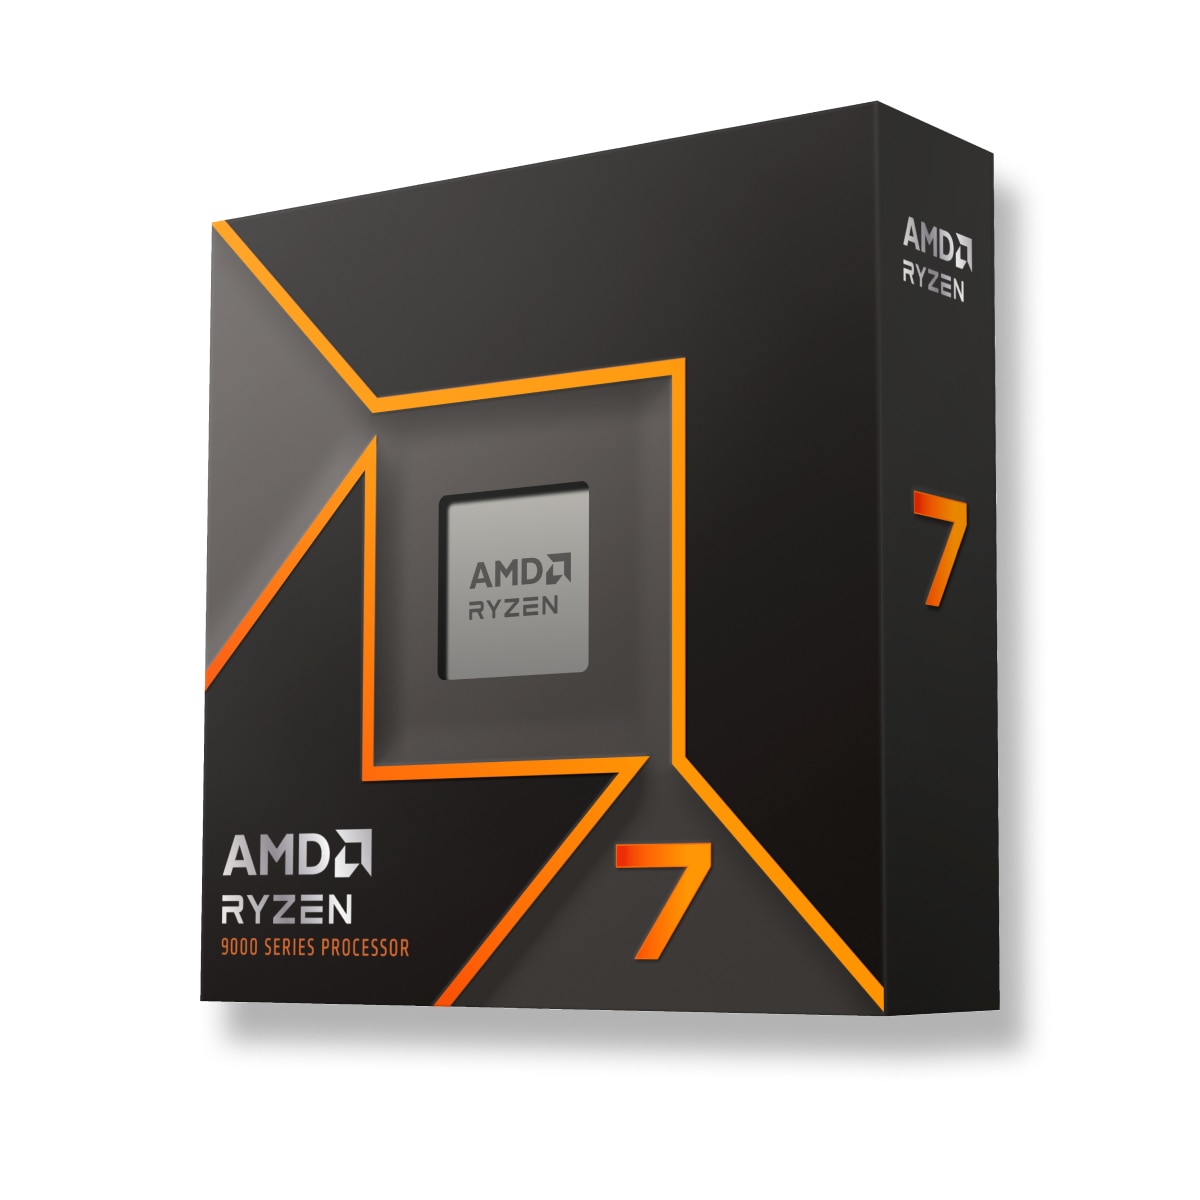


Jaki jest najlepszy wybór AMD Ryzen 9 7900X lub Intel Core i5-12500H? Który procesor jest szybszy?
Przygotowaliśmy porównanie, które pomoże Ci wybrać najlepszy procesor. Porównaj ich specyfikacje i benchmarki.
AMD Ryzen 9 7900X has a base frequency of 4.7 GHz. 12 / 24 CPU Cores / Threads. Stated TDP / base power 170 W. Wydany w 2022-09-27.
Intel Core i5-12500H has a base frequency of 2.50 GHz. 12 / 16 CPU Cores / Threads. Stated TDP / base power 45 W. Wydany w Q1/2022.
Powody do rozważenia Miejsce w rankingu ogólnym
(w oparciu o kilka benchmarków)
 miejsce
Wyższa prędkość zegara
Wokół 88% lepsza prędkość zegara
 2.50 GHz
Wyższa prędkość zegara turbo
Wokół 24% higher specified turbo frequency
4.50 GHz
Wspólne stanowiska AMD Ryzen 9 7900X Procesor w popularnych benchmarkach, dla porównania z innymi modelami.
Powody do rozważenia Lower stated TDP / base power
Power limits alone do not measure performance per watt.
170 W
Wspólne stanowiska Intel Core i5-12500H Procesor w popularnych benchmarkach, dla porównania z innymi modelami.
AMD Ryzen 9 7900X
Informacje ogólne o porównywanych procesorach, serii, generacji i segmencie rynku.
 Intel Core i 12000H
Intel Core i5
-
12
Intel Core i5-11500H
Mobile
-
Core counts, threads, cache and clock modes describe the CPU configuration. Performance depends on the workload and comparable measured results.
2.5 GHz
hybrid (big.LITTLE)
-
12
16
Tak
-
Nie
4.5 GHz
3.2 GHz
4x Golden Cove
8x Gracemont
Internal Graphics nie wpływa na wydajność procesora, wykonuje pracę karty graficznej w przypadku jej braku lub na urządzeniach mobilnych.
12.1
80
13
400 MHz
Intel Iris Xe Graphics 80 (Alder Lake)
1300 MHz
-
4
64 GB
Q1/2022
640
10 nm
Wbudowane kodeki wykorzystywane do kodowania i dekodowania treści. Znacznie przyspiesza wymagane operacje.
Decode
Decode / Encode
Decode / Encode
Decode / Encode
Decode / Encode
Decode
Decode
Decode / Encode
Typy, kanały ilość pamięci RAM obsługiwanych przez Intel Core i5-12500H oraz AMD Ryzen 9 7900X. W zależności od płyt głównych mogą być obsługiwane wyższe lub niższe częstotliwości pamięci.
Nie
64 GB
-
2
DDR4-3200DDR5-4800LPDDR4X-4266LPDDR5-5200
4.0 x 28
Tak
Porównaj wymagania TDP AMD Ryzen 9 7900X oraz Intel Core i5-12500H Power specifications describe different manufacturer limits. TDP, base power and maximum turbo power are separate values; they do not establish measured system consumption.
-
100 °C
45 W
115 W
Architektura, interfejsy, dodatkowe instrukcje obsługiwane przez AMD Ryzen 9 7900X oraz Intel Core i5-12500H, technologie maszyn wirtualnych i technologie procesowe.
Alder Lake H
-
-
-
x86-64 (64 bit)
SSE4.1, SSE4.2, AVX2, AVX2+
9 MB
18 MB
-
-
Q1/2022
-
BGA 1744
10 nm
VT-x, VT-x EPT, VT-d
Shared tests with results for both models: 11
Each row uses one Blender version, operating system and compute backend.
| Test and settings | AMD Ryzen 9 7900X | Intel Core i5-12500H | Result difference¹ |
|---|---|---|---|
| Blender 5.1.1 / CPU / Windows | 402.994833 samples/min Submissions: 143 | 104.793666 samples/min Submissions: 10 | -74.0 % |
| Blender 5.1.0 / CPU / Windows | 465.200088 samples/min Submissions: 18 | 149.533488 samples/min Submissions: 6 | -67.9 % |
| Blender 4.5.0 / CPU / Linux | 481.361918 samples/min Submissions: 34 | 170.586795 samples/min Submissions: 6 | -64.6 % |
| Blender 4.5.0 / CPU / Windows | 406.708812 samples/min Submissions: 127 | 137.652303 samples/min Submissions: 65 | -66.2 % |
| Blender 4.4.0 / CPU / Windows | 390.634852 samples/min Submissions: 206 | 142.023008 samples/min Submissions: 27 | -63.6 % |
| Blender 4.3.0 / CPU / Windows | 391.064336 samples/min Submissions: 145 | 143.993174 samples/min Submissions: 23 | -63.2 % |
| Blender 4.2.0 / CPU / Linux | 493.686905 samples/min Submissions: 23 | 172.389039 samples/min Submissions: 5 | -65.1 % |
| Blender 4.2.0 / CPU / Windows | 396.197227 samples/min Submissions: 309 | 149.547825 samples/min Submissions: 54 | -62.3 % |
| Blender 4.1.0 / CPU / Windows | 400.971593 samples/min Submissions: 148 | 140.3944 samples/min Submissions: 20 | -65.0 % |
| Blender 4.0.0 / CPU / Linux | 504.18409 samples/min Submissions: 22 | 140.320401 samples/min Submissions: 12 | -72.2 % |
| Blender 4.0.0 / CPU / Windows | 412.755161 samples/min Submissions: 318 | 139.293078 samples/min Submissions: 65 | -66.3 % |
¹ Difference of the second result relative to the first in that row. No percentage is calculated for different upscaling algorithms. This compares published results, not a universal performance index.
These results have no shared test of both models with the same version and settings. They are shown separately without a percentage difference.
Published measurements are separate from the archived index. Incomplete conditions and unknown run counts do not support ranking positions or calculated performance differences.
| Model | Test | Result | Reported conditions |
|---|---|---|---|
| AMD Ryzen 9 7900X | Cinebench R15 / multi-core | 4856 points | Graphics card: GeForce RTX 3090 System RAM: 32 GB |
| AMD Ryzen 9 7900X | Cinebench R15 / single-core | 324 points | Graphics card: GeForce RTX 3090 System RAM: 32 GB |
| AMD Ryzen 9 7900X | Cinebench R20 / multi-core | 11563 points | Graphics card: GeForce RTX 3090 System RAM: 32 GB |
| AMD Ryzen 9 7900X | Cinebench R20 / single-core | 786 points | Graphics card: GeForce RTX 3090 System RAM: 32 GB |
| AMD Ryzen 9 7900X | Cinebench R23 / multi-core | 29480 points | Graphics card: GeForce RTX 3090 System RAM: 32 GB |
| AMD Ryzen 9 7900X | Cinebench R23 / single-core | 2039 points | Graphics card: GeForce RTX 3090 System RAM: 32 GB |
Results were obtained on the reported systems. Test versions and settings remain separate; incomplete conditions do not support calculated model performance differences.
| Model | Result | Reported conditions |
|---|---|---|
| AMD Ryzen 9 7900X | 16626.209557 H/s | RandomX / XMRig 6.26.0 / 1M / 24 threads / windows System RAM: 32 GB OS: Windows NT 10.0 Motherboard: ASUSTeK COMPUTER INC. / TUF GAMING B650-PLUS WIFI Duration: 60.146 s User-submitted run; tuning and power settings are incomplete. |
| Model | Result | Reported conditions |
|---|---|---|
| Intel Core i5-12500H | 2569.472102 H/s | RandomX / XMRig 6.24.0 / 1M / 13 threads / windows System RAM: 16 GB OS: Windows NT 10.0 Motherboard: ASUSTeK COMPUTER INC. / FX507ZC4 Duration: 389.185 s User-submitted run; tuning and power settings are incomplete. |
Na podstawie wyników kilku benchmarków można dokładniej oszacować różnicę w wydajności między AMD Ryzen 9 7900X oraz Intel Core i5-12500H.
Porównaj wartości testów syntetycznych i wybierz najlepszy procesor!
These are saved results from the earlier catalog. Measurement dates and test configurations were not recorded. Models with no comparable results are omitted.
Recent models: test results with identified primary sources — Cinebench R23 · Cinebench R20 · Cinebench R15 · Cinebench 2026 · RandomX benchmark
Higher values are better in this metric.


 English
 Russian
 German
 Portuguese
 Italian
 French
 Japan
 Spanish
 Chinese
 Korean