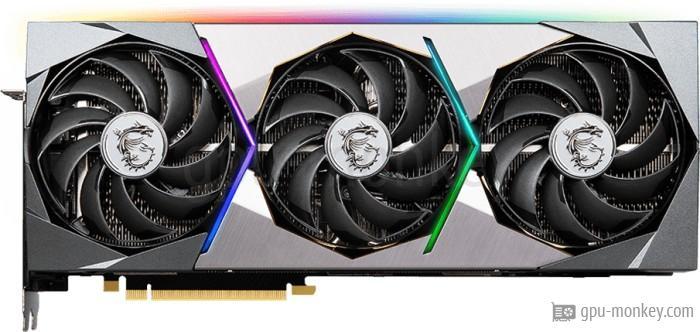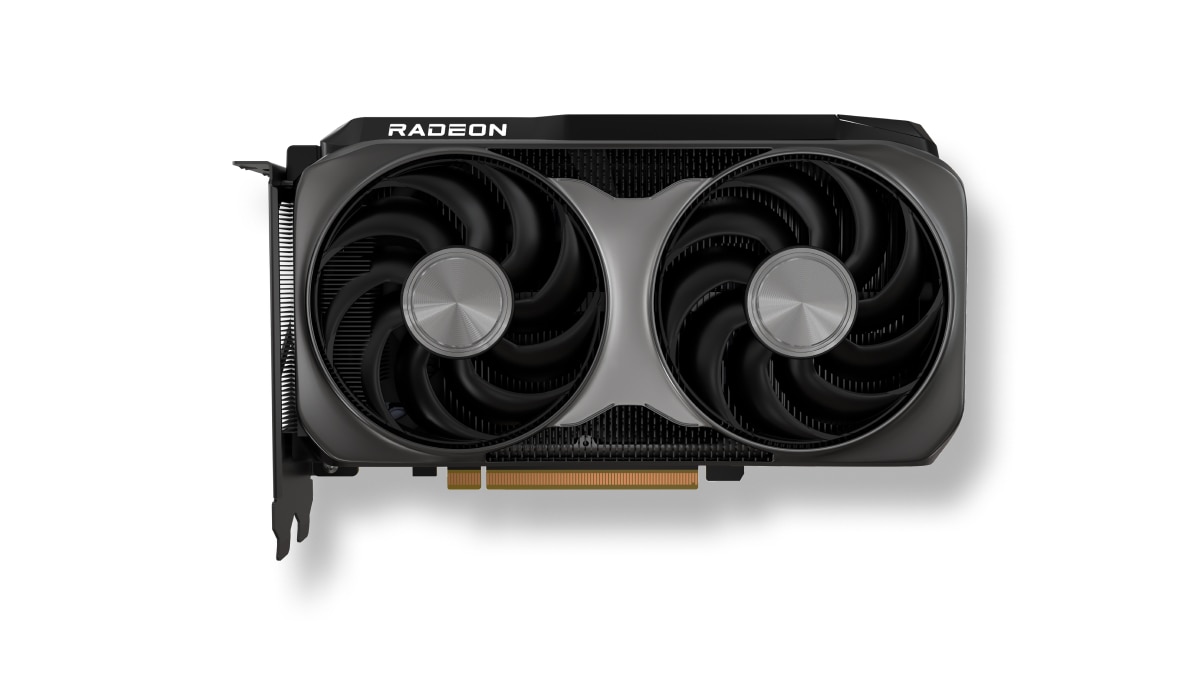
Posizioni comuni MSI Radeon RX 6950 XT GAMING X TRIO 16G GPU in benchmark popolari, per un confronto con altri modelli.
Board specifications and benchmark results are specific to each version.
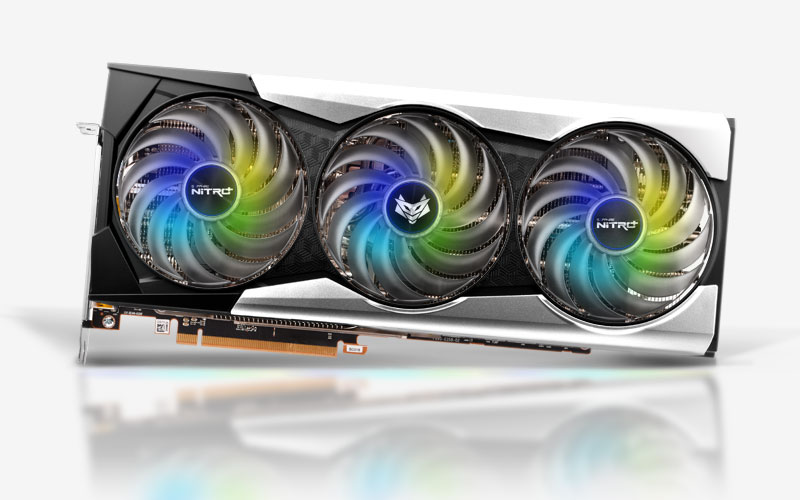 SAPPHIRE NITRO+ Radeon RX 6950 XT 16GB
Sapphire · 16 GB
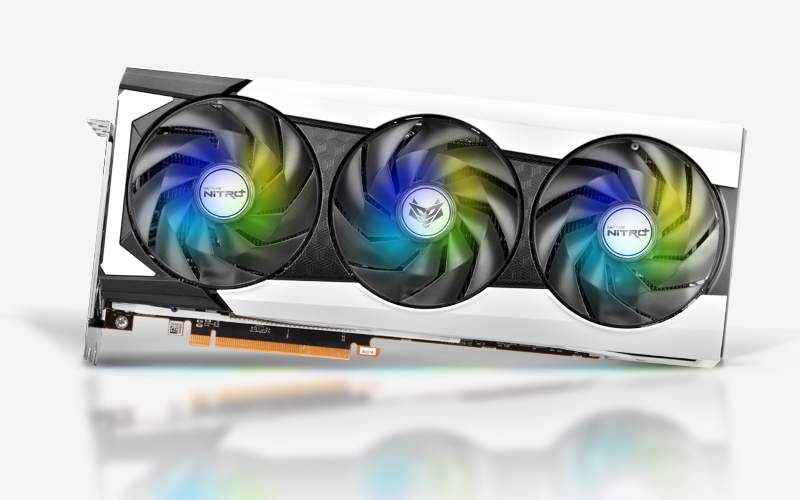 SAPPHIRE NITRO+ Radeon RX 6950 XT PURE 16GB
Sapphire · 16 GB
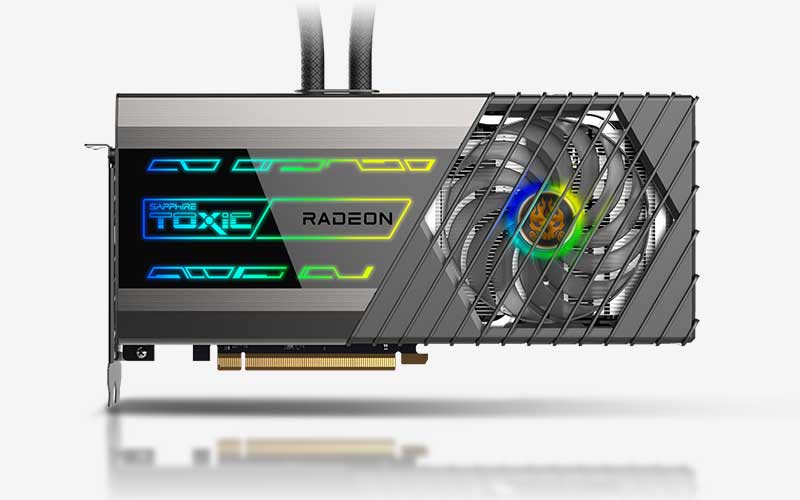 SAPPHIRE TOXIC Radeon RX 6950 XT Limited Edition 16GB
Sapphire · 16 GB
Published results: 95
Each row uses one game, resolution, test suite and graphics mode.
| Test and settings | MSI Radeon RX 6950 XT GAMING X TRIO 16G |
|---|---|
| Gaming suite 2023 / A Plague Tale: Requiem / 1920x1080 / Ultra / Ultra Quality / RT off | 131.2 FPS Base GPU test: AMD Radeon RX 6950 XT Settings: Ultra-Preset, Auflösungsoptimierung „Ultra-Quality“VRAM: 16 GBTest CPU: AMD Ryzen 9 7950X3DSystem RAM: 32 GB DDR5-6000 30-38-38-96OS: Windows 11 22H2Driver: 23.4.1Resizable BAR: enabledHVCI: enabled |
| Gaming suite 2023 / Atomic Heart / 1920x1080 / Atomic / Rendering unreported / RT off | 109.9 FPS Base GPU test: AMD Radeon RX 6950 XT Settings: Atomic-PresetVRAM: 16 GBTest CPU: AMD Ryzen 9 7950X3DSystem RAM: 32 GB DDR5-6000 30-38-38-96OS: Windows 11 22H2Driver: 23.4.1Resizable BAR: enabledHVCI: enabled |
| Gaming suite 2023 / Call of Duty: Modern Warfare 2 / 1920x1080 / Ultra / Rendering unreported / RT off | 163.2 FPS Base GPU test: AMD Radeon RX 6950 XT Settings: Ultra-Preset, Tessellation „Alle“, Shadow-Maps „Extra“, Wetter „Ultra“VRAM: 16 GBTest CPU: AMD Ryzen 9 7950X3DSystem RAM: 32 GB DDR5-6000 30-38-38-96OS: Windows 11 22H2Driver: 23.4.1Resizable BAR: enabledHVCI: enabled |
| Gaming suite 2023 / Company of Heroes 3 / 1920x1080 / Maximum / Rendering unreported / RT off | 150.7 FPS Base GPU test: AMD Radeon RX 6950 XT Settings: Maximale GrafikdetailsVRAM: 16 GBTest CPU: AMD Ryzen 9 7950X3DSystem RAM: 32 GB DDR5-6000 30-38-38-96OS: Windows 11 22H2Driver: 23.4.1Resizable BAR: enabledHVCI: enabled |
| Gaming suite 2023 / Cyberpunk 2077 / 1920x1080 / Ultra / Rendering unreported / RT off | 115.1 FPS Base GPU test: AMD Radeon RX 6950 XT Settings: Ultra-PresetVRAM: 16 GBTest CPU: AMD Ryzen 9 7950X3DSystem RAM: 32 GB DDR5-6000 30-38-38-96OS: Windows 11 22H2Driver: 23.4.1Resizable BAR: enabledHVCI: enabled |
| Gaming suite 2023 / Cyberpunk 2077 / 1920x1080 / Ultra / Rendering unreported / RT on | 43.2 FPS Base GPU test: AMD Radeon RX 6950 XT Settings: Ultra-Preset; RT: GI „Mittel“, Schatten „Ein“VRAM: 16 GBTest CPU: AMD Ryzen 9 7950X3DSystem RAM: 32 GB DDR5-6000 30-38-38-96OS: Windows 11 22H2Driver: 23.4.1Resizable BAR: enabledHVCI: enabled |
| Gaming suite 2023 / Dead Space / 1920x1080 / Ultra / Rendering unreported / RT off | 130.4 FPS Base GPU test: AMD Radeon RX 6950 XT Settings: Ultra-PresetVRAM: 16 GBTest CPU: AMD Ryzen 9 7950X3DSystem RAM: 32 GB DDR5-6000 30-38-38-96OS: Windows 11 22H2Driver: 23.4.1Resizable BAR: enabledHVCI: enabled |
| Gaming suite 2023 / Dead Space / 1920x1080 / Ultra / Rendering unreported / RT on | 113.1 FPS Base GPU test: AMD Radeon RX 6950 XT Settings: Ultra-Preset; RT: AO „Ein“VRAM: 16 GBTest CPU: AMD Ryzen 9 7950X3DSystem RAM: 32 GB DDR5-6000 30-38-38-96OS: Windows 11 22H2Driver: 23.4.1Resizable BAR: enabledHVCI: enabled |
| Gaming suite 2023 / Dying Light 2 / 1920x1080 / High / Rendering unreported / RT off | 147.6 FPS Base GPU test: AMD Radeon RX 6950 XT Settings: Hohe-Qualität-PresetVRAM: 16 GBTest CPU: AMD Ryzen 9 7950X3DSystem RAM: 32 GB DDR5-6000 30-38-38-96OS: Windows 11 22H2Driver: 23.4.1Resizable BAR: enabledHVCI: enabled |
| Gaming suite 2023 / Dying Light 2 / 1920x1080 / High / Rendering unreported / RT on | 87.9 FPS Base GPU test: AMD Radeon RX 6950 XT Settings: Hohe-Qualität-Preset; RT: GI + AO „Ein“VRAM: 16 GBTest CPU: AMD Ryzen 9 7950X3DSystem RAM: 32 GB DDR5-6000 30-38-38-96OS: Windows 11 22H2Driver: 23.4.1Resizable BAR: enabledHVCI: enabled |
| Gaming suite 2023 / F1 22 / 1920x1080 / Ultra high / Rendering unreported / RT off | 296.8 FPS Base GPU test: AMD Radeon RX 6950 XT Settings: Ultrahoch-PresetVRAM: 16 GBTest CPU: AMD Ryzen 9 7950X3DSystem RAM: 32 GB DDR5-6000 30-38-38-96OS: Windows 11 22H2Driver: 23.4.1Resizable BAR: enabledHVCI: enabled |
| Gaming suite 2023 / F1 22 / 1920x1080 / Ultra high / Rendering unreported / RT on | 157.6 FPS Base GPU test: AMD Radeon RX 6950 XT Settings: Ultrahoch-Preset; RT: Reflexionen (Voll) + Schatten + AO „Mittel“VRAM: 16 GBTest CPU: AMD Ryzen 9 7950X3DSystem RAM: 32 GB DDR5-6000 30-38-38-96OS: Windows 11 22H2Driver: 23.4.1Resizable BAR: enabledHVCI: enabled |
| Test and settings | MSI Radeon RX 6950 XT GAMING X TRIO 16G |
|---|---|
| Gaming suite 2023 / Forspoken / 1920x1080 / Ultra / Rendering unreported / RT off | 76.1 FPS Base GPU test: AMD Radeon RX 6950 XT Settings: Ultra-Preset, AO FidelityFXVRAM: 16 GBTest CPU: AMD Ryzen 9 7950X3DSystem RAM: 32 GB DDR5-6000 30-38-38-96OS: Windows 11 22H2Driver: 23.4.1Resizable BAR: enabledHVCI: enabled |
| Gaming suite 2023 / Forspoken / 1920x1080 / Ultra / Rendering unreported / RT on | 58.9 FPS Base GPU test: AMD Radeon RX 6950 XT Settings: Ultra-Preset, AO FidelityFX; RT: Schatten + AO „Ein“VRAM: 16 GBTest CPU: AMD Ryzen 9 7950X3DSystem RAM: 32 GB DDR5-6000 30-38-38-96OS: Windows 11 22H2Driver: 23.4.1Resizable BAR: enabledHVCI: enabled |
| Gaming suite 2023 / Hogwarts Legacy / 1920x1080 / Ultra / Rendering unreported / RT off | 91.4 FPS Base GPU test: AMD Radeon RX 6950 XT Settings: Ultra-PresetVRAM: 16 GBTest CPU: AMD Ryzen 9 7950X3DSystem RAM: 32 GB DDR5-6000 30-38-38-96OS: Windows 11 22H2Driver: 23.4.1Resizable BAR: enabledHVCI: enabled |
| Gaming suite 2023 / Hogwarts Legacy / 1920x1080 / Ultra / Rendering unreported / RT on | 76.2 FPS Base GPU test: AMD Radeon RX 6950 XT Settings: Ultra-Preset; RT: Reflexionen „Ultra“VRAM: 16 GBTest CPU: AMD Ryzen 9 7950X3DSystem RAM: 32 GB DDR5-6000 30-38-38-96OS: Windows 11 22H2Driver: 23.4.1Resizable BAR: enabledHVCI: enabled |
| Gaming suite 2023 / Metro Exodus PC Enhanced Edition / 1920x1080 / Extreme / Rendering unreported / RT on | 82.7 FPS Base GPU test: AMD Radeon RX 6950 XT Settings: Extrem-Qualität, kein HW, kein PhysX; RT: „Hoch“ + ReflexionenVRAM: 16 GBTest CPU: AMD Ryzen 9 7950X3DSystem RAM: 32 GB DDR5-6000 30-38-38-96OS: Windows 11 22H2Driver: 23.4.1Resizable BAR: enabledHVCI: enabled |
| Gaming suite 2023 / Resident Evil 4 / 1920x1080 / Maximum / Rendering unreported / RT off | 167.1 FPS Base GPU test: AMD Radeon RX 6950 XT Settings: Maximum-PresetVRAM: 16 GBTest CPU: AMD Ryzen 9 7950X3DSystem RAM: 32 GB DDR5-6000 30-38-38-96OS: Windows 11 22H2Driver: 23.4.1Resizable BAR: enabledHVCI: enabled |
| Gaming suite 2023 / Resident Evil 4 / 1920x1080 / Maximum / Rendering unreported / RT on | 125 FPS Base GPU test: AMD Radeon RX 6950 XT Settings: Maximum-Preset; RT: Reflexionen „Hoch“VRAM: 16 GBTest CPU: AMD Ryzen 9 7950X3DSystem RAM: 32 GB DDR5-6000 30-38-38-96OS: Windows 11 22H2Driver: 23.4.1Resizable BAR: enabledHVCI: enabled |
| Gaming suite 2023 / Returnal / 1920x1080 / Epic / Rendering unreported / RT off | 156.9 FPS Base GPU test: AMD Radeon RX 6950 XT Settings: Episch-PresetVRAM: 16 GBTest CPU: AMD Ryzen 9 7950X3DSystem RAM: 32 GB DDR5-6000 30-38-38-96OS: Windows 11 22H2Driver: 23.4.1Resizable BAR: enabledHVCI: enabled |
| Gaming suite 2023 / Returnal / 1920x1080 / Epic / Rendering unreported / RT on | 112 FPS Base GPU test: AMD Radeon RX 6950 XT Settings: Episch-Preset; RT: Reflexionen „Episch“, Schatten „Mittel“VRAM: 16 GBTest CPU: AMD Ryzen 9 7950X3DSystem RAM: 32 GB DDR5-6000 30-38-38-96OS: Windows 11 22H2Driver: 23.4.1Resizable BAR: enabledHVCI: enabled |
| Gaming suite 2023 / Spider-Man: Miles Morales / 1920x1080 / Very high / Rendering unreported / RT off | 106.4 FPS Base GPU test: AMD Radeon RX 6950 XT Settings: Sehr-hoch-Preset, 16-faches AF, Schatten „Sehr hoch“, Detailstufe „Sehr hoch“VRAM: 16 GBTest CPU: AMD Ryzen 9 7950X3DSystem RAM: 32 GB DDR5-6000 30-38-38-96OS: Windows 11 22H2Driver: 23.4.1Resizable BAR: enabledHVCI: enabled |
| Gaming suite 2023 / Spider-Man: Miles Morales / 1920x1080 / Very high / Rendering unreported / RT on | 80.4 FPS Base GPU test: AMD Radeon RX 6950 XT Settings: Sehr-hoch-Preset, 16-faches AF, Schatten „Sehr hoch“, Detailstufe „Sehr hoch“; RT: Reflexionen Auflösung „Hoch“, Geometrie „Sehr hoch“, Sichtweite 10, Schatten „Mittel“VRAM: 16 GBTest CPU: AMD Ryzen 9 7950X3DSystem RAM: 32 GB DDR5-6000 30-38-38-96OS: Windows 11 22H2Driver: 23.4.1Resizable BAR: enabledHVCI: enabled |
| Gaming suite 2023 / The Callisto Protocol / 1920x1080 / Ultra / Rendering unreported / RT off | 176.6 FPS Base GPU test: AMD Radeon RX 6950 XT Settings: Ultra-PresetVRAM: 16 GBTest CPU: AMD Ryzen 9 7950X3DSystem RAM: 32 GB DDR5-6000 30-38-38-96OS: Windows 11 22H2Driver: 23.4.1Resizable BAR: enabledHVCI: enabled |
| Gaming suite 2023 / The Callisto Protocol / 1920x1080 / Ultra / Rendering unreported / RT on | 95.6 FPS Base GPU test: AMD Radeon RX 6950 XT Settings: Ultra-Preset; RT: Reflexionen „Mittel“, Schatten „Ein“, Übertragung „Ein“VRAM: 16 GBTest CPU: AMD Ryzen 9 7950X3DSystem RAM: 32 GB DDR5-6000 30-38-38-96OS: Windows 11 22H2Driver: 23.4.1Resizable BAR: enabledHVCI: enabled |
| Gaming suite 2023 / The Last of Us Part I / 1920x1080 / Ultra / Rendering unreported / RT off | 90.7 FPS Base GPU test: AMD Radeon RX 6950 XT Settings: Ultra-PresetVRAM: 16 GBTest CPU: AMD Ryzen 9 7950X3DSystem RAM: 32 GB DDR5-6000 30-38-38-96OS: Windows 11 22H2Driver: 23.4.1Resizable BAR: enabledHVCI: enabled |
| Gaming suite 2023 / The Witcher 3 / 1920x1080 / Highest / Rendering unreported / RT off | 130.1 FPS Base GPU test: AMD Radeon RX 6950 XT Settings: Höchste-Preset, Höchste+-Details, kein HWVRAM: 16 GBTest CPU: AMD Ryzen 9 7950X3DSystem RAM: 32 GB DDR5-6000 30-38-38-96OS: Windows 11 22H2Driver: 23.4.1Resizable BAR: enabledHVCI: enabled |
| Gaming suite 2023 / The Witcher 3 / 1920x1080 / Highest / Rendering unreported / RT on | 67.1 FPS Base GPU test: AMD Radeon RX 6950 XT Settings: Höchste-Preset, Höchste+-Details, kein HW; RT: GI „Performance“, Reflexionen „Ein“VRAM: 16 GBTest CPU: AMD Ryzen 9 7950X3DSystem RAM: 32 GB DDR5-6000 30-38-38-96OS: Windows 11 22H2Driver: 23.4.1Resizable BAR: enabledHVCI: enabled |
| Gaming suite 2023 / Uncharted / 1920x1080 / Ultra / Rendering unreported / RT off | 117.8 FPS Base GPU test: AMD Radeon RX 6950 XT Settings: Ultra-PresetVRAM: 16 GBTest CPU: AMD Ryzen 9 7950X3DSystem RAM: 32 GB DDR5-6000 30-38-38-96OS: Windows 11 22H2Driver: 23.4.1Resizable BAR: enabledHVCI: enabled |
| Gaming suite 2023 / A Plague Tale: Requiem / 2560x1440 / Ultra / Ultra Quality / RT off | 88.4 FPS Base GPU test: AMD Radeon RX 6950 XT Settings: Ultra-Preset, Auflösungsoptimierung „Ultra-Quality“VRAM: 16 GBTest CPU: AMD Ryzen 9 7950X3DSystem RAM: 32 GB DDR5-6000 30-38-38-96OS: Windows 11 22H2Driver: 23.4.1Resizable BAR: enabledHVCI: enabled |
| Gaming suite 2023 / Atomic Heart / 2560x1440 / Atomic / Rendering unreported / RT off | 87.6 FPS Base GPU test: AMD Radeon RX 6950 XT Settings: Atomic-PresetVRAM: 16 GBTest CPU: AMD Ryzen 9 7950X3DSystem RAM: 32 GB DDR5-6000 30-38-38-96OS: Windows 11 22H2Driver: 23.4.1Resizable BAR: enabledHVCI: enabled |
| Gaming suite 2023 / Call of Duty: Modern Warfare 2 / 2560x1440 / Ultra / Rendering unreported / RT off | 112.6 FPS Base GPU test: AMD Radeon RX 6950 XT Settings: Ultra-Preset, Tessellation „Alle“, Shadow-Maps „Extra“, Wetter „Ultra“VRAM: 16 GBTest CPU: AMD Ryzen 9 7950X3DSystem RAM: 32 GB DDR5-6000 30-38-38-96OS: Windows 11 22H2Driver: 23.4.1Resizable BAR: enabledHVCI: enabled |
| Gaming suite 2023 / Company of Heroes 3 / 2560x1440 / Maximum / Rendering unreported / RT off | 116.6 FPS Base GPU test: AMD Radeon RX 6950 XT Settings: Maximale GrafikdetailsVRAM: 16 GBTest CPU: AMD Ryzen 9 7950X3DSystem RAM: 32 GB DDR5-6000 30-38-38-96OS: Windows 11 22H2Driver: 23.4.1Resizable BAR: enabledHVCI: enabled |
| Gaming suite 2023 / Cyberpunk 2077 / 2560x1440 / Ultra / Rendering unreported / RT off | 75.2 FPS Base GPU test: AMD Radeon RX 6950 XT Settings: Ultra-PresetVRAM: 16 GBTest CPU: AMD Ryzen 9 7950X3DSystem RAM: 32 GB DDR5-6000 30-38-38-96OS: Windows 11 22H2Driver: 23.4.1Resizable BAR: enabledHVCI: enabled |
| Gaming suite 2023 / Cyberpunk 2077 / 2560x1440 / Ultra / Rendering unreported / RT on | 29 FPS Base GPU test: AMD Radeon RX 6950 XT Settings: Ultra-Preset; RT: GI „Mittel“, Schatten „Ein“VRAM: 16 GBTest CPU: AMD Ryzen 9 7950X3DSystem RAM: 32 GB DDR5-6000 30-38-38-96OS: Windows 11 22H2Driver: 23.4.1Resizable BAR: enabledHVCI: enabled |
| Gaming suite 2023 / Dead Space / 2560x1440 / Ultra / Rendering unreported / RT off | 93.1 FPS Base GPU test: AMD Radeon RX 6950 XT Settings: Ultra-PresetVRAM: 16 GBTest CPU: AMD Ryzen 9 7950X3DSystem RAM: 32 GB DDR5-6000 30-38-38-96OS: Windows 11 22H2Driver: 23.4.1Resizable BAR: enabledHVCI: enabled |
| Gaming suite 2023 / Dead Space / 2560x1440 / Ultra / Rendering unreported / RT on | 82.5 FPS Base GPU test: AMD Radeon RX 6950 XT Settings: Ultra-Preset; RT: AO „Ein“VRAM: 16 GBTest CPU: AMD Ryzen 9 7950X3DSystem RAM: 32 GB DDR5-6000 30-38-38-96OS: Windows 11 22H2Driver: 23.4.1Resizable BAR: enabledHVCI: enabled |
| Gaming suite 2023 / Dying Light 2 / 2560x1440 / High / Rendering unreported / RT off | 107 FPS Base GPU test: AMD Radeon RX 6950 XT Settings: Hohe-Qualität-PresetVRAM: 16 GBTest CPU: AMD Ryzen 9 7950X3DSystem RAM: 32 GB DDR5-6000 30-38-38-96OS: Windows 11 22H2Driver: 23.4.1Resizable BAR: enabledHVCI: enabled |
| Gaming suite 2023 / Dying Light 2 / 2560x1440 / High / Rendering unreported / RT on | 56.4 FPS Base GPU test: AMD Radeon RX 6950 XT Settings: Hohe-Qualität-Preset; RT: GI + AO „Ein“VRAM: 16 GBTest CPU: AMD Ryzen 9 7950X3DSystem RAM: 32 GB DDR5-6000 30-38-38-96OS: Windows 11 22H2Driver: 23.4.1Resizable BAR: enabledHVCI: enabled |
| Gaming suite 2023 / F1 22 / 2560x1440 / Ultra high / Rendering unreported / RT off | 223.2 FPS Base GPU test: AMD Radeon RX 6950 XT Settings: Ultrahoch-PresetVRAM: 16 GBTest CPU: AMD Ryzen 9 7950X3DSystem RAM: 32 GB DDR5-6000 30-38-38-96OS: Windows 11 22H2Driver: 23.4.1Resizable BAR: enabledHVCI: enabled |
| Gaming suite 2023 / F1 22 / 2560x1440 / Ultra high / Rendering unreported / RT on | 114.7 FPS Base GPU test: AMD Radeon RX 6950 XT Settings: Ultrahoch-Preset; RT: Reflexionen (Voll) + Schatten + AO „Mittel“VRAM: 16 GBTest CPU: AMD Ryzen 9 7950X3DSystem RAM: 32 GB DDR5-6000 30-38-38-96OS: Windows 11 22H2Driver: 23.4.1Resizable BAR: enabledHVCI: enabled |
| Gaming suite 2023 / Forspoken / 2560x1440 / Ultra / Rendering unreported / RT off | 58.1 FPS Base GPU test: AMD Radeon RX 6950 XT Settings: Ultra-Preset, AO FidelityFXVRAM: 16 GBTest CPU: AMD Ryzen 9 7950X3DSystem RAM: 32 GB DDR5-6000 30-38-38-96OS: Windows 11 22H2Driver: 23.4.1Resizable BAR: enabledHVCI: enabled |
| Gaming suite 2023 / Forspoken / 2560x1440 / Ultra / Rendering unreported / RT on | 43.7 FPS Base GPU test: AMD Radeon RX 6950 XT Settings: Ultra-Preset, AO FidelityFX; RT: Schatten + AO „Ein“VRAM: 16 GBTest CPU: AMD Ryzen 9 7950X3DSystem RAM: 32 GB DDR5-6000 30-38-38-96OS: Windows 11 22H2Driver: 23.4.1Resizable BAR: enabledHVCI: enabled |
| Gaming suite 2023 / Hogwarts Legacy / 2560x1440 / Ultra / Rendering unreported / RT off | 73.3 FPS Base GPU test: AMD Radeon RX 6950 XT Settings: Ultra-PresetVRAM: 16 GBTest CPU: AMD Ryzen 9 7950X3DSystem RAM: 32 GB DDR5-6000 30-38-38-96OS: Windows 11 22H2Driver: 23.4.1Resizable BAR: enabledHVCI: enabled |
| Gaming suite 2023 / Hogwarts Legacy / 2560x1440 / Ultra / Rendering unreported / RT on | 63 FPS Base GPU test: AMD Radeon RX 6950 XT Settings: Ultra-Preset; RT: Reflexionen „Ultra“VRAM: 16 GBTest CPU: AMD Ryzen 9 7950X3DSystem RAM: 32 GB DDR5-6000 30-38-38-96OS: Windows 11 22H2Driver: 23.4.1Resizable BAR: enabledHVCI: enabled |
| Gaming suite 2023 / Metro Exodus PC Enhanced Edition / 2560x1440 / Extreme / Rendering unreported / RT on | 63.7 FPS Base GPU test: AMD Radeon RX 6950 XT Settings: Extrem-Qualität, kein HW, kein PhysX; RT: „Hoch“ + ReflexionenVRAM: 16 GBTest CPU: AMD Ryzen 9 7950X3DSystem RAM: 32 GB DDR5-6000 30-38-38-96OS: Windows 11 22H2Driver: 23.4.1Resizable BAR: enabledHVCI: enabled |
| Gaming suite 2023 / Resident Evil 4 / 2560x1440 / Maximum / Rendering unreported / RT off | 126.8 FPS Base GPU test: AMD Radeon RX 6950 XT Settings: Maximum-PresetVRAM: 16 GBTest CPU: AMD Ryzen 9 7950X3DSystem RAM: 32 GB DDR5-6000 30-38-38-96OS: Windows 11 22H2Driver: 23.4.1Resizable BAR: enabledHVCI: enabled |
| Gaming suite 2023 / Resident Evil 4 / 2560x1440 / Maximum / Rendering unreported / RT on | 101.2 FPS Base GPU test: AMD Radeon RX 6950 XT Settings: Maximum-Preset; RT: Reflexionen „Hoch“VRAM: 16 GBTest CPU: AMD Ryzen 9 7950X3DSystem RAM: 32 GB DDR5-6000 30-38-38-96OS: Windows 11 22H2Driver: 23.4.1Resizable BAR: enabledHVCI: enabled |
| Gaming suite 2023 / Returnal / 2560x1440 / Epic / Rendering unreported / RT off | 113.9 FPS Base GPU test: AMD Radeon RX 6950 XT Settings: Episch-PresetVRAM: 16 GBTest CPU: AMD Ryzen 9 7950X3DSystem RAM: 32 GB DDR5-6000 30-38-38-96OS: Windows 11 22H2Driver: 23.4.1Resizable BAR: enabledHVCI: enabled |
| Gaming suite 2023 / Returnal / 2560x1440 / Epic / Rendering unreported / RT on | 80.5 FPS Base GPU test: AMD Radeon RX 6950 XT Settings: Episch-Preset; RT: Reflexionen „Episch“, Schatten „Mittel“VRAM: 16 GBTest CPU: AMD Ryzen 9 7950X3DSystem RAM: 32 GB DDR5-6000 30-38-38-96OS: Windows 11 22H2Driver: 23.4.1Resizable BAR: enabledHVCI: enabled |
| Gaming suite 2023 / Spider-Man: Miles Morales / 2560x1440 / Very high / Rendering unreported / RT off | 87.5 FPS Base GPU test: AMD Radeon RX 6950 XT Settings: Sehr-hoch-Preset, 16-faches AF, Schatten „Sehr hoch“, Detailstufe „Sehr hoch“VRAM: 16 GBTest CPU: AMD Ryzen 9 7950X3DSystem RAM: 32 GB DDR5-6000 30-38-38-96OS: Windows 11 22H2Driver: 23.4.1Resizable BAR: enabledHVCI: enabled |
| Gaming suite 2023 / Spider-Man: Miles Morales / 2560x1440 / Very high / Rendering unreported / RT on | 66.1 FPS Base GPU test: AMD Radeon RX 6950 XT Settings: Sehr-hoch-Preset, 16-faches AF, Schatten „Sehr hoch“, Detailstufe „Sehr hoch“; RT: Reflexionen Auflösung „Hoch“, Geometrie „Sehr hoch“, Sichtweite 10, Schatten „Mittel“VRAM: 16 GBTest CPU: AMD Ryzen 9 7950X3DSystem RAM: 32 GB DDR5-6000 30-38-38-96OS: Windows 11 22H2Driver: 23.4.1Resizable BAR: enabledHVCI: enabled |
| Gaming suite 2023 / The Callisto Protocol / 2560x1440 / Ultra / Rendering unreported / RT off | 139.3 FPS Base GPU test: AMD Radeon RX 6950 XT Settings: Ultra-PresetVRAM: 16 GBTest CPU: AMD Ryzen 9 7950X3DSystem RAM: 32 GB DDR5-6000 30-38-38-96OS: Windows 11 22H2Driver: 23.4.1Resizable BAR: enabledHVCI: enabled |
| Gaming suite 2023 / The Callisto Protocol / 2560x1440 / Ultra / Rendering unreported / RT on | 84.6 FPS Base GPU test: AMD Radeon RX 6950 XT Settings: Ultra-Preset; RT: Reflexionen „Mittel“, Schatten „Ein“, Übertragung „Ein“VRAM: 16 GBTest CPU: AMD Ryzen 9 7950X3DSystem RAM: 32 GB DDR5-6000 30-38-38-96OS: Windows 11 22H2Driver: 23.4.1Resizable BAR: enabledHVCI: enabled |
| Gaming suite 2023 / The Last of Us Part I / 2560x1440 / Ultra / Rendering unreported / RT off | 68.3 FPS Base GPU test: AMD Radeon RX 6950 XT Settings: Ultra-PresetVRAM: 16 GBTest CPU: AMD Ryzen 9 7950X3DSystem RAM: 32 GB DDR5-6000 30-38-38-96OS: Windows 11 22H2Driver: 23.4.1Resizable BAR: enabledHVCI: enabled |
| Gaming suite 2023 / The Witcher 3 / 2560x1440 / Highest / Rendering unreported / RT off | 83.4 FPS Base GPU test: AMD Radeon RX 6950 XT Settings: Höchste-Preset, Höchste+-Details, kein HWVRAM: 16 GBTest CPU: AMD Ryzen 9 7950X3DSystem RAM: 32 GB DDR5-6000 30-38-38-96OS: Windows 11 22H2Driver: 23.4.1Resizable BAR: enabledHVCI: enabled |
| Gaming suite 2023 / The Witcher 3 / 2560x1440 / Highest / Rendering unreported / RT on | 47.6 FPS Base GPU test: AMD Radeon RX 6950 XT Settings: Höchste-Preset, Höchste+-Details, kein HW; RT: GI „Performance“, Reflexionen „Ein“VRAM: 16 GBTest CPU: AMD Ryzen 9 7950X3DSystem RAM: 32 GB DDR5-6000 30-38-38-96OS: Windows 11 22H2Driver: 23.4.1Resizable BAR: enabledHVCI: enabled |
| Gaming suite 2023 / Uncharted / 2560x1440 / Ultra / Rendering unreported / RT off | 101.1 FPS Base GPU test: AMD Radeon RX 6950 XT Settings: Ultra-PresetVRAM: 16 GBTest CPU: AMD Ryzen 9 7950X3DSystem RAM: 32 GB DDR5-6000 30-38-38-96OS: Windows 11 22H2Driver: 23.4.1Resizable BAR: enabledHVCI: enabled |
| Gaming suite 2023 / A Plague Tale: Requiem / 3840x2160 / Ultra / Ultra Quality / RT off | 45.1 FPS Base GPU test: AMD Radeon RX 6950 XT Settings: Ultra-Preset, Auflösungsoptimierung „Ultra-Quality“VRAM: 16 GBTest CPU: AMD Ryzen 9 7950X3DSystem RAM: 32 GB DDR5-6000 30-38-38-96OS: Windows 11 22H2Driver: 23.4.1Resizable BAR: enabledHVCI: enabled |
| Gaming suite 2023 / Atomic Heart / 3840x2160 / Atomic / Rendering unreported / RT off | 60 FPS Base GPU test: AMD Radeon RX 6950 XT Settings: Atomic-PresetVRAM: 16 GBTest CPU: AMD Ryzen 9 7950X3DSystem RAM: 32 GB DDR5-6000 30-38-38-96OS: Windows 11 22H2Driver: 23.4.1Resizable BAR: enabledHVCI: enabled |
| Gaming suite 2023 / Call of Duty: Modern Warfare 2 / 3840x2160 / Ultra / Rendering unreported / RT off | 62.7 FPS Base GPU test: AMD Radeon RX 6950 XT Settings: Ultra-Preset, Tessellation „Alle“, Shadow-Maps „Extra“, Wetter „Ultra“VRAM: 16 GBTest CPU: AMD Ryzen 9 7950X3DSystem RAM: 32 GB DDR5-6000 30-38-38-96OS: Windows 11 22H2Driver: 23.4.1Resizable BAR: enabledHVCI: enabled |
| Gaming suite 2023 / Company of Heroes 3 / 3840x2160 / Maximum / Rendering unreported / RT off | 71.9 FPS Base GPU test: AMD Radeon RX 6950 XT Settings: Maximale GrafikdetailsVRAM: 16 GBTest CPU: AMD Ryzen 9 7950X3DSystem RAM: 32 GB DDR5-6000 30-38-38-96OS: Windows 11 22H2Driver: 23.4.1Resizable BAR: enabledHVCI: enabled |
| Gaming suite 2023 / Cyberpunk 2077 / 3840x2160 / Medium / Rendering unreported / RT off | 51.9 FPS Base GPU test: AMD Radeon RX 6950 XT Settings: Mittel-PresetVRAM: 16 GBTest CPU: AMD Ryzen 9 7950X3DSystem RAM: 32 GB DDR5-6000 30-38-38-96OS: Windows 11 22H2Driver: 23.4.1Resizable BAR: enabledHVCI: enabled |
| Gaming suite 2023 / Cyberpunk 2077 / 3840x2160 / Medium / Rendering unreported / RT on | 16 FPS Base GPU test: AMD Radeon RX 6950 XT Settings: Mittel-Preset; RT: GI „Mittel“, Schatten „Ein“VRAM: 16 GBTest CPU: AMD Ryzen 9 7950X3DSystem RAM: 32 GB DDR5-6000 30-38-38-96OS: Windows 11 22H2Driver: 23.4.1Resizable BAR: enabledHVCI: enabled |
| Gaming suite 2023 / Dead Space / 3840x2160 / Ultra / Rendering unreported / RT off | 48.2 FPS Base GPU test: AMD Radeon RX 6950 XT Settings: Ultra-PresetVRAM: 16 GBTest CPU: AMD Ryzen 9 7950X3DSystem RAM: 32 GB DDR5-6000 30-38-38-96OS: Windows 11 22H2Driver: 23.4.1Resizable BAR: enabledHVCI: enabled |
| Gaming suite 2023 / Dead Space / 3840x2160 / Ultra / Rendering unreported / RT on | 43.4 FPS Base GPU test: AMD Radeon RX 6950 XT Settings: Ultra-Preset; RT: AO „Ein“VRAM: 16 GBTest CPU: AMD Ryzen 9 7950X3DSystem RAM: 32 GB DDR5-6000 30-38-38-96OS: Windows 11 22H2Driver: 23.4.1Resizable BAR: enabledHVCI: enabled |
| Gaming suite 2023 / Dying Light 2 / 3840x2160 / High / Rendering unreported / RT off | 52.2 FPS Base GPU test: AMD Radeon RX 6950 XT Settings: Hohe-Qualität-PresetVRAM: 16 GBTest CPU: AMD Ryzen 9 7950X3DSystem RAM: 32 GB DDR5-6000 30-38-38-96OS: Windows 11 22H2Driver: 23.4.1Resizable BAR: enabledHVCI: enabled |
| Gaming suite 2023 / Dying Light 2 / 3840x2160 / High / Rendering unreported / RT on | 27.3 FPS Base GPU test: AMD Radeon RX 6950 XT Settings: Hohe-Qualität-Preset; RT: GI + AO „Ein“VRAM: 16 GBTest CPU: AMD Ryzen 9 7950X3DSystem RAM: 32 GB DDR5-6000 30-38-38-96OS: Windows 11 22H2Driver: 23.4.1Resizable BAR: enabledHVCI: enabled |
| Gaming suite 2023 / F1 22 / 3840x2160 / Ultra high / Rendering unreported / RT off | 129.6 FPS Base GPU test: AMD Radeon RX 6950 XT Settings: Ultrahoch-PresetVRAM: 16 GBTest CPU: AMD Ryzen 9 7950X3DSystem RAM: 32 GB DDR5-6000 30-38-38-96OS: Windows 11 22H2Driver: 23.4.1Resizable BAR: enabledHVCI: enabled |
| Gaming suite 2023 / F1 22 / 3840x2160 / Ultra high / Rendering unreported / RT on | 64 FPS Base GPU test: AMD Radeon RX 6950 XT Settings: Ultrahoch-Preset; RT: Reflexionen (Voll) + Schatten + AO „Mittel“VRAM: 16 GBTest CPU: AMD Ryzen 9 7950X3DSystem RAM: 32 GB DDR5-6000 30-38-38-96OS: Windows 11 22H2Driver: 23.4.1Resizable BAR: enabledHVCI: enabled |
| Gaming suite 2023 / Forspoken / 3840x2160 / High / Rendering unreported / RT off | 45.8 FPS Base GPU test: AMD Radeon RX 6950 XT Settings: Hoch-PresetVRAM: 16 GBTest CPU: AMD Ryzen 9 7950X3DSystem RAM: 32 GB DDR5-6000 30-38-38-96OS: Windows 11 22H2Driver: 23.4.1Resizable BAR: enabledHVCI: enabled |
| Gaming suite 2023 / Forspoken / 3840x2160 / High / Rendering unreported / RT on | 30.1 FPS Base GPU test: AMD Radeon RX 6950 XT Settings: Hoch-Preset; RT: Schatten + AO „Ein“VRAM: 16 GBTest CPU: AMD Ryzen 9 7950X3DSystem RAM: 32 GB DDR5-6000 30-38-38-96OS: Windows 11 22H2Driver: 23.4.1Resizable BAR: enabledHVCI: enabled |
| Gaming suite 2023 / Hogwarts Legacy / 3840x2160 / Ultra / Rendering unreported / RT off | 46.8 FPS Base GPU test: AMD Radeon RX 6950 XT Settings: Ultra-PresetVRAM: 16 GBTest CPU: AMD Ryzen 9 7950X3DSystem RAM: 32 GB DDR5-6000 30-38-38-96OS: Windows 11 22H2Driver: 23.4.1Resizable BAR: enabledHVCI: enabled |
| Gaming suite 2023 / Hogwarts Legacy / 3840x2160 / Ultra / Rendering unreported / RT on | 40.8 FPS Base GPU test: AMD Radeon RX 6950 XT Settings: Ultra-Preset; RT: Reflexionen „Ultra“VRAM: 16 GBTest CPU: AMD Ryzen 9 7950X3DSystem RAM: 32 GB DDR5-6000 30-38-38-96OS: Windows 11 22H2Driver: 23.4.1Resizable BAR: enabledHVCI: enabled |
| Gaming suite 2023 / Metro Exodus PC Enhanced Edition / 3840x2160 / Extreme / Rendering unreported / RT on | 37 FPS Base GPU test: AMD Radeon RX 6950 XT Settings: Extrem-Qualität, kein HW, kein PhysX; RT: „Hoch“ + ReflexionenVRAM: 16 GBTest CPU: AMD Ryzen 9 7950X3DSystem RAM: 32 GB DDR5-6000 30-38-38-96OS: Windows 11 22H2Driver: 23.4.1Resizable BAR: enabledHVCI: enabled |
| Gaming suite 2023 / Resident Evil 4 / 3840x2160 / Maximum / Rendering unreported / RT off | 76.8 FPS Base GPU test: AMD Radeon RX 6950 XT Settings: Maximum-PresetVRAM: 16 GBTest CPU: AMD Ryzen 9 7950X3DSystem RAM: 32 GB DDR5-6000 30-38-38-96OS: Windows 11 22H2Driver: 23.4.1Resizable BAR: enabledHVCI: enabled |
| Gaming suite 2023 / Resident Evil 4 / 3840x2160 / Maximum / Rendering unreported / RT on | 67.5 FPS Base GPU test: AMD Radeon RX 6950 XT Settings: Maximum-Preset; RT: Reflexionen „Hoch“VRAM: 16 GBTest CPU: AMD Ryzen 9 7950X3DSystem RAM: 32 GB DDR5-6000 30-38-38-96OS: Windows 11 22H2Driver: 23.4.1Resizable BAR: enabledHVCI: enabled |
| Gaming suite 2023 / Returnal / 3840x2160 / Epic / Rendering unreported / RT off | 65.9 FPS Base GPU test: AMD Radeon RX 6950 XT Settings: Episch-PresetVRAM: 16 GBTest CPU: AMD Ryzen 9 7950X3DSystem RAM: 32 GB DDR5-6000 30-38-38-96OS: Windows 11 22H2Driver: 23.4.1Resizable BAR: enabledHVCI: enabled |
| Gaming suite 2023 / Returnal / 3840x2160 / Epic / Rendering unreported / RT on | 43.3 FPS Base GPU test: AMD Radeon RX 6950 XT Settings: Episch-Preset; RT: Reflexionen „Episch“, Schatten „Mittel“VRAM: 16 GBTest CPU: AMD Ryzen 9 7950X3DSystem RAM: 32 GB DDR5-6000 30-38-38-96OS: Windows 11 22H2Driver: 23.4.1Resizable BAR: enabledHVCI: enabled |
| Gaming suite 2023 / Spider-Man: Miles Morales / 3840x2160 / Very high / Rendering unreported / RT off | 56.4 FPS Base GPU test: AMD Radeon RX 6950 XT Settings: Sehr-hoch-Preset, 16-faches AF, Schatten „Sehr hoch“, Detailstufe „Sehr hoch“VRAM: 16 GBTest CPU: AMD Ryzen 9 7950X3DSystem RAM: 32 GB DDR5-6000 30-38-38-96OS: Windows 11 22H2Driver: 23.4.1Resizable BAR: enabledHVCI: enabled |
| Gaming suite 2023 / Spider-Man: Miles Morales / 3840x2160 / Very high / Rendering unreported / RT on | 42.9 FPS Base GPU test: AMD Radeon RX 6950 XT Settings: Sehr-hoch-Preset, 16-faches AF, Schatten „Sehr hoch“, Detailstufe „Sehr hoch“; RT: Reflexionen Auflösung „Hoch“, Geometrie „Sehr hoch“, Sichtweite 10, Schatten „Mittel“VRAM: 16 GBTest CPU: AMD Ryzen 9 7950X3DSystem RAM: 32 GB DDR5-6000 30-38-38-96OS: Windows 11 22H2Driver: 23.4.1Resizable BAR: enabledHVCI: enabled |
| Gaming suite 2023 / The Callisto Protocol / 3840x2160 / Ultra / Rendering unreported / RT off | 86 FPS Base GPU test: AMD Radeon RX 6950 XT Settings: Ultra-PresetVRAM: 16 GBTest CPU: AMD Ryzen 9 7950X3DSystem RAM: 32 GB DDR5-6000 30-38-38-96OS: Windows 11 22H2Driver: 23.4.1Resizable BAR: enabledHVCI: enabled |
| Gaming suite 2023 / The Callisto Protocol / 3840x2160 / Ultra / Rendering unreported / RT on | 53 FPS Base GPU test: AMD Radeon RX 6950 XT Settings: Ultra-Preset; RT: Reflexionen „Mittel“, Schatten „Ein“, Übertragung „Ein“VRAM: 16 GBTest CPU: AMD Ryzen 9 7950X3DSystem RAM: 32 GB DDR5-6000 30-38-38-96OS: Windows 11 22H2Driver: 23.4.1Resizable BAR: enabledHVCI: enabled |
| Gaming suite 2023 / The Last of Us Part I / 3840x2160 / High / Rendering unreported / RT off | 49.3 FPS Base GPU test: AMD Radeon RX 6950 XT Settings: Hoch-PresetVRAM: 16 GBTest CPU: AMD Ryzen 9 7950X3DSystem RAM: 32 GB DDR5-6000 30-38-38-96OS: Windows 11 22H2Driver: 23.4.1Resizable BAR: enabledHVCI: enabled |
| Gaming suite 2023 / The Witcher 3 / 3840x2160 / High / Rendering unreported / RT off | 42.5 FPS Base GPU test: AMD Radeon RX 6950 XT Settings: Hoch-PresetVRAM: 16 GBTest CPU: AMD Ryzen 9 7950X3DSystem RAM: 32 GB DDR5-6000 30-38-38-96OS: Windows 11 22H2Driver: 23.4.1Resizable BAR: enabledHVCI: enabled |
| Gaming suite 2023 / The Witcher 3 / 3840x2160 / High / Rendering unreported / RT on | 26.8 FPS Base GPU test: AMD Radeon RX 6950 XT Settings: Hoch-Preset; RT: GI „Performance“, Reflexionen „Ein“VRAM: 16 GBTest CPU: AMD Ryzen 9 7950X3DSystem RAM: 32 GB DDR5-6000 30-38-38-96OS: Windows 11 22H2Driver: 23.4.1Resizable BAR: enabledHVCI: enabled |
| Gaming suite 2023 / Uncharted / 3840x2160 / Ultra / Rendering unreported / RT off | 71.2 FPS Base GPU test: AMD Radeon RX 6950 XT Settings: Ultra-PresetVRAM: 16 GBTest CPU: AMD Ryzen 9 7950X3DSystem RAM: 32 GB DDR5-6000 30-38-38-96OS: Windows 11 22H2Driver: 23.4.1Resizable BAR: enabledHVCI: enabled |
| Gaming suite 2023 / Cyberpunk 2077 / 3840x2160 / Medium / DLSS 2.x/FSR 2.x Quality / RT on | 29.1 FPS Base GPU test: AMD Radeon RX 6950 XT Settings: Mittel-Preset; RT: GI „Mittel“, Schatten „Ein“VRAM: 16 GBTest CPU: AMD Ryzen 9 7950X3DSystem RAM: 32 GB DDR5-6000 30-38-38-96OS: Windows 11 22H2Rendering: FSR 2.x QualityDriver: 23.4.1Resizable BAR: enabledHVCI: enabled |
| Gaming suite 2023 / Dead Space / 3840x2160 / Ultra / DLSS 2.x/FSR 2.x Quality / RT on | 70.9 FPS Base GPU test: AMD Radeon RX 6950 XT Settings: Ultra-Preset; RT: AO „Ein“VRAM: 16 GBTest CPU: AMD Ryzen 9 7950X3DSystem RAM: 32 GB DDR5-6000 30-38-38-96OS: Windows 11 22H2Rendering: FSR 2.x QualityDriver: 23.4.1Resizable BAR: enabledHVCI: enabled |
| Gaming suite 2023 / Dying Light 2 / 3840x2160 / High / DLSS 2.x/FSR 2.x Quality / RT on | 51.1 FPS Base GPU test: AMD Radeon RX 6950 XT Settings: Hohe-Qualität-Preset; RT: GI + AO „Ein“VRAM: 16 GBTest CPU: AMD Ryzen 9 7950X3DSystem RAM: 32 GB DDR5-6000 30-38-38-96OS: Windows 11 22H2Rendering: FSR 2.x QualityDriver: 23.4.1Resizable BAR: enabledHVCI: enabled |
| Gaming suite 2023 / F1 22 / 3840x2160 / Ultra high / DLSS 2.x/FSR 2.x Quality / RT on | 105.8 FPS Base GPU test: AMD Radeon RX 6950 XT Settings: Ultrahoch-Preset; RT: Reflexionen (Voll) + Schatten + AO „Mittel“VRAM: 16 GBTest CPU: AMD Ryzen 9 7950X3DSystem RAM: 32 GB DDR5-6000 30-38-38-96OS: Windows 11 22H2Rendering: FSR 2.x QualityDriver: 23.4.1Resizable BAR: enabledHVCI: enabled |
| Gaming suite 2023 / Forspoken / 3840x2160 / High / DLSS 2.x/FSR 2.x Quality / RT on | 47.5 FPS Base GPU test: AMD Radeon RX 6950 XT Settings: Hoch-Preset; RT: Schatten + AO „Ein“VRAM: 16 GBTest CPU: AMD Ryzen 9 7950X3DSystem RAM: 32 GB DDR5-6000 30-38-38-96OS: Windows 11 22H2Rendering: FSR 2.x QualityDriver: 23.4.1Resizable BAR: enabledHVCI: enabled |
| Gaming suite 2023 / Hogwarts Legacy / 3840x2160 / Ultra / DLSS 2.x/FSR 2.x Quality / RT on | 61.9 FPS Base GPU test: AMD Radeon RX 6950 XT Settings: Ultra-Preset; RT: Reflexionen „Ultra“VRAM: 16 GBTest CPU: AMD Ryzen 9 7950X3DSystem RAM: 32 GB DDR5-6000 30-38-38-96OS: Windows 11 22H2Rendering: FSR 2.x QualityDriver: 23.4.1Resizable BAR: enabledHVCI: enabled |
| Gaming suite 2023 / Spider-Man: Miles Morales / 3840x2160 / Very high / DLSS 2.x/FSR 2.x Quality / RT on | 58.6 FPS Base GPU test: AMD Radeon RX 6950 XT Settings: Sehr-hoch-Preset, 16-faches AF, Schatten „Sehr hoch“, Detailstufe „Sehr hoch“; RT: Reflexionen Auflösung „Hoch“, Geometrie „Sehr hoch“, Sichtweite 10, Schatten „Mittel“VRAM: 16 GBTest CPU: AMD Ryzen 9 7950X3DSystem RAM: 32 GB DDR5-6000 30-38-38-96OS: Windows 11 22H2Rendering: FSR 2.x QualityDriver: 23.4.1Resizable BAR: enabledHVCI: enabled |
| Gaming suite 2023 / The Witcher 3 / 3840x2160 / High / DLSS 2.x/FSR 2.x Quality / RT on | 45.1 FPS Base GPU test: AMD Radeon RX 6950 XT Settings: Hoch-Preset; RT: GI „Performance“, Reflexionen „Ein“VRAM: 16 GBTest CPU: AMD Ryzen 9 7950X3DSystem RAM: 32 GB DDR5-6000 30-38-38-96OS: Windows 11 22H2Rendering: FSR 2.x QualityDriver: 23.4.1Resizable BAR: enabledHVCI: enabled |
A base GPU test is a reference for cards using that GPU and the same memory capacity. Board overclocking, cooling and power limits can change the result.
Confrontare i punteggi dei benchmark più diffusi MSI Radeon RX 6950 XT GAMING X TRIO 16G con altre schede grafiche per capire la reale velocità della GPU nell'elaborazione dei contenuti.
I test includono il lavoro con la virgola mobile, la creazione di modelli 3D, il mining di criptovalute.
These are saved results from the earlier catalog. Measurement dates and test configurations were not recorded. Models with no comparable results are omitted.
Recent models: test results with identified primary sources — Game frame rates
Archived results. The original measurement method and test conditions have not been verified.
Higher values are better in this metric.
Higher values are better in this metric.
Higher values are better in this metric.
Higher values are better in this metric.
Higher values are better in this metric.
Higher values are better in this metric.
Higher values are better in this metric.
Higher values are better in this metric.
Higher values are better in this metric.
These are saved results from the earlier catalog. Measurement dates and test configurations were not recorded. Models with no comparable results are omitted. Index 0–100: equal-weight mean of each score relative to the best saved score among models with both tests. Tests: Battlefield 5 + Shadow of the Tomb Raider. This index does not predict performance in every workload.
Recent models: test results with identified primary sources — Game frame rates
*
Base Clock is the base GPU frequency stated by the manufacturer for this model.
Boost Clock describes automatic frequency increases. Actual clock speed varies with workload, temperature and power limits; it is not a guarantee of manual overclocking.


 English
 Russian
 German
 Portuguese
 French
 Japan
Japan Spanish
 Polish
 Chinese
 Korean