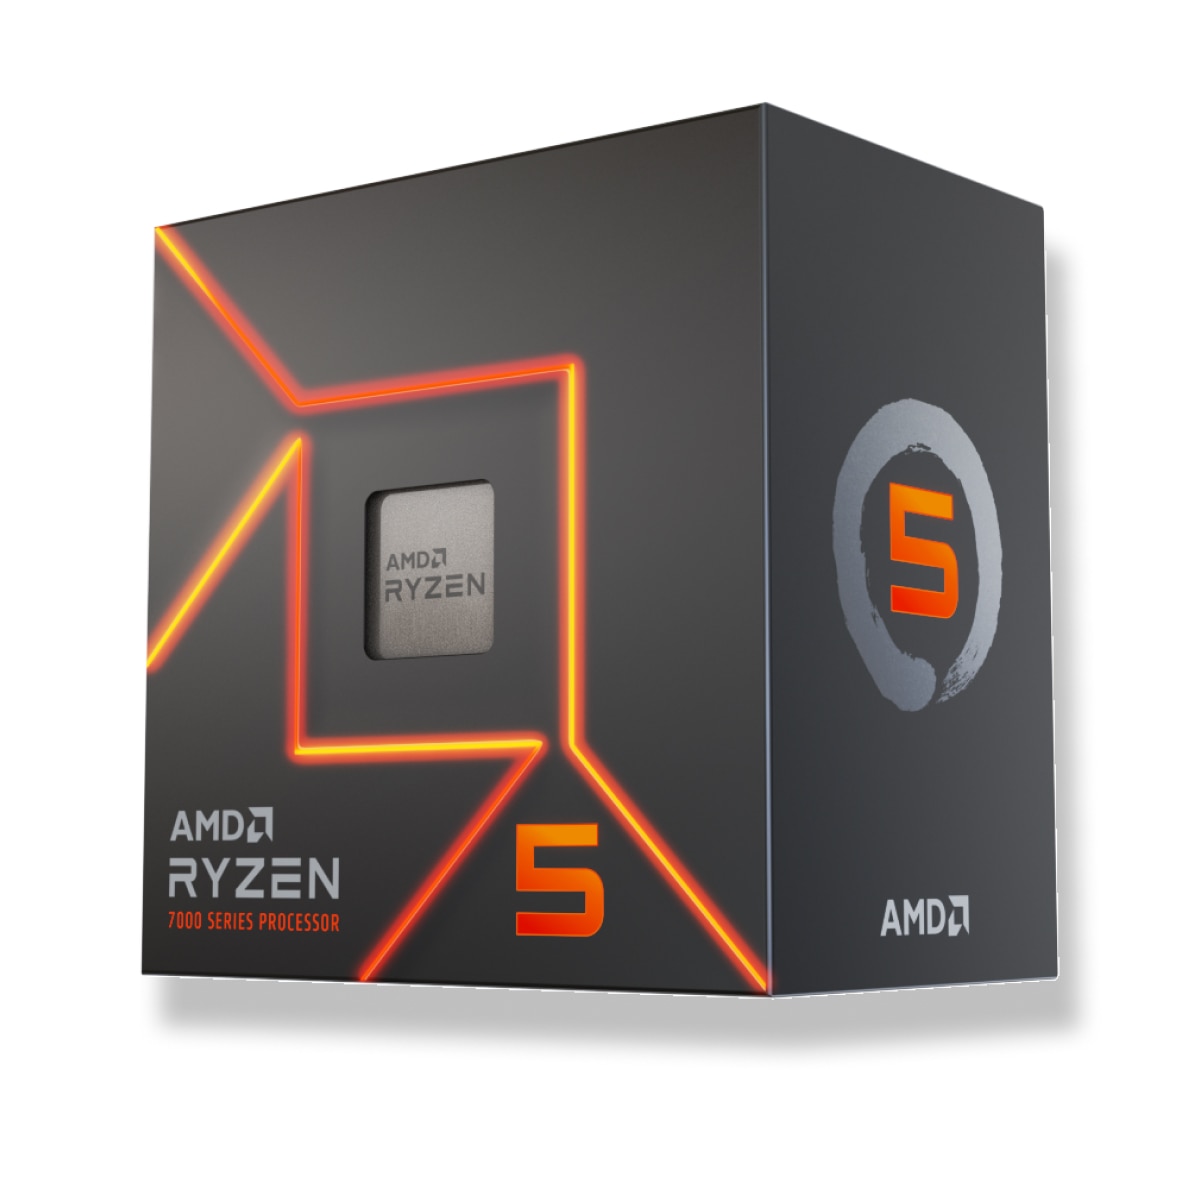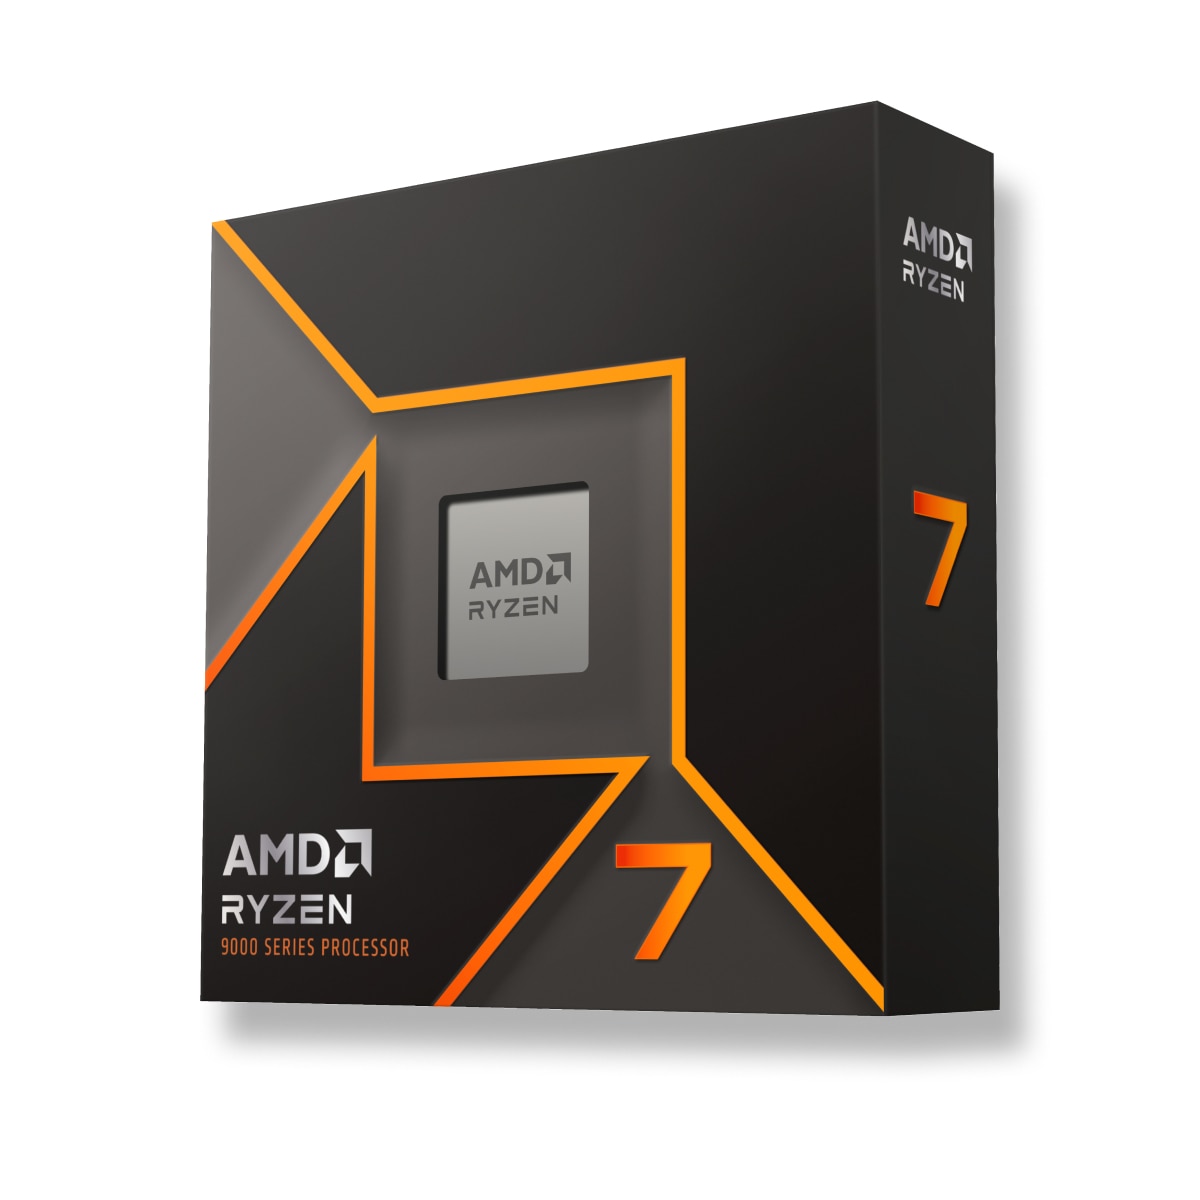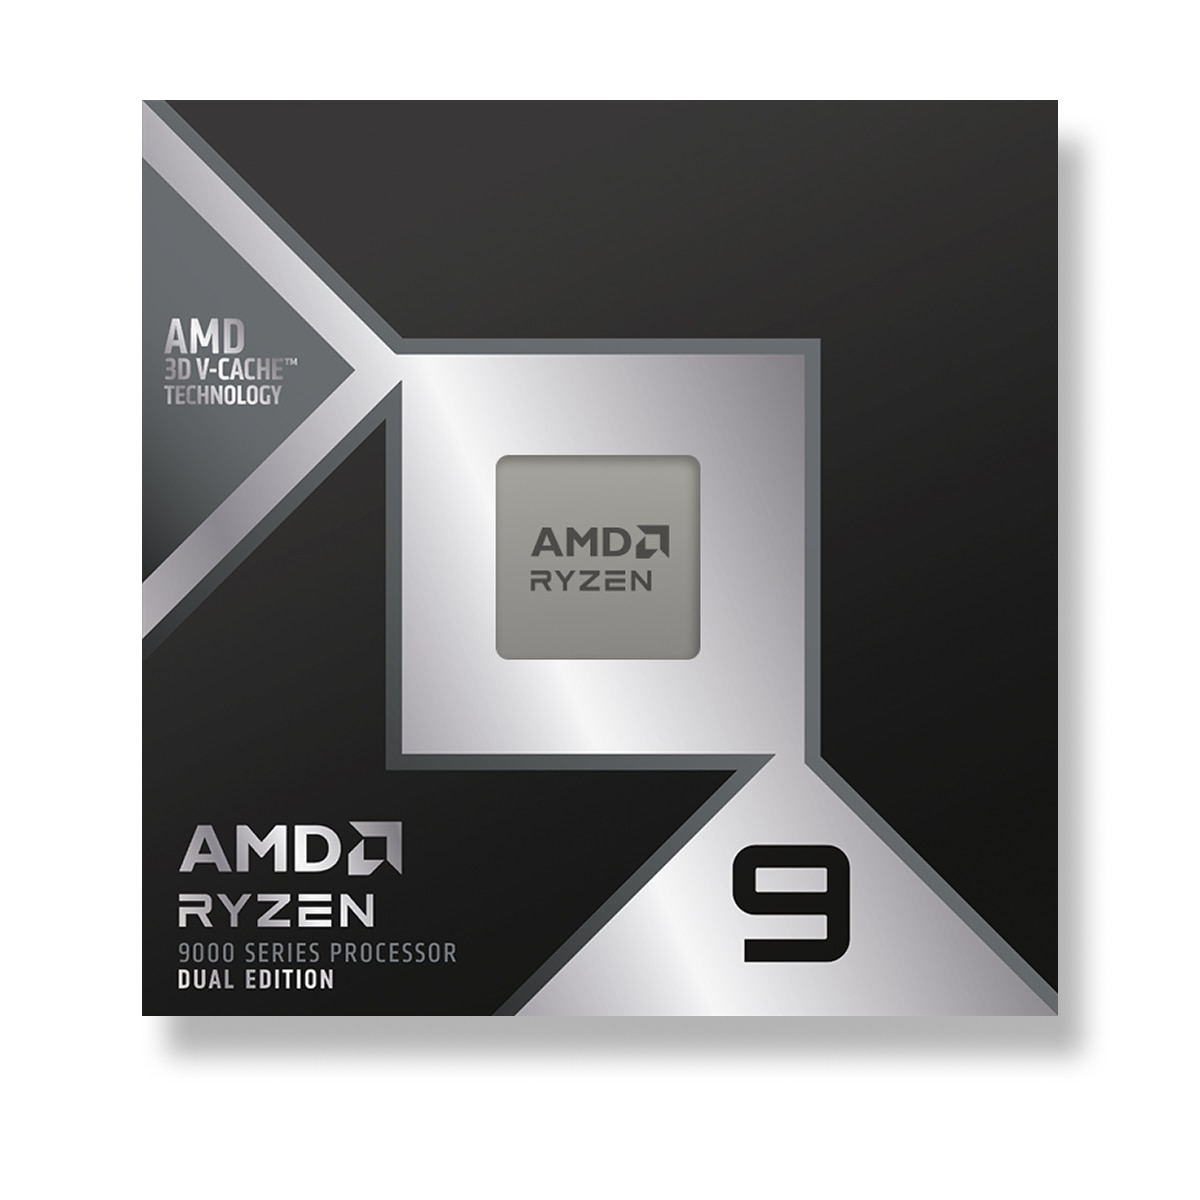
Posiciones comunes AMD Ryzen 9 5950X CPU en pruebas de referencia populares, para comparar con otros modelos.
Published results: 18
Each row uses one Blender version, operating system and compute backend.
| Test and settings | AMD Ryzen 9 5950X |
|---|---|
| Blender 4.0.0 / CPU / Linux | 485.266435 samples/min Submissions: 117 |
| Blender 4.0.0 / CPU / Windows | 373.225213 samples/min Submissions: 340 |
| Blender 4.1.0 / CPU / Linux | 488.996915 samples/min Submissions: 45 |
| Blender 4.1.0 / CPU / Windows | 387.130994 samples/min Submissions: 162 |
| Blender 4.2.0 / CPU / Linux | 450.596613 samples/min Submissions: 102 |
| Blender 4.2.0 / CPU / Windows | 359.342965 samples/min Submissions: 354 |
| Blender 4.3.0 / CPU / Linux | 466.729065 samples/min Submissions: 88 |
| Blender 4.3.0 / CPU / Windows | 363.828367 samples/min Submissions: 286 |
| Blender 4.4.0 / CPU / Linux | 437.509276 samples/min Submissions: 48 |
| Blender 4.4.0 / CPU / Windows | 366.710742 samples/min Submissions: 203 |
| Blender 4.5.0 / CPU / Linux | 450.340522 samples/min Submissions: 124 |
| Blender 4.5.0 / CPU / Windows | 377.12565 samples/min Submissions: 367 |
| Test and settings | AMD Ryzen 9 5950X |
|---|---|
| Blender 5.0.0 / CPU / Windows | 379.714418 samples/min Submissions: 22 |
| Blender 5.1.0 / CPU / Windows | 400.34828 samples/min Submissions: 28 |
| Blender 5.1.1 / CPU / Linux | 455.192491 samples/min Submissions: 62 |
| Blender 5.1.1 / CPU / Windows | 403.442035 samples/min Submissions: 97 |
| Blender 5.2.0 / CPU / Linux | 455.371192 samples/min Submissions: 34 |
| Blender 5.2.0 / CPU / Windows | 409.462285 samples/min Submissions: 60 |
Results were obtained on the reported systems. Test versions and settings remain separate; incomplete conditions do not support calculated model performance differences.
| Result | Reported conditions |
|---|---|
| 511 points | System: 5950X, RX 7900 GRE, 32 GB CPU / power label: 5950X, RX 7900 GRE, 32 GB Source minimum runtime: 0 minutes. Exact test build and complete conditions are unreported; no ranking position. |
| Result | Reported conditions |
|---|---|
| 1625 points | System: Ryzen 9 5950X, 64 GB CPU / power label: Ryzen 9 5950X, 64 GB Source minimum runtime: 0 minutes. Exact test build and complete conditions are unreported; no ranking position. |
| Result | Reported conditions |
|---|---|
| 102 points | System: Ryzen 9 5950X, 64 GB CPU / power label: Ryzen 9 5950X, 64 GB Source minimum runtime: 0 minutes. Exact test build and complete conditions are unreported; no ranking position. |
| Result | Reported conditions |
|---|---|
| 28782 points | System: CB: Ryzen 9 5950X @ Stock CPU / power label: CB: Ryzen 9 5950X @ Stock Exact test build and complete conditions are unreported; no ranking position. |
| Result | Reported conditions |
|---|---|
| 1684 points | System: CB: Ryzen 9 5950X @ Stock CPU / power label: CB: Ryzen 9 5950X @ Stock Exact test build and complete conditions are unreported; no ranking position. |
| Result | Reported conditions |
|---|---|
| 10435 points | System: CB: Ryzen 9 5950X @Stock CPU / power label: CB: Ryzen 9 5950X @Stock Exact test build and complete conditions are unreported; no ranking position. |
| Result | Reported conditions |
|---|---|
| 649 points | System: CB: Ryzen 9 5950X @Stock CPU / power label: CB: Ryzen 9 5950X @Stock Exact test build and complete conditions are unreported; no ranking position. |
Compara las puntuaciones de los puntos de referencia más populares AMD Ryzen 9 5950X con otros procesadores para conocer la velocidad real de la CPU al procesar contenidos.
Las pruebas incluyen cálculos matemáticos, creación de modelos 3D, minería de criptomonedas, pruebas en modo mononúcleo y multinúcleo.
These are saved results from the earlier catalog. Measurement dates and test configurations were not recorded. Models with no comparable results are omitted.
Recent models: test results with identified primary sources — Cinebench R23 · Cinebench R20 · Cinebench R15 · Cinebench 2026 · RandomX benchmark
Higher values are better in this metric.
Higher values are better in this metric.
Higher values are better in this metric.
Higher values are better in this metric.
Higher values are better in this metric.
Higher values are better in this metric.
Higher values are better in this metric.
Higher values are better in this metric.
Higher values are better in this metric.
Higher values are better in this metric.
These are saved results from the earlier catalog. Measurement dates and test configurations were not recorded. Models with no comparable results are omitted. Index 0–100: equal-weight mean of each score relative to the best saved score among models with both tests. Tests: Cinebench R23 Multi-Core + Geekbench 5 Multi-Core. This index does not predict performance in every workload.
Recent models: test results with identified primary sources — Cinebench R23 · Cinebench R20 · Cinebench R15 · Cinebench 2026 · RandomX benchmark
*
PL1 is the sustained processor power limit; PL2 is the short-term turbo power limit. They are not measured performance or efficiency.
Los valores se utilizan para seleccionar el sistema de refrigeración y la fuente de alimentación óptimos.


 English
 Russian
 German
 Portuguese
 Italian
 French
 Japan
Japan Polish
 Chinese
 Korean