Select processor 1
Select processor 2
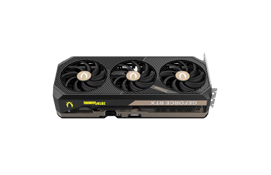
NVIDIA RTX A5500
NVIDIA GeForce RTX 3080 Ti Max-Q

NVIDIA RTX A5500 vs NVIDIA GeForce RTX 3080 Ti Max-Q. Specifications

User rating
star star star star star
Released
Q1/2022
NVIDIA RTX A5500
NVIDIA RTX A5500
Released
Q1/2022
User rating
star star star star star
NVIDIA GeForce RTX 3080 Ti Max-Q

What's the best choice NVIDIA RTX A5500 or NVIDIA GeForce RTX 3080 Ti Max-Q? Which graphics card is faster?

Compare the available specifications of these models.

NVIDIA RTX A5500 has a base frequency of 1.170 GHz. Memory size 24 GB. Memory type GDDR6. Released in Q1/2022.

NVIDIA GeForce RTX 3080 Ti Max-Q has a base frequency of 0.6 GHz. Memory size 16 GB. Memory type GDDR6. Released in Q1/2022.

Differences

Videokards Reasons to consider
NVIDIA RTX A5500
Report a bug
  • Higher clock speed

    Around 95% better clock speed

    1.170 GHz left arrow 0.6 GHz
  • More memory

    50% more memory

    24 GB left arrow 16 GB

Positions in all rankings

Common positions NVIDIA RTX A5500 GPU in popular benchmarks, for comparison with other models.

  • Passmark Performance Test GPU
    3 place

Positions in all rankings

Common positions NVIDIA GeForce RTX 3080 Ti Max-Q GPU in popular benchmarks, for comparison with other models.

No data

Specifications

Technical data
NVIDIA RTX A5500 NVIDIA RTX A5500
NVIDIA GeForce RTX 3080 Ti Max-Q NVIDIA GeForce RTX 3080 Ti Max-Q
General info

Comparison of basic technical data of graphics cards NVIDIA RTX A5500 and NVIDIA GeForce RTX 3080 Ti Max-Q, chip, information processing units.

  • Architecture
    Ampere left arrow Ampere
  • Execution Units
    80 left arrow 7424
  • GPU Chip
    GA102 left arrow GN20-E8-A1
  • L1 Cache
    128 KB left arrow -
  • L2 Cache
    6 MB left arrow -
  • Render Output Units
    96 left arrow 96
  • Shader
    10240 left arrow -
  • Texture Units
    320 left arrow 232
  • Based on
    - left arrow GA103S
Memory settings

Video memory capacity, type, bus width and bandwidth describe different properties. These values alone do not determine graphics performance.

  • Memory Bandwidth
    768 GB/s left arrow 384 GB/s
  • Memory Bus
    384 bit left arrow 256 bit
  • Memory Clock
    2000 MHz left arrow -
  • Memory Data Rate
    16 Gbps left arrow -
  • Memory Size
    24 GB left arrow 16 GB
  • Memory Type
    GDDR6 left arrow GDDR6
  • Memory Speed (legacy frequency label)
    - left arrow 1500 MHz
Clock frequency

Published GPU clock frequencies describe different operating modes. Clock speed alone does not determine graphics performance.

  • Base Clock
    1170 MHz left arrow 600 MHz
  • Boost Clock
    1695 MHz left arrow 1125 MHz
  • Overclocking
    - left arrow No
Thermal Management

Graphics card power limits and recommended system power supply describe different specifications.

  • TDP
    230 W left arrow 80 W
Interfaces

Connectivity and connections.

  • DisplayPort Ports
    4 × DisplayPort 1.4a left arrow -
  • PCIe Interface
    PCIe 4.0 x16 left arrow PCIe 4.0 x16
  • Power Connectors
    1x 8-pin left arrow No
Technical data

Technical data that is used to its full potential in computer games.

  • DirectX
    12_2 left arrow 12_2
  • Max. resolution
    7680 x 4320 at 60 Hz left arrow 7680 × 4320
  • OpenCL
    3.0 left arrow 3.0
  • OpenGL
    4.6 left arrow 4.6
  • Shader Model
    6.6 left arrow 6.5
  • Vulkan
    1.3 left arrow 1.3
Dimensions

The difference in size, weight and slot of the compared devices

  • Length
    267 mm left arrow -
  • Slot Size
    Dual-slot left arrow -
  • Width
    112 mm left arrow -
More information

Comparison of interfaces and release dates for GPU NVIDIA GeForce RTX 3080 Ti Max-Q and NVIDIA RTX A5500.

  • Process Technology
    8 nm left arrow 8 nm
Theoretical Performance

  • FP16 (theoretical)
    34.71 TFLOPS left arrow 16.7 TFLOPS
  • FP32 (theoretical)
    34.71 TFLOPS left arrow 16.7 TFLOPS
  • FP64 (theoretical)
    1,085 GFLOPS left arrow 0.261 TFLOPS
  • Pixel Rate
    162.7 GPixel/s left arrow 108.0 GPixel/s
  • Texture Rate
    542.4 GTexel/s left arrow 261.0 GTexel/s

Benchmarks

Performance tests GPUs

No comparable benchmark results are available yet. Specifications alone do not determine which model is faster.

These are saved results from the earlier catalog. Measurement dates and test configurations were not recorded. Models with no comparable results are omitted.

Recent models: test results with identified primary sources — Game frame rates

Latest comparisons