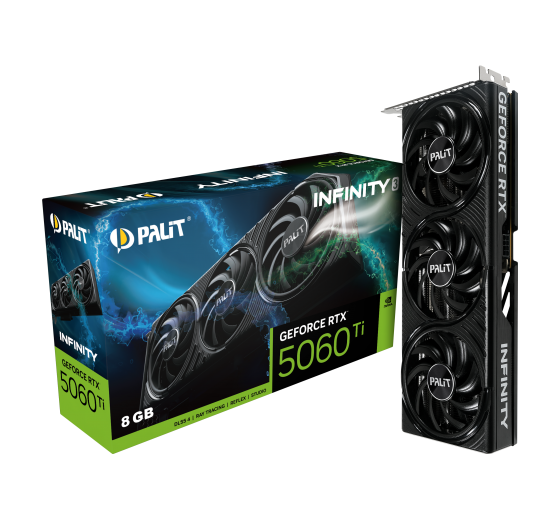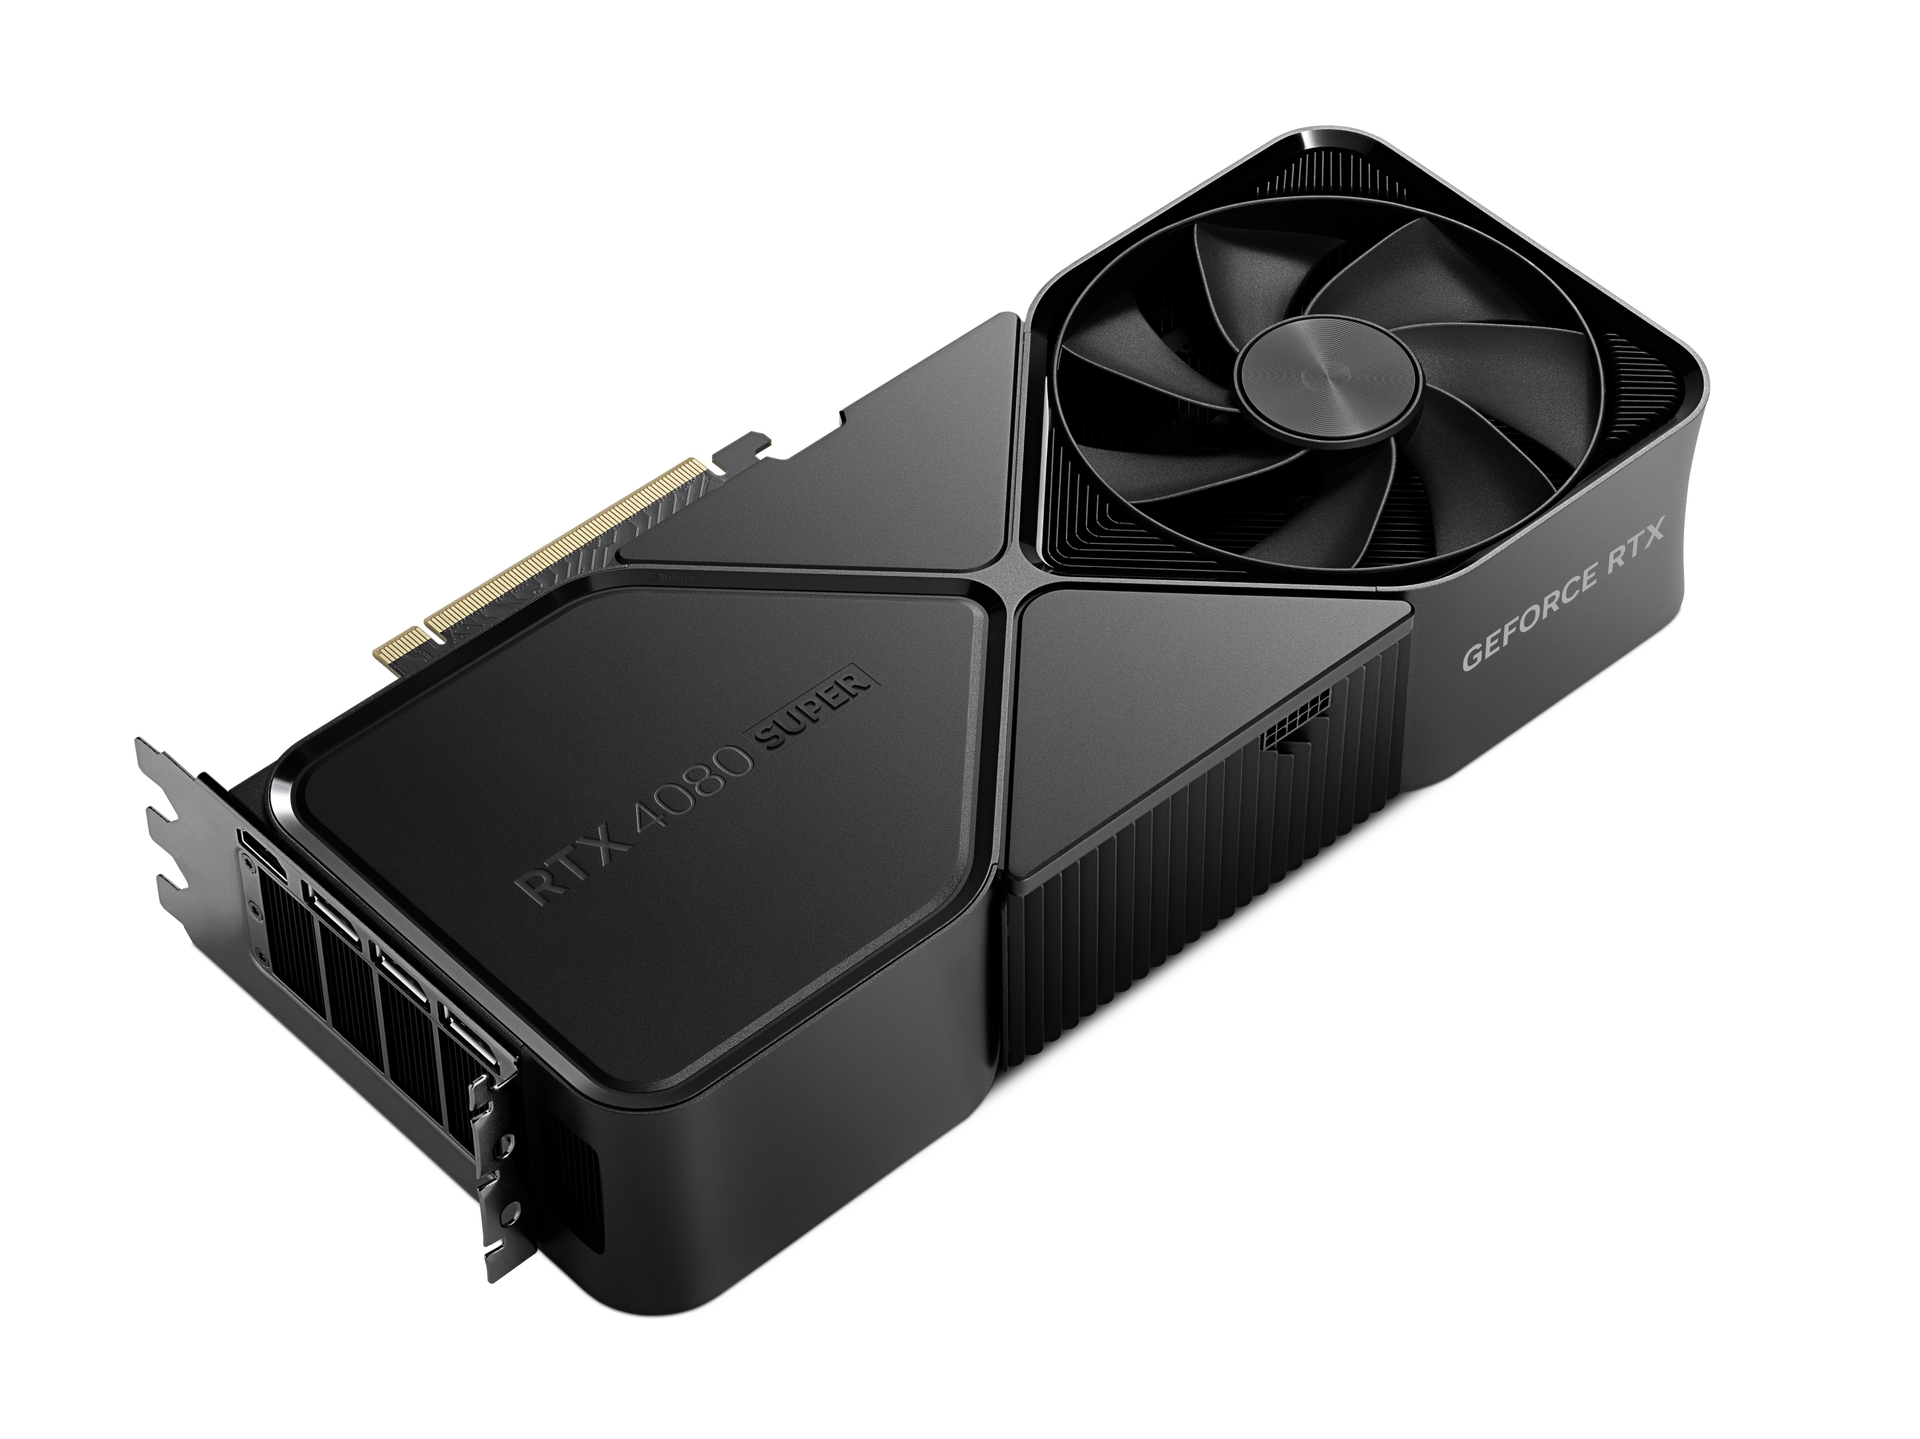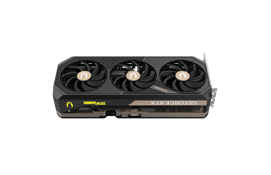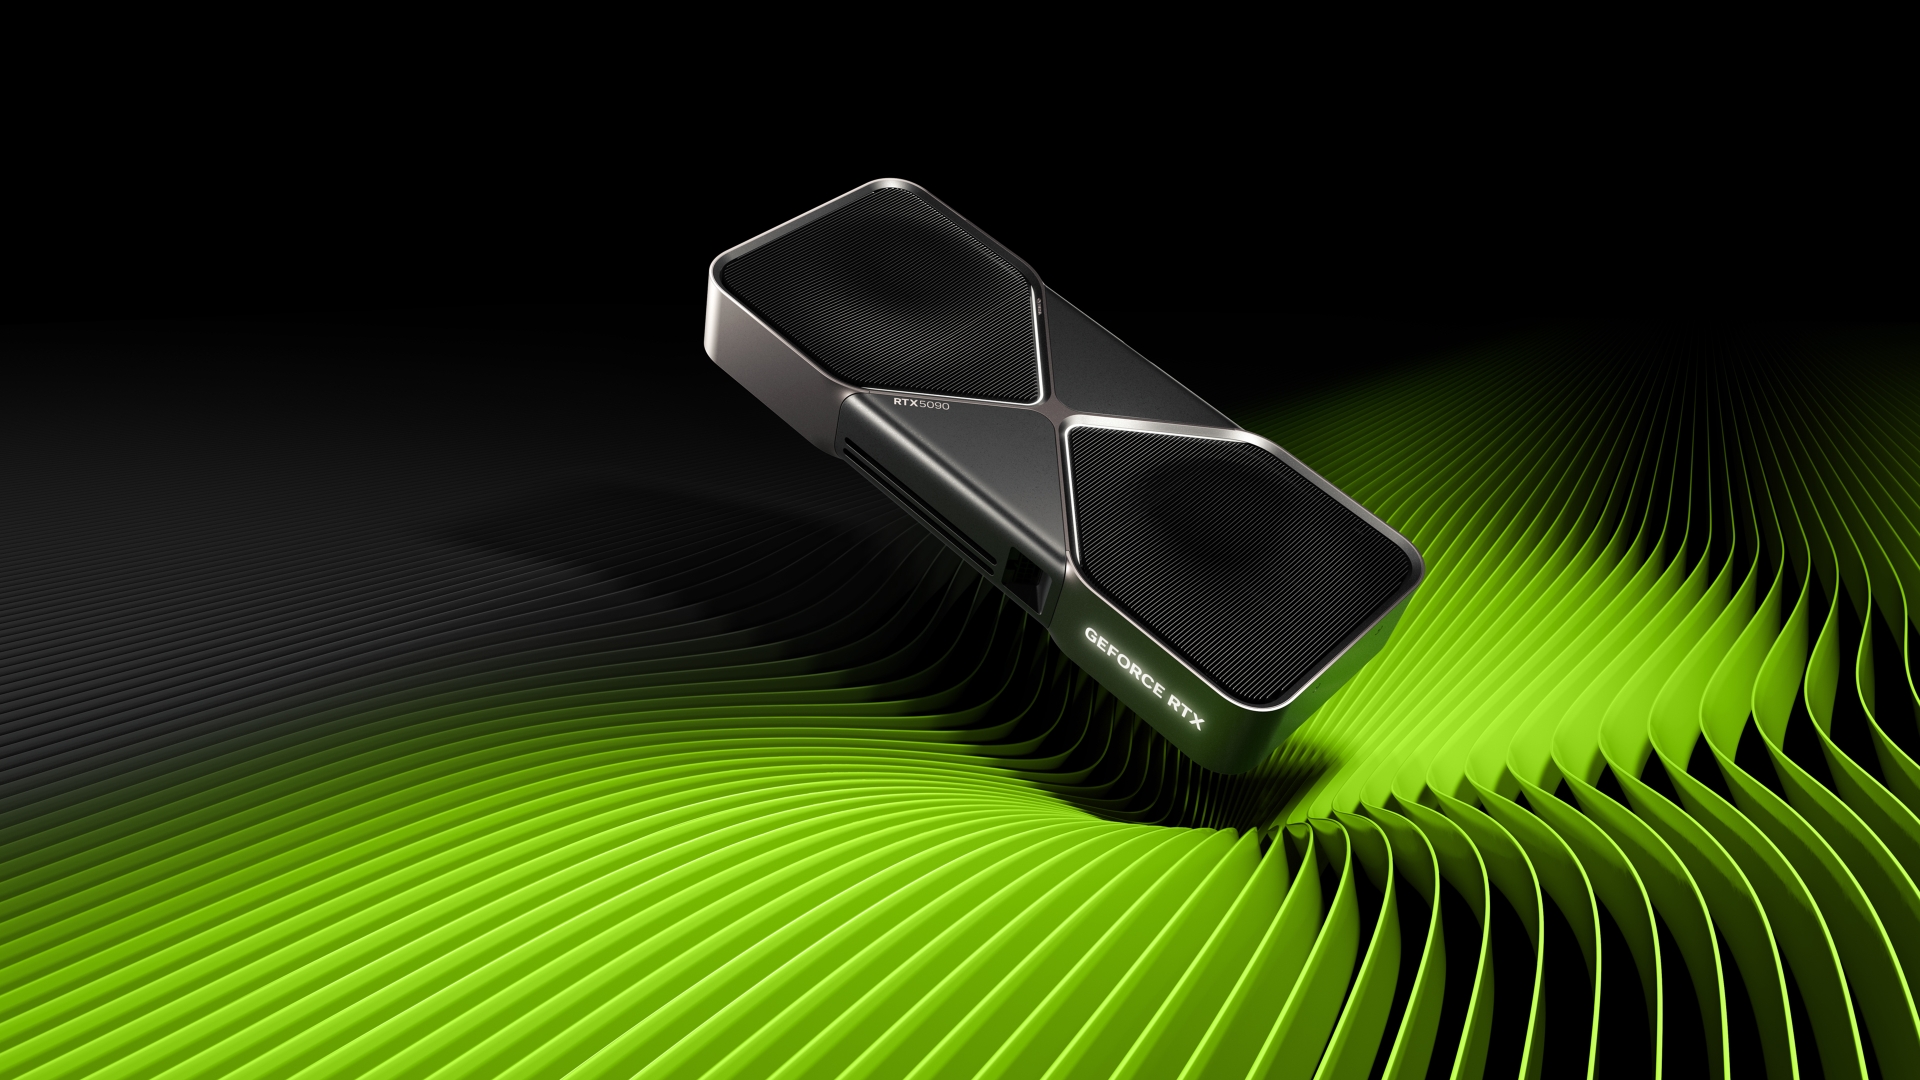


What's the best choice NVIDIA GeForce RTX 5090 or NVIDIA GeForce RTX 4090? Which graphics card is faster?
Compare the available specifications of these models.
NVIDIA GeForce RTX 5090 has a base frequency of 2.01 GHz. Memory size 32 GB. Memory type GDDR7. Released in 2025-01-30.
NVIDIA GeForce RTX 4090 has a base frequency of 2.23 GHz. Memory size 24 GB. Memory type GDDR6X. Released in Q4/2022.
Reasons to consider More memory
33% more memory
 24 GB
Reasons to consider
Higher clock speed
Around 11% better clock speed
2.01 GHz
Common positions NVIDIA GeForce RTX 4090 GPU in popular benchmarks, for comparison with other models.
NVIDIA GeForce RTX 5090
Comparison of basic technical data of graphics cards NVIDIA GeForce RTX 5090 and NVIDIA GeForce RTX 4090, chip, information processing units.
 Ada Lovelace
NVIDIA GeForce RTX 4090
16384
16384
AD102-300 / AD102-301 (Ada Lovelace)
192
128
128
512
Video memory capacity, type, bus width and bandwidth describe different properties. These values alone do not determine graphics performance.
1008 GB/s
384 bit
24 GB
GDDR6X
1313 MHz
21 Gbps
Published GPU clock frequencies describe different operating modes. Clock speed alone does not determine graphics performance.
2230 MHz
2520 MHz
-
Yes
Graphics card power limits and recommended system power supply describe different specifications.
90 °C
850 W (System power requirement)
450 W
90 °C
450 W-25 %
450 W
Types and sizes of coolers for graphics card cooling system NVIDIA GeForce RTX 5090 and NVIDIA GeForce RTX 4090.
Air cooling
Axial
2 x 110 mm
-
0 dB / Silent
39 dB
Connectivity and connections.
PCIe 4.0 x16
3 × DisplayPort
-
2.3
1 × HDMI 2.1
4
HDMI
3x PCIe 8-pin cables (adapter in box) OR 1x 450 W or greater PCIe Gen 5 cable
-
-
Technical data that is used to its full potential in computer games.
12_2 (Ultimate)
Yes
No LED lighting
7680 × 4320
Yes
Built-in support for video and image compression standards.
Decode
Decode / Encode
Decode / Encode
Decode
Decode
The difference in size, weight and slot of the compared devices
137 mm
304 mm
3 PCIe-Slots
-
61 mm
Comparison of interfaces and release dates for GPU NVIDIA GeForce RTX 4090 and NVIDIA GeForce RTX 5090.
data sheet
1,599 $ (Reference)
NVIDIA Founders Edition/reference design. Clock specifications apply to gaming use. AIB shipping specifications and complete-system power needs may differ.
-
4 nm
Q4/2022
Shared tests with results for both models: 40
Each row is a separate graphics subtest. Scores are not game FPS.
| Test and settings | NVIDIA GeForce RTX 5090 | NVIDIA GeForce RTX 4090 | Result difference¹ |
|---|---|---|---|
| 3DMark – Steel Nomad — Steel Nomad Score / DirectX 12 | 14032 points Base GPU test: Nvidia GeForce RTX 5090 VRAM: 32 GBOS: Windows 11Graphics API: DirectX 12HVCI: enabledApplication version unreported | 9361 points Base GPU test: Nvidia GeForce RTX 4090 VRAM: 24 GBOS: Windows 11Graphics API: DirectX 12HVCI: enabledApplication version unreported | -33.3 % |
| 3DMark – Time Spy — Graphics Score / DirectX 12 | 47760 points Base GPU test: Nvidia GeForce RTX 5090 VRAM: 32 GBTest CPU: AMD Ryzen 9 7950X3DOS: Windows 11Graphics API: DirectX 12HVCI: enabledApplication version unreported | 36676 points Base GPU test: Nvidia GeForce RTX 4090 VRAM: 24 GBTest CPU: AMD Ryzen 9 7950X3DOS: Windows 11Graphics API: DirectX 12HVCI: enabledApplication version unreported | -23.2 % |
Each row uses one game, resolution, test suite and graphics mode.
| Test and settings | NVIDIA GeForce RTX 5090 | NVIDIA GeForce RTX 4090 | Result difference¹ |
|---|---|---|---|
| ComputerBase GPU suite 2026 / Alan Wake 2 / 2560x1440 / Maximale Grafikdetails / DLSS/FSR Quality / RT off | 138 FPS Rendering: DLSS 4.0 QualityDriver: 596.21 | 110.6 FPS Rendering: DLSS 4.0 QualityDriver: 596.21 | -19.9 % |
| ComputerBase GPU suite 2026 / Alan Wake 2 / 2560x1440 / Maximale Grafikdetails / DLSS/FSR Quality / RT on | 122.1 FPS Rendering: DLSS 4.0 QualityDriver: 596.21 | 96.6 FPS Rendering: DLSS 4.0 QualityDriver: 596.21 | -20.9 % |
| ComputerBase GPU suite 2026 / Alan Wake 2 / 3440x1440 / Maximale Grafikdetails / DLSS/FSR Quality / RT off | 120 FPS Rendering: DLSS 4.0 QualityDriver: 596.21 | 94.3 FPS Rendering: DLSS 4.0 QualityDriver: 596.21 | -21.4 % |
| ComputerBase GPU suite 2026 / Alan Wake 2 / 3440x1440 / Maximale Grafikdetails / DLSS/FSR Quality / RT on | 103.2 FPS Rendering: DLSS 4.0 QualityDriver: 596.21 | 80 FPS Rendering: DLSS 4.0 QualityDriver: 596.21 | -22.5 % |
| ComputerBase GPU suite 2026 / Alan Wake 2 / 3840x2160 / Maximale Grafikdetails / DLSS/FSR Quality / RT off | 96.3 FPS Rendering: DLSS 4.0 QualityDriver: 596.21 | 73.4 FPS Rendering: DLSS 4.0 QualityDriver: 596.21 | -23.8 % |
| ComputerBase GPU suite 2026 / Alan Wake 2 / 3840x2160 / Maximale Grafikdetails / DLSS/FSR Quality / RT on | 77.1 FPS Rendering: DLSS 4.0 QualityDriver: 596.21 | 58.1 FPS Rendering: DLSS 4.0 QualityDriver: 596.21 | -24.6 % |
| ComputerBase GPU suite 2026 / Anno 117 / 2560x1440 / Ultra-Hoch-Preset / DLSS/FSR Quality / RT off | 150.7 FPS Rendering: DLSS 4.0 QualityDriver: 596.21 | 123.8 FPS Rendering: DLSS 4.0 QualityDriver: 596.21 | -17.9 % |
| ComputerBase GPU suite 2026 / Anno 117 / 2560x1440 / Ultra-Hoch-Preset / DLSS/FSR Quality / RT on | 126.5 FPS Rendering: DLSS 4.0 QualityDriver: 596.21 | 99.1 FPS Rendering: DLSS 4.0 QualityDriver: 596.21 | -21.7 % |
| ComputerBase GPU suite 2026 / Anno 117 / 3440x1440 / Ultra-Hoch-Preset / DLSS/FSR Quality / RT off | 133.2 FPS Rendering: DLSS 4.0 QualityDriver: 596.21 | 107.9 FPS Rendering: DLSS 4.0 QualityDriver: 596.21 | -19.0 % |
| ComputerBase GPU suite 2026 / Anno 117 / 3440x1440 / Ultra-Hoch-Preset / DLSS/FSR Quality / RT on | 110.2 FPS Rendering: DLSS 4.0 QualityDriver: 596.21 | 86.2 FPS Rendering: DLSS 4.0 QualityDriver: 596.21 | -21.8 % |
| ComputerBase GPU suite 2026 / Anno 117 / 3840x2160 / Ultra-Hoch-Preset / DLSS/FSR Quality / RT off | 111.4 FPS Rendering: DLSS 4.0 QualityDriver: 596.21 | 90.3 FPS Rendering: DLSS 4.0 QualityDriver: 596.21 | -18.9 % |
| ComputerBase GPU suite 2026 / Anno 117 / 3840x2160 / Ultra-Hoch-Preset / DLSS/FSR Quality / RT on | 87.7 FPS Rendering: DLSS 4.0 QualityDriver: 596.21 | 67.2 FPS Rendering: DLSS 4.0 QualityDriver: 596.21 | -23.4 % |
| Test and settings | NVIDIA GeForce RTX 5090 | NVIDIA GeForce RTX 4090 | Result difference¹ |
|---|---|---|---|
| ComputerBase GPU suite 2026 / ARC Raiders / 2560x1440 / Episch-Preset / DLSS/FSR Native / RT off | 194.8 FPS Rendering: DLSS 4.0 NativeDriver: 596.21 | 167.6 FPS Rendering: DLSS 4.0 NativeDriver: 596.21 | -14.0 % |
| ComputerBase GPU suite 2026 / ARC Raiders / 2560x1440 / Episch-Preset / DLSS/FSR Native / RT on | 169.9 FPS Rendering: DLSS 4.0 NativeDriver: 596.21 | 144.2 FPS Rendering: DLSS 4.0 NativeDriver: 596.21 | -15.1 % |
| ComputerBase GPU suite 2026 / ARC Raiders / 3440x1440 / Episch-Preset / DLSS/FSR Native / RT off | 168.2 FPS Rendering: DLSS 4.0 NativeDriver: 596.21 | 145 FPS Rendering: DLSS 4.0 NativeDriver: 596.21 | -13.8 % |
| ComputerBase GPU suite 2026 / ARC Raiders / 3440x1440 / Episch-Preset / DLSS/FSR Native / RT on | 150 FPS Rendering: DLSS 4.0 NativeDriver: 596.21 | 127.4 FPS Rendering: DLSS 4.0 NativeDriver: 596.21 | -15.1 % |
| ComputerBase GPU suite 2026 / ARC Raiders / 3840x2160 / Episch-Preset / DLSS/FSR Native / RT off | 126.7 FPS Rendering: DLSS 4.0 NativeDriver: 596.21 | 102.8 FPS Rendering: DLSS 4.0 NativeDriver: 596.21 | -18.9 % |
| ComputerBase GPU suite 2026 / ARC Raiders / 3840x2160 / Episch-Preset / DLSS/FSR Native / RT on | 113.5 FPS Rendering: DLSS 4.0 NativeDriver: 596.21 | 92 FPS Rendering: DLSS 4.0 NativeDriver: 596.21 | -18.9 % |
| ComputerBase GPU suite 2026 / Assassin's Creed Shadows / 2560x1440 / Extrem-Hoch-Preset / DLSS/FSR Quality / RT off | 101.9 FPS Rendering: DLSS 4.0 QualityDriver: 596.21 | 93.6 FPS Rendering: DLSS 4.0 QualityDriver: 596.21 | -8.1 % |
| ComputerBase GPU suite 2026 / Assassin's Creed Shadows / 2560x1440 / Extrem-Hoch-Preset / DLSS/FSR Quality / RT on | 78 FPS Rendering: DLSS 4.0 QualityDriver: 596.21 | 71.1 FPS Rendering: DLSS 4.0 QualityDriver: 596.21 | -8.8 % |
| ComputerBase GPU suite 2026 / Assassin's Creed Shadows / 3440x1440 / Extrem-Hoch-Preset / DLSS/FSR Quality / RT off | 99.3 FPS Rendering: DLSS 4.0 QualityDriver: 596.21 | 86.9 FPS Rendering: DLSS 4.0 QualityDriver: 596.21 | -12.5 % |
| ComputerBase GPU suite 2026 / Assassin's Creed Shadows / 3440x1440 / Extrem-Hoch-Preset / DLSS/FSR Quality / RT on | 75.8 FPS Rendering: DLSS 4.0 QualityDriver: 596.21 | 65.7 FPS Rendering: DLSS 4.0 QualityDriver: 596.21 | -13.3 % |
| ComputerBase GPU suite 2026 / Assassin's Creed Shadows / 3840x2160 / Extrem-Hoch-Preset / DLSS/FSR Quality / RT off | 88.6 FPS Rendering: DLSS 4.0 QualityDriver: 596.21 | 77 FPS Rendering: DLSS 4.0 QualityDriver: 596.21 | -13.1 % |
| ComputerBase GPU suite 2026 / Assassin's Creed Shadows / 3840x2160 / Extrem-Hoch-Preset / DLSS/FSR Quality / RT on | 64.9 FPS Rendering: DLSS 4.0 QualityDriver: 596.21 | 56.7 FPS Rendering: DLSS 4.0 QualityDriver: 596.21 | -12.6 % |
Each row uses one Blender version, operating system and compute backend.
| Test and settings | NVIDIA GeForce RTX 5090 | NVIDIA GeForce RTX 4090 | Result difference¹ |
|---|---|---|---|
| Blender 5.2.0 / OPTIX / Linux | 16903.96071 samples/min Submissions: 27 | 11846.386373 samples/min Submissions: 13 | -29.9 % |
| Blender 5.2.0 / OPTIX / Windows | 16027.936347 samples/min Submissions: 131 | 11569.425088 samples/min Submissions: 68 | -27.8 % |
| Blender 5.1.1 / OPTIX / Linux | 17122.896491 samples/min Submissions: 37 | 12173.930948 samples/min Submissions: 29 | -28.9 % |
| Blender 5.1.1 / OPTIX / Windows | 16188.890119 samples/min Submissions: 198 | 11480.172372 samples/min Submissions: 103 | -29.1 % |
| Blender 5.1.0 / OPTIX / Linux | 17302.176848 samples/min Submissions: 13 | 12138.000809 samples/min Submissions: 15 | -29.8 % |
| Blender 5.1.0 / OPTIX / Windows | 16177.447806 samples/min Submissions: 88 | 11577.83769 samples/min Submissions: 49 | -28.4 % |
| Blender 5.0.0 / OPTIX / Linux | 14937.224949 samples/min Submissions: 11 | 11313.88285 samples/min Submissions: 8 | -24.3 % |
| Blender 5.0.0 / OPTIX / Windows | 14247.621192 samples/min Submissions: 34 | 10557.54543 samples/min Submissions: 32 | -25.9 % |
| Blender 4.5.0 / OPTIX / Linux | 15671.60366 samples/min Submissions: 223 | 11469.759697 samples/min Submissions: 74 | -26.8 % |
| Blender 4.5.0 / OPTIX / Windows | 14883.639209 samples/min Submissions: 1332 | 11001.477887 samples/min Submissions: 453 | -26.1 % |
| Blender 4.4.0 / OPTIX / Linux | 15668.456263 samples/min Submissions: 73 | 11556.614253 samples/min Submissions: 74 | -26.2 % |
| Blender 4.4.0 / OPTIX / Windows | 15034.643666 samples/min Submissions: 844 | 11030.268697 samples/min Submissions: 330 | -26.6 % |
| Test and settings | NVIDIA GeForce RTX 5090 | NVIDIA GeForce RTX 4090 | Result difference¹ |
|---|---|---|---|
| Blender 4.3.0 / OPTIX / Linux | 15303.779733 samples/min Submissions: 6 | 11398.037287 samples/min Submissions: 78 | -25.5 % |
| Blender 4.3.0 / OPTIX / Windows | 14895.095374 samples/min Submissions: 231 | 10893.688375 samples/min Submissions: 650 | -26.9 % |
¹ Difference of the second result relative to the first in that row. No percentage is calculated for different upscaling algorithms. This compares published results, not a universal performance index.
A base GPU test is a reference for cards using that GPU and the same memory capacity. Board overclocking, cooling and power limits can change the result.
These results have no shared test of both models with the same version and settings. They are shown separately without a percentage difference.
Published measurements are separate from the archived index. Incomplete conditions and unknown run counts do not support ranking positions or calculated performance differences.
| Model | Test | Result | Reported conditions |
|---|---|---|---|
| NVIDIA GeForce RTX 5090 | The Witcher 3: Wild Hunt - Remastered / 1440p / Ultra / Native | 173 FPS | Test CPU: AMD Ryzen 7 9800X3D System RAM: 32 GB DDR5-6000 Specific partner board and exact game build unreported. |
| NVIDIA GeForce RTX 5090 | The Witcher 3: Wild Hunt - Remastered / 4K / Ultra / Native | 107 FPS | Test CPU: AMD Ryzen 7 9800X3D System RAM: 32 GB DDR5-6000 Specific partner board and exact game build unreported. |
Results were obtained on the reported systems. Test versions and settings remain separate; incomplete conditions do not support calculated model performance differences.
| Model | Result | Reported conditions |
|---|---|---|
| NVIDIA GeForce RTX 5090 | 162871 points | System: 9800X3D, RTX 5090, 64 GB Graphics: 9800X3D, RTX 5090, 64 GB Source minimum runtime: 0 minutes. Exact test build and complete conditions are unreported; no ranking position. |
| Model | Result | Reported conditions |
|---|---|---|
| NVIDIA GeForce RTX 4090 | 31793 points | System: GeForce RTX 4090 Graphics: GeForce RTX 4090 Source minimum runtime: 0 minutes. Exact test build and complete conditions are unreported; no ranking position. |


 Russian
 German
 Portuguese
 Italian
 French
 Japan
 Spanish
 Polish
 Chinese
 Korean