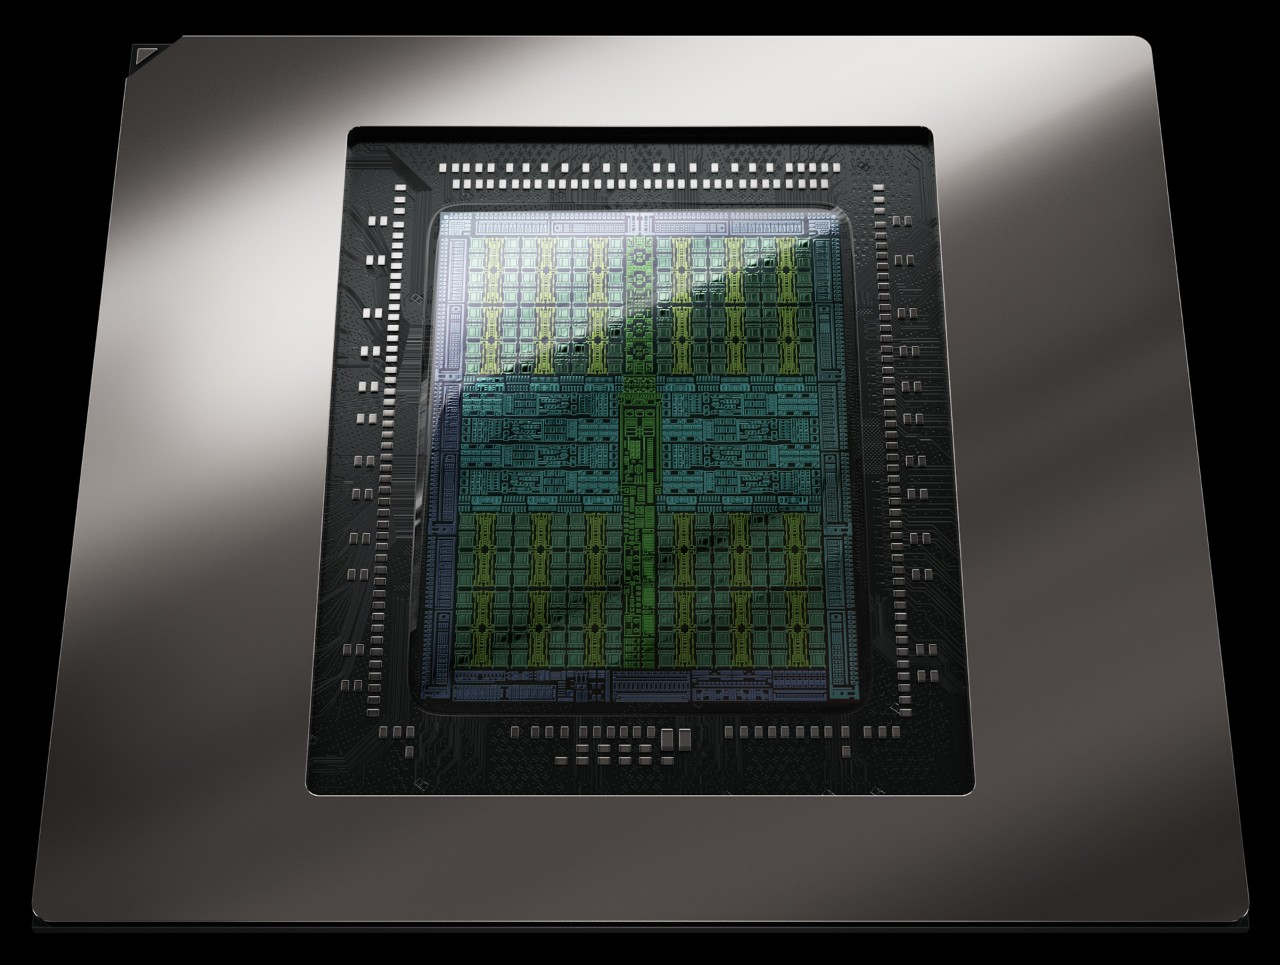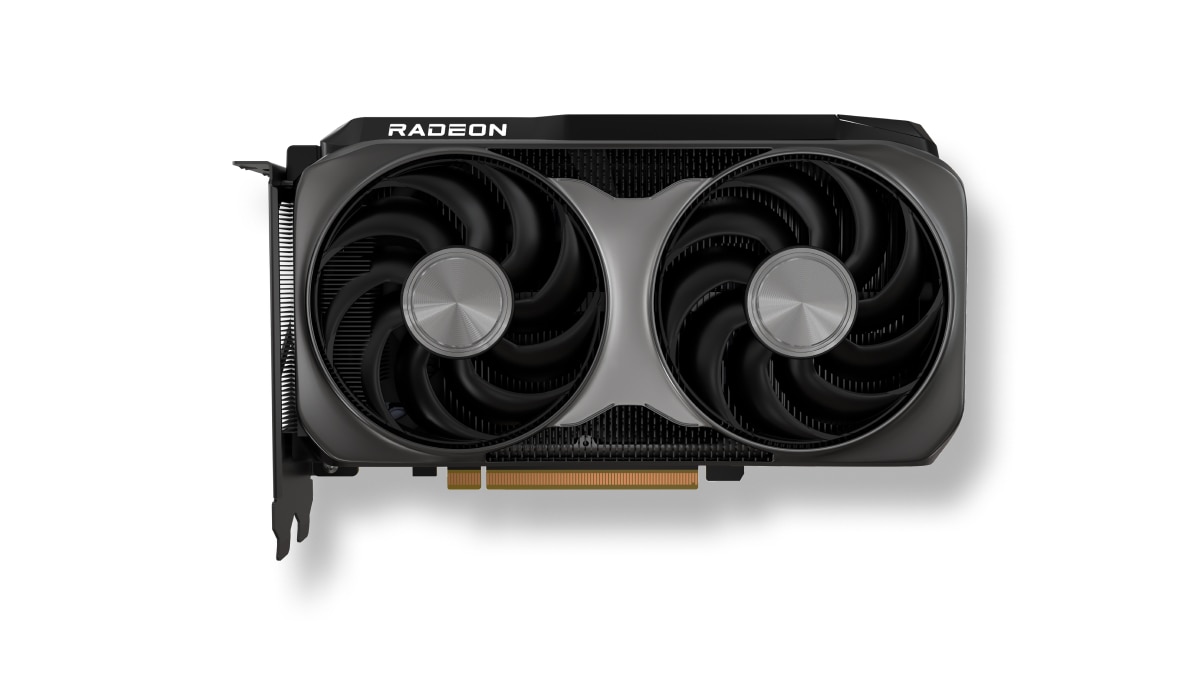

What's the best choice GALAX GeForce RTX 2080 Ti or AMD Radeon RX 6800? Which graphics card is faster?
We have prepared a comparison to help you choose the best graphics card. Compare their specifications and benchmarks.
GALAX GeForce RTX 2080 Ti has a base frequency of 1.350 GHz. Memory size 11 GB. Memory type GDDR6. Released in Q3/2018.
AMD Radeon RX 6800 has a base frequency of 1.700 GHz. Memory size 16 GB. Memory type GDDR6. Released in 2020-11-18.
Reasons to consider Place in the overall ranking
(based on several benchmarks)
 place
place
Common positions GALAX GeForce RTX 2080 Ti GPU in popular benchmarks, for comparison with other models.
Reasons to consider Place in the overall ranking
(based on several benchmarks)
place
Higher clock speed
Around 26% better clock speed
 1.350 GHz
More memory
45% more memory
11 GB
Common positions AMD Radeon RX 6800 GPU in popular benchmarks, for comparison with other models.
GALAX GeForce RTX 2080 Ti
Comparison of basic technical data of graphics cards GALAX GeForce RTX 2080 Ti and AMD Radeon RX 6800, chip, information processing units.
 AMD Radeon RX 6800
60
Navi 21
96
3840
240
60
60
AMD Radeon RX 6800
60
Navi 21
96
3840
240
60
60
Video memory capacity, type, bus width and bandwidth describe different properties. These values alone do not determine graphics performance.
512 GB/s
256 bit
16 GB
2000 MHz
GDDR6
128 MB
16 Gbps
Published GPU clock frequencies describe different operating modes. Clock speed alone does not determine graphics performance.
1700 MHz
2105 MHz
1815 MHz
Yes
Graphics card power limits and recommended system power supply describe different specifications.
-
250 W
285 W
650 W (System power requirement)
250 W
Types and sizes of coolers for graphics card cooling system GALAX GeForce RTX 2080 Ti and AMD Radeon RX 6800.
Air cooling
Axial
3 x 85 mm
-
0 dB / Silent
35 dB
Connectivity and connections.
2 × DisplayPort 1.4a
-
2.3
1 × HDMI 2.1
4
PCIe 4.0 x16
2x8-Pin
1 × USB-C
-
HDMI 2.1 VRR and FRL
Technical data that is used to its full potential in computer games.
12_2
No
Non addressable LED
7680 × 4320
Yes
Built-in support for video and image compression standards.
Decode
Decode / Encode
Decode / Encode
Decode / Encode
Decode / Encode
The difference in size, weight and slot of the compared devices
120 mm
267 mm
2 PCIe-Slots
-
-
Comparison of interfaces and release dates for GPU AMD Radeon RX 6800 and GALAX GeForce RTX 2080 Ti.
-
579 $
-
7 nm
2020-11-18
Shared tests with results for both models: 51
Each row uses one game, resolution, test suite and graphics mode.
| Test and settings | GALAX GeForce RTX 2080 Ti | AMD Radeon RX 6800 | Result difference¹ |
|---|---|---|---|
| Gaming suite 2021 / Assassin's Creed Valhalla / 1920x1080 / Extrem-Hoch-Preset / Rendering unreported | 75.1 FPS Base GPU test: Nvidia GeForce RTX 2080 Ti VRAM: 11 GBTest CPU: AMD Ryzen 9 5950XSystem RAM: 4 × 8 GB G.Skill TridentZ, DDR4-3600 16-16-16-32-1T, optimierte Sekundär-Timings, Single-RankOS: Windows 10 20H2Graphics API: DirectX 12Driver: 461.40Resizable BAR: disabled | 111.1 FPS Base GPU test: AMD Radeon RX 6800 VRAM: 16 GBTest CPU: AMD Ryzen 9 5950XSystem RAM: 4 × 8 GB G.Skill TridentZ, DDR4-3600 16-16-16-32-1T, optimierte Sekundär-Timings, Single-RankOS: Windows 10 20H2Graphics API: DirectX 12Driver: 21.1.1Resizable BAR: enabled | Complete test conditions unreported |
| Gaming suite 2021 / Assassin's Creed Valhalla / 2560x1440 / Extrem-Hoch-Preset / Rendering unreported | 60.2 FPS Base GPU test: Nvidia GeForce RTX 2080 Ti VRAM: 11 GBTest CPU: AMD Ryzen 9 5950XSystem RAM: 4 × 8 GB G.Skill TridentZ, DDR4-3600 16-16-16-32-1T, optimierte Sekundär-Timings, Single-RankOS: Windows 10 20H2Graphics API: DirectX 12Driver: 461.40Resizable BAR: disabled | 82.9 FPS Base GPU test: AMD Radeon RX 6800 VRAM: 16 GBTest CPU: AMD Ryzen 9 5950XSystem RAM: 4 × 8 GB G.Skill TridentZ, DDR4-3600 16-16-16-32-1T, optimierte Sekundär-Timings, Single-RankOS: Windows 10 20H2Graphics API: DirectX 12Driver: 21.1.1Resizable BAR: enabled | Complete test conditions unreported |
| Gaming suite 2021 / Assassin's Creed Valhalla / 3840x2160 / Extrem-Hoch-Preset / Rendering unreported | 38.9 FPS Base GPU test: Nvidia GeForce RTX 2080 Ti VRAM: 11 GBTest CPU: AMD Ryzen 9 5950XSystem RAM: 4 × 8 GB G.Skill TridentZ, DDR4-3600 16-16-16-32-1T, optimierte Sekundär-Timings, Single-RankOS: Windows 10 20H2Graphics API: DirectX 12Driver: 461.40Resizable BAR: disabled | 49.9 FPS Base GPU test: AMD Radeon RX 6800 VRAM: 16 GBTest CPU: AMD Ryzen 9 5950XSystem RAM: 4 × 8 GB G.Skill TridentZ, DDR4-3600 16-16-16-32-1T, optimierte Sekundär-Timings, Single-RankOS: Windows 10 20H2Graphics API: DirectX 12Driver: 21.1.1Resizable BAR: enabled | Complete test conditions unreported |
| Gaming suite 2021 / Borderlands 3 / 1920x1080 / Badass-Preset / Rendering unreported | 124.7 FPS Base GPU test: Nvidia GeForce RTX 2080 Ti VRAM: 11 GBTest CPU: AMD Ryzen 9 5950XSystem RAM: 4 × 8 GB G.Skill TridentZ, DDR4-3600 16-16-16-32-1T, optimierte Sekundär-Timings, Single-RankOS: Windows 10 20H2Graphics API: DirectX 11Driver: 461.40Resizable BAR: disabled | 139.4 FPS Base GPU test: AMD Radeon RX 6800 VRAM: 16 GBTest CPU: AMD Ryzen 9 5950XSystem RAM: 4 × 8 GB G.Skill TridentZ, DDR4-3600 16-16-16-32-1T, optimierte Sekundär-Timings, Single-RankOS: Windows 10 20H2Graphics API: DirectX 12Driver: 21.1.1Resizable BAR: enabled | Complete test conditions unreported |
| Gaming suite 2021 / Borderlands 3 / 2560x1440 / Badass-Preset / Rendering unreported | 89 FPS Base GPU test: Nvidia GeForce RTX 2080 Ti VRAM: 11 GBTest CPU: AMD Ryzen 9 5950XSystem RAM: 4 × 8 GB G.Skill TridentZ, DDR4-3600 16-16-16-32-1T, optimierte Sekundär-Timings, Single-RankOS: Windows 10 20H2Graphics API: DirectX 11Driver: 461.40Resizable BAR: disabled | 98.5 FPS Base GPU test: AMD Radeon RX 6800 VRAM: 16 GBTest CPU: AMD Ryzen 9 5950XSystem RAM: 4 × 8 GB G.Skill TridentZ, DDR4-3600 16-16-16-32-1T, optimierte Sekundär-Timings, Single-RankOS: Windows 10 20H2Graphics API: DirectX 12Driver: 21.1.1Resizable BAR: enabled | Complete test conditions unreported |
| Gaming suite 2021 / Borderlands 3 / 3840x2160 / Badass-Preset / Rendering unreported | 47.5 FPS Base GPU test: Nvidia GeForce RTX 2080 Ti VRAM: 11 GBTest CPU: AMD Ryzen 9 5950XSystem RAM: 4 × 8 GB G.Skill TridentZ, DDR4-3600 16-16-16-32-1T, optimierte Sekundär-Timings, Single-RankOS: Windows 10 20H2Graphics API: DirectX 11Driver: 461.40Resizable BAR: disabled | 53.3 FPS Base GPU test: AMD Radeon RX 6800 VRAM: 16 GBTest CPU: AMD Ryzen 9 5950XSystem RAM: 4 × 8 GB G.Skill TridentZ, DDR4-3600 16-16-16-32-1T, optimierte Sekundär-Timings, Single-RankOS: Windows 10 20H2Graphics API: DirectX 12Driver: 21.1.1Resizable BAR: enabled | Complete test conditions unreported |
| Gaming suite 2021 / Call of Duty Black Ops Cold War / 1920x1080 / Maximale Grafikdetails, SSR Niedrig / Rendering unreported | 126 FPS Base GPU test: Nvidia GeForce RTX 2080 Ti VRAM: 11 GBTest CPU: AMD Ryzen 9 5950XSystem RAM: 4 × 8 GB G.Skill TridentZ, DDR4-3600 16-16-16-32-1T, optimierte Sekundär-Timings, Single-RankOS: Windows 10 20H2Graphics API: DirectX 12Driver: 461.40Resizable BAR: disabled | 136.6 FPS Base GPU test: AMD Radeon RX 6800 VRAM: 16 GBTest CPU: AMD Ryzen 9 5950XSystem RAM: 4 × 8 GB G.Skill TridentZ, DDR4-3600 16-16-16-32-1T, optimierte Sekundär-Timings, Single-RankOS: Windows 10 20H2Graphics API: DirectX 12Driver: 21.1.1Resizable BAR: enabled | Complete test conditions unreported |
| Gaming suite 2021 / Call of Duty Black Ops Cold War / 2560x1440 / Maximale Grafikdetails, SSR Niedrig / Rendering unreported | 91.1 FPS Base GPU test: Nvidia GeForce RTX 2080 Ti VRAM: 11 GBTest CPU: AMD Ryzen 9 5950XSystem RAM: 4 × 8 GB G.Skill TridentZ, DDR4-3600 16-16-16-32-1T, optimierte Sekundär-Timings, Single-RankOS: Windows 10 20H2Graphics API: DirectX 12Driver: 461.40Resizable BAR: disabled | 104 FPS Base GPU test: AMD Radeon RX 6800 VRAM: 16 GBTest CPU: AMD Ryzen 9 5950XSystem RAM: 4 × 8 GB G.Skill TridentZ, DDR4-3600 16-16-16-32-1T, optimierte Sekundär-Timings, Single-RankOS: Windows 10 20H2Graphics API: DirectX 12Driver: 21.1.1Resizable BAR: enabled | Complete test conditions unreported |
| Gaming suite 2021 / Call of Duty Black Ops Cold War / 3840x2160 / Maximale Grafikdetails, SSR Niedrig / Rendering unreported | 52.6 FPS Base GPU test: Nvidia GeForce RTX 2080 Ti VRAM: 11 GBTest CPU: AMD Ryzen 9 5950XSystem RAM: 4 × 8 GB G.Skill TridentZ, DDR4-3600 16-16-16-32-1T, optimierte Sekundär-Timings, Single-RankOS: Windows 10 20H2Graphics API: DirectX 12Driver: 461.40Resizable BAR: disabled | 60.7 FPS Base GPU test: AMD Radeon RX 6800 VRAM: 16 GBTest CPU: AMD Ryzen 9 5950XSystem RAM: 4 × 8 GB G.Skill TridentZ, DDR4-3600 16-16-16-32-1T, optimierte Sekundär-Timings, Single-RankOS: Windows 10 20H2Graphics API: DirectX 12Driver: 21.1.1Resizable BAR: enabled | Complete test conditions unreported |
| Gaming suite 2021 / Control / 1920x1080 / Hoch-Preset / Rendering unreported | 110.4 FPS Base GPU test: Nvidia GeForce RTX 2080 Ti VRAM: 11 GBTest CPU: AMD Ryzen 9 5950XSystem RAM: 4 × 8 GB G.Skill TridentZ, DDR4-3600 16-16-16-32-1T, optimierte Sekundär-Timings, Single-RankOS: Windows 10 20H2Graphics API: DirectX 12Driver: 461.40Resizable BAR: disabled | 122.8 FPS Base GPU test: AMD Radeon RX 6800 VRAM: 16 GBTest CPU: AMD Ryzen 9 5950XSystem RAM: 4 × 8 GB G.Skill TridentZ, DDR4-3600 16-16-16-32-1T, optimierte Sekundär-Timings, Single-RankOS: Windows 10 20H2Graphics API: DirectX 12Driver: 21.1.1Resizable BAR: enabled | Complete test conditions unreported |
| Gaming suite 2021 / Control / 2560x1440 / Hoch-Preset / Rendering unreported | 73.5 FPS Base GPU test: Nvidia GeForce RTX 2080 Ti VRAM: 11 GBTest CPU: AMD Ryzen 9 5950XSystem RAM: 4 × 8 GB G.Skill TridentZ, DDR4-3600 16-16-16-32-1T, optimierte Sekundär-Timings, Single-RankOS: Windows 10 20H2Graphics API: DirectX 12Driver: 461.40Resizable BAR: disabled | 76.1 FPS Base GPU test: AMD Radeon RX 6800 VRAM: 16 GBTest CPU: AMD Ryzen 9 5950XSystem RAM: 4 × 8 GB G.Skill TridentZ, DDR4-3600 16-16-16-32-1T, optimierte Sekundär-Timings, Single-RankOS: Windows 10 20H2Graphics API: DirectX 11Driver: 21.1.1Resizable BAR: enabled | Complete test conditions unreported |
| Gaming suite 2021 / Control / 3840x2160 / Mittel-Preset / Rendering unreported | 49.9 FPS Base GPU test: Nvidia GeForce RTX 2080 Ti VRAM: 11 GBTest CPU: AMD Ryzen 9 5950XSystem RAM: 4 × 8 GB G.Skill TridentZ, DDR4-3600 16-16-16-32-1T, optimierte Sekundär-Timings, Single-RankOS: Windows 10 20H2Graphics API: DirectX 11Driver: 461.40Resizable BAR: disabled | 47.8 FPS Base GPU test: AMD Radeon RX 6800 VRAM: 16 GBTest CPU: AMD Ryzen 9 5950XSystem RAM: 4 × 8 GB G.Skill TridentZ, DDR4-3600 16-16-16-32-1T, optimierte Sekundär-Timings, Single-RankOS: Windows 10 20H2Graphics API: DirectX 11Driver: 21.1.1Resizable BAR: enabled | Complete test conditions unreported |
| Test and settings | GALAX GeForce RTX 2080 Ti | AMD Radeon RX 6800 | Result difference¹ |
|---|---|---|---|
| Gaming suite 2021 / Cyberpunk 2077 / 1920x1080 / Ultra-Preset / Rendering unreported | 75 FPS Base GPU test: Nvidia GeForce RTX 2080 Ti VRAM: 11 GBTest CPU: AMD Ryzen 9 5950XSystem RAM: 4 × 8 GB G.Skill TridentZ, DDR4-3600 16-16-16-32-1T, optimierte Sekundär-Timings, Single-RankOS: Windows 10 20H2Graphics API: DirectX 12Driver: 461.40Resizable BAR: disabled | 79.9 FPS Base GPU test: AMD Radeon RX 6800 VRAM: 16 GBTest CPU: AMD Ryzen 9 5950XSystem RAM: 4 × 8 GB G.Skill TridentZ, DDR4-3600 16-16-16-32-1T, optimierte Sekundär-Timings, Single-RankOS: Windows 10 20H2Graphics API: DirectX 12Driver: 21.1.1Resizable BAR: enabled | Complete test conditions unreported |
| Gaming suite 2021 / Cyberpunk 2077 / 2560x1440 / Ultra-Preset / Rendering unreported | 53.7 FPS Base GPU test: Nvidia GeForce RTX 2080 Ti VRAM: 11 GBTest CPU: AMD Ryzen 9 5950XSystem RAM: 4 × 8 GB G.Skill TridentZ, DDR4-3600 16-16-16-32-1T, optimierte Sekundär-Timings, Single-RankOS: Windows 10 20H2Graphics API: DirectX 12Driver: 461.40Resizable BAR: disabled | 55.7 FPS Base GPU test: AMD Radeon RX 6800 VRAM: 16 GBTest CPU: AMD Ryzen 9 5950XSystem RAM: 4 × 8 GB G.Skill TridentZ, DDR4-3600 16-16-16-32-1T, optimierte Sekundär-Timings, Single-RankOS: Windows 10 20H2Graphics API: DirectX 12Driver: 21.1.1Resizable BAR: enabled | Complete test conditions unreported |
| Gaming suite 2021 / Cyberpunk 2077 / 3840x2160 / Mittel-Preset / Rendering unreported | 43.6 FPS Base GPU test: Nvidia GeForce RTX 2080 Ti VRAM: 11 GBTest CPU: AMD Ryzen 9 5950XSystem RAM: 4 × 8 GB G.Skill TridentZ, DDR4-3600 16-16-16-32-1T, optimierte Sekundär-Timings, Single-RankOS: Windows 10 20H2Graphics API: DirectX 12Driver: 461.40Resizable BAR: disabled | 45.2 FPS Base GPU test: AMD Radeon RX 6800 VRAM: 16 GBTest CPU: AMD Ryzen 9 5950XSystem RAM: 4 × 8 GB G.Skill TridentZ, DDR4-3600 16-16-16-32-1T, optimierte Sekundär-Timings, Single-RankOS: Windows 10 20H2Graphics API: DirectX 12Driver: 21.1.1Resizable BAR: enabled | Complete test conditions unreported |
| Gaming suite 2021 / Death Stranding / 1920x1080 / Sehr-Hoch-Preset / Rendering unreported | 176.3 FPS Base GPU test: Nvidia GeForce RTX 2080 Ti VRAM: 11 GBTest CPU: AMD Ryzen 9 5950XSystem RAM: 4 × 8 GB G.Skill TridentZ, DDR4-3600 16-16-16-32-1T, optimierte Sekundär-Timings, Single-RankOS: Windows 10 20H2Graphics API: DirectX 12Driver: 461.40Resizable BAR: disabled | 178 FPS Base GPU test: AMD Radeon RX 6800 VRAM: 16 GBTest CPU: AMD Ryzen 9 5950XSystem RAM: 4 × 8 GB G.Skill TridentZ, DDR4-3600 16-16-16-32-1T, optimierte Sekundär-Timings, Single-RankOS: Windows 10 20H2Graphics API: DirectX 12Driver: 21.1.1Resizable BAR: enabled | Complete test conditions unreported |
| Gaming suite 2021 / Death Stranding / 2560x1440 / Sehr-Hoch-Preset / Rendering unreported | 135.4 FPS Base GPU test: Nvidia GeForce RTX 2080 Ti VRAM: 11 GBTest CPU: AMD Ryzen 9 5950XSystem RAM: 4 × 8 GB G.Skill TridentZ, DDR4-3600 16-16-16-32-1T, optimierte Sekundär-Timings, Single-RankOS: Windows 10 20H2Graphics API: DirectX 12Driver: 461.40Resizable BAR: disabled | 141.9 FPS Base GPU test: AMD Radeon RX 6800 VRAM: 16 GBTest CPU: AMD Ryzen 9 5950XSystem RAM: 4 × 8 GB G.Skill TridentZ, DDR4-3600 16-16-16-32-1T, optimierte Sekundär-Timings, Single-RankOS: Windows 10 20H2Graphics API: DirectX 12Driver: 21.1.1Resizable BAR: enabled | Complete test conditions unreported |
| Gaming suite 2021 / Death Stranding / 3840x2160 / Sehr-Hoch-Preset / Rendering unreported | 81.7 FPS Base GPU test: Nvidia GeForce RTX 2080 Ti VRAM: 11 GBTest CPU: AMD Ryzen 9 5950XSystem RAM: 4 × 8 GB G.Skill TridentZ, DDR4-3600 16-16-16-32-1T, optimierte Sekundär-Timings, Single-RankOS: Windows 10 20H2Graphics API: DirectX 12Driver: 461.40Resizable BAR: disabled | 87.1 FPS Base GPU test: AMD Radeon RX 6800 VRAM: 16 GBTest CPU: AMD Ryzen 9 5950XSystem RAM: 4 × 8 GB G.Skill TridentZ, DDR4-3600 16-16-16-32-1T, optimierte Sekundär-Timings, Single-RankOS: Windows 10 20H2Graphics API: DirectX 12Driver: 21.1.1Resizable BAR: enabled | Complete test conditions unreported |
| Gaming suite 2021 / Dirt 5 / 1920x1080 / Ultrahoch-Preset / Rendering unreported | 108.5 FPS Base GPU test: Nvidia GeForce RTX 2080 Ti VRAM: 11 GBTest CPU: AMD Ryzen 9 5950XSystem RAM: 4 × 8 GB G.Skill TridentZ, DDR4-3600 16-16-16-32-1T, optimierte Sekundär-Timings, Single-RankOS: Windows 10 20H2Graphics API: DirectX 12Driver: 461.40Resizable BAR: disabled | 123.4 FPS Base GPU test: AMD Radeon RX 6800 VRAM: 16 GBTest CPU: AMD Ryzen 9 5950XSystem RAM: 4 × 8 GB G.Skill TridentZ, DDR4-3600 16-16-16-32-1T, optimierte Sekundär-Timings, Single-RankOS: Windows 10 20H2Graphics API: DirectX 12Driver: 21.1.1Resizable BAR: enabled | Complete test conditions unreported |
| Gaming suite 2021 / Dirt 5 / 2560x1440 / Ultrahoch-Preset / Rendering unreported | 88.6 FPS Base GPU test: Nvidia GeForce RTX 2080 Ti VRAM: 11 GBTest CPU: AMD Ryzen 9 5950XSystem RAM: 4 × 8 GB G.Skill TridentZ, DDR4-3600 16-16-16-32-1T, optimierte Sekundär-Timings, Single-RankOS: Windows 10 20H2Graphics API: DirectX 12Driver: 461.40Resizable BAR: disabled | 101.7 FPS Base GPU test: AMD Radeon RX 6800 VRAM: 16 GBTest CPU: AMD Ryzen 9 5950XSystem RAM: 4 × 8 GB G.Skill TridentZ, DDR4-3600 16-16-16-32-1T, optimierte Sekundär-Timings, Single-RankOS: Windows 10 20H2Graphics API: DirectX 12Driver: 21.1.1Resizable BAR: enabled | Complete test conditions unreported |
| Gaming suite 2021 / Dirt 5 / 3840x2160 / Ultrahoch-Preset / Rendering unreported | 59.8 FPS Base GPU test: Nvidia GeForce RTX 2080 Ti VRAM: 11 GBTest CPU: AMD Ryzen 9 5950XSystem RAM: 4 × 8 GB G.Skill TridentZ, DDR4-3600 16-16-16-32-1T, optimierte Sekundär-Timings, Single-RankOS: Windows 10 20H2Graphics API: DirectX 12Driver: 461.40Resizable BAR: disabled | 65.6 FPS Base GPU test: AMD Radeon RX 6800 VRAM: 16 GBTest CPU: AMD Ryzen 9 5950XSystem RAM: 4 × 8 GB G.Skill TridentZ, DDR4-3600 16-16-16-32-1T, optimierte Sekundär-Timings, Single-RankOS: Windows 10 20H2Graphics API: DirectX 12Driver: 21.1.1Resizable BAR: enabled | Complete test conditions unreported |
| Gaming suite 2021 / Doom Eternal / 1920x1080 / Ultra-Albtraum-Preset / Rendering unreported | 238.9 FPS Base GPU test: Nvidia GeForce RTX 2080 Ti VRAM: 11 GBTest CPU: AMD Ryzen 9 5950XSystem RAM: 4 × 8 GB G.Skill TridentZ, DDR4-3600 16-16-16-32-1T, optimierte Sekundär-Timings, Single-RankOS: Windows 10 20H2Graphics API: VulkanDriver: 461.40Resizable BAR: disabled | 282.5 FPS Base GPU test: AMD Radeon RX 6800 VRAM: 16 GBTest CPU: AMD Ryzen 9 5950XSystem RAM: 4 × 8 GB G.Skill TridentZ, DDR4-3600 16-16-16-32-1T, optimierte Sekundär-Timings, Single-RankOS: Windows 10 20H2Graphics API: VulkanDriver: 21.1.1Resizable BAR: enabled | Complete test conditions unreported |
| Gaming suite 2021 / Doom Eternal / 2560x1440 / Ultra-Albtraum-Preset / Rendering unreported | 175.5 FPS Base GPU test: Nvidia GeForce RTX 2080 Ti VRAM: 11 GBTest CPU: AMD Ryzen 9 5950XSystem RAM: 4 × 8 GB G.Skill TridentZ, DDR4-3600 16-16-16-32-1T, optimierte Sekundär-Timings, Single-RankOS: Windows 10 20H2Graphics API: VulkanDriver: 461.40Resizable BAR: disabled | 215.6 FPS Base GPU test: AMD Radeon RX 6800 VRAM: 16 GBTest CPU: AMD Ryzen 9 5950XSystem RAM: 4 × 8 GB G.Skill TridentZ, DDR4-3600 16-16-16-32-1T, optimierte Sekundär-Timings, Single-RankOS: Windows 10 20H2Graphics API: VulkanDriver: 21.1.1Resizable BAR: enabled | Complete test conditions unreported |
| Gaming suite 2021 / Doom Eternal / 3840x2160 / Ultra-Albtraum-Preset / Rendering unreported | 108.2 FPS Base GPU test: Nvidia GeForce RTX 2080 Ti VRAM: 11 GBTest CPU: AMD Ryzen 9 5950XSystem RAM: 4 × 8 GB G.Skill TridentZ, DDR4-3600 16-16-16-32-1T, optimierte Sekundär-Timings, Single-RankOS: Windows 10 20H2Graphics API: VulkanDriver: 461.40Resizable BAR: disabled | 119.5 FPS Base GPU test: AMD Radeon RX 6800 VRAM: 16 GBTest CPU: AMD Ryzen 9 5950XSystem RAM: 4 × 8 GB G.Skill TridentZ, DDR4-3600 16-16-16-32-1T, optimierte Sekundär-Timings, Single-RankOS: Windows 10 20H2Graphics API: VulkanDriver: 21.1.1Resizable BAR: enabled | Complete test conditions unreported |
| Gaming suite 2021 / F1 2020 / 1920x1080 / Ultrahoch-Preset, ASSAO, SRT Schatten Ein / Rendering unreported | 158.9 FPS Base GPU test: Nvidia GeForce RTX 2080 Ti VRAM: 11 GBTest CPU: AMD Ryzen 9 5950XSystem RAM: 4 × 8 GB G.Skill TridentZ, DDR4-3600 16-16-16-32-1T, optimierte Sekundär-Timings, Single-RankOS: Windows 10 20H2Graphics API: DirectX 12Driver: 461.40Resizable BAR: disabled | 166.2 FPS Base GPU test: AMD Radeon RX 6800 VRAM: 16 GBTest CPU: AMD Ryzen 9 5950XSystem RAM: 4 × 8 GB G.Skill TridentZ, DDR4-3600 16-16-16-32-1T, optimierte Sekundär-Timings, Single-RankOS: Windows 10 20H2Graphics API: DirectX 12Driver: 21.1.1Resizable BAR: enabled | Complete test conditions unreported |
| Gaming suite 2021 / F1 2020 / 2560x1440 / Ultrahoch-Preset, ASSAO, SRT Schatten Ein / Rendering unreported | 119.3 FPS Base GPU test: Nvidia GeForce RTX 2080 Ti VRAM: 11 GBTest CPU: AMD Ryzen 9 5950XSystem RAM: 4 × 8 GB G.Skill TridentZ, DDR4-3600 16-16-16-32-1T, optimierte Sekundär-Timings, Single-RankOS: Windows 10 20H2Graphics API: DirectX 12Driver: 461.40Resizable BAR: disabled | 125.7 FPS Base GPU test: AMD Radeon RX 6800 VRAM: 16 GBTest CPU: AMD Ryzen 9 5950XSystem RAM: 4 × 8 GB G.Skill TridentZ, DDR4-3600 16-16-16-32-1T, optimierte Sekundär-Timings, Single-RankOS: Windows 10 20H2Graphics API: DirectX 12Driver: 21.1.1Resizable BAR: enabled | Complete test conditions unreported |
| Gaming suite 2021 / F1 2020 / 3840x2160 / Ultrahoch-Preset, ASSAO, SRT Schatten Ein / Rendering unreported | 66.9 FPS Base GPU test: Nvidia GeForce RTX 2080 Ti VRAM: 11 GBTest CPU: AMD Ryzen 9 5950XSystem RAM: 4 × 8 GB G.Skill TridentZ, DDR4-3600 16-16-16-32-1T, optimierte Sekundär-Timings, Single-RankOS: Windows 10 20H2Graphics API: DirectX 12Driver: 461.40Resizable BAR: disabled | 71.5 FPS Base GPU test: AMD Radeon RX 6800 VRAM: 16 GBTest CPU: AMD Ryzen 9 5950XSystem RAM: 4 × 8 GB G.Skill TridentZ, DDR4-3600 16-16-16-32-1T, optimierte Sekundär-Timings, Single-RankOS: Windows 10 20H2Graphics API: DirectX 12Driver: 21.1.1Resizable BAR: enabled | Complete test conditions unreported |
| Gaming suite 2021 / Gears 5 / 1920x1080 / Ultra-Preset, Animation Beste, Dynamische Schatten, Volumetrischer Nebel, Oberflächenreflexionen und Umgebungsverdeckung Wahnsinnig, SSGI Strahlen 32, kein VRS / Rendering unreported | 84.5 FPS Base GPU test: Nvidia GeForce RTX 2080 Ti VRAM: 11 GBTest CPU: AMD Ryzen 9 5950XSystem RAM: 4 × 8 GB G.Skill TridentZ, DDR4-3600 16-16-16-32-1T, optimierte Sekundär-Timings, Single-RankOS: Windows 10 20H2Graphics API: DirectX 12Driver: 461.40Resizable BAR: disabled | 100.1 FPS Base GPU test: AMD Radeon RX 6800 VRAM: 16 GBTest CPU: AMD Ryzen 9 5950XSystem RAM: 4 × 8 GB G.Skill TridentZ, DDR4-3600 16-16-16-32-1T, optimierte Sekundär-Timings, Single-RankOS: Windows 10 20H2Graphics API: DirectX 12Driver: 21.1.1Resizable BAR: enabled | Complete test conditions unreported |
| Gaming suite 2021 / Gears 5 / 2560x1440 / Ultra-Preset, Animation Beste, Dynamische Schatten, Volumetrischer Nebel, Oberflächenreflexionen und Umgebungsverdeckung Wahnsinnig, SSGI Strahlen 32, kein VRS / Rendering unreported | 60.9 FPS Base GPU test: Nvidia GeForce RTX 2080 Ti VRAM: 11 GBTest CPU: AMD Ryzen 9 5950XSystem RAM: 4 × 8 GB G.Skill TridentZ, DDR4-3600 16-16-16-32-1T, optimierte Sekundär-Timings, Single-RankOS: Windows 10 20H2Graphics API: DirectX 12Driver: 461.40Resizable BAR: disabled | 71.7 FPS Base GPU test: AMD Radeon RX 6800 VRAM: 16 GBTest CPU: AMD Ryzen 9 5950XSystem RAM: 4 × 8 GB G.Skill TridentZ, DDR4-3600 16-16-16-32-1T, optimierte Sekundär-Timings, Single-RankOS: Windows 10 20H2Graphics API: DirectX 12Driver: 21.1.1Resizable BAR: enabled | Complete test conditions unreported |
| Gaming suite 2021 / Gears 5 / 3840x2160 / Ultra-Preset, kein VRS / Rendering unreported | 47.7 FPS Base GPU test: Nvidia GeForce RTX 2080 Ti VRAM: 11 GBTest CPU: AMD Ryzen 9 5950XSystem RAM: 4 × 8 GB G.Skill TridentZ, DDR4-3600 16-16-16-32-1T, optimierte Sekundär-Timings, Single-RankOS: Windows 10 20H2Graphics API: DirectX 12Driver: 461.40Resizable BAR: disabled | 54.9 FPS Base GPU test: AMD Radeon RX 6800 VRAM: 16 GBTest CPU: AMD Ryzen 9 5950XSystem RAM: 4 × 8 GB G.Skill TridentZ, DDR4-3600 16-16-16-32-1T, optimierte Sekundär-Timings, Single-RankOS: Windows 10 20H2Graphics API: DirectX 12Driver: 21.1.1Resizable BAR: enabled | Complete test conditions unreported |
| Gaming suite 2021 / Hitman 3 / 1920x1080 / Maximale Grafikdetails, kein VRS / Rendering unreported | 151.5 FPS Base GPU test: Nvidia GeForce RTX 2080 Ti VRAM: 11 GBTest CPU: AMD Ryzen 9 5950XSystem RAM: 4 × 8 GB G.Skill TridentZ, DDR4-3600 16-16-16-32-1T, optimierte Sekundär-Timings, Single-RankOS: Windows 10 20H2Graphics API: DirectX 12Driver: 461.40Resizable BAR: disabled | 158.3 FPS Base GPU test: AMD Radeon RX 6800 VRAM: 16 GBTest CPU: AMD Ryzen 9 5950XSystem RAM: 4 × 8 GB G.Skill TridentZ, DDR4-3600 16-16-16-32-1T, optimierte Sekundär-Timings, Single-RankOS: Windows 10 20H2Graphics API: DirectX 12Driver: 21.1.1Resizable BAR: enabled | Complete test conditions unreported |
| Gaming suite 2021 / Hitman 3 / 2560x1440 / Maximale Grafikdetails, kein VRS / Rendering unreported | 109.6 FPS Base GPU test: Nvidia GeForce RTX 2080 Ti VRAM: 11 GBTest CPU: AMD Ryzen 9 5950XSystem RAM: 4 × 8 GB G.Skill TridentZ, DDR4-3600 16-16-16-32-1T, optimierte Sekundär-Timings, Single-RankOS: Windows 10 20H2Graphics API: DirectX 12Driver: 461.40Resizable BAR: disabled | 119.9 FPS Base GPU test: AMD Radeon RX 6800 VRAM: 16 GBTest CPU: AMD Ryzen 9 5950XSystem RAM: 4 × 8 GB G.Skill TridentZ, DDR4-3600 16-16-16-32-1T, optimierte Sekundär-Timings, Single-RankOS: Windows 10 20H2Graphics API: DirectX 12Driver: 21.1.1Resizable BAR: enabled | Complete test conditions unreported |
| Gaming suite 2021 / Hitman 3 / 3840x2160 / Maximale Grafikdetails, kein VRS / Rendering unreported | 67.8 FPS Base GPU test: Nvidia GeForce RTX 2080 Ti VRAM: 11 GBTest CPU: AMD Ryzen 9 5950XSystem RAM: 4 × 8 GB G.Skill TridentZ, DDR4-3600 16-16-16-32-1T, optimierte Sekundär-Timings, Single-RankOS: Windows 10 20H2Graphics API: DirectX 12Driver: 461.40Resizable BAR: disabled | 76.7 FPS Base GPU test: AMD Radeon RX 6800 VRAM: 16 GBTest CPU: AMD Ryzen 9 5950XSystem RAM: 4 × 8 GB G.Skill TridentZ, DDR4-3600 16-16-16-32-1T, optimierte Sekundär-Timings, Single-RankOS: Windows 10 20H2Graphics API: DirectX 12Driver: 21.1.1Resizable BAR: enabled | Complete test conditions unreported |
| Gaming suite 2021 / Horizon Zero Dawn / 1920x1080 / Ultimative-Qualität-Preset / Rendering unreported | 91.3 FPS Base GPU test: Nvidia GeForce RTX 2080 Ti VRAM: 11 GBTest CPU: AMD Ryzen 9 5950XSystem RAM: 4 × 8 GB G.Skill TridentZ, DDR4-3600 16-16-16-32-1T, optimierte Sekundär-Timings, Single-RankOS: Windows 10 20H2Graphics API: DirectX 12Driver: 461.40Resizable BAR: disabled | 91.4 FPS Base GPU test: AMD Radeon RX 6800 VRAM: 16 GBTest CPU: AMD Ryzen 9 5950XSystem RAM: 4 × 8 GB G.Skill TridentZ, DDR4-3600 16-16-16-32-1T, optimierte Sekundär-Timings, Single-RankOS: Windows 10 20H2Graphics API: DirectX 12Driver: 21.1.1Resizable BAR: enabled | Complete test conditions unreported |
| Gaming suite 2021 / Horizon Zero Dawn / 2560x1440 / Ultimative-Qualität-Preset / Rendering unreported | 75.1 FPS Base GPU test: Nvidia GeForce RTX 2080 Ti VRAM: 11 GBTest CPU: AMD Ryzen 9 5950XSystem RAM: 4 × 8 GB G.Skill TridentZ, DDR4-3600 16-16-16-32-1T, optimierte Sekundär-Timings, Single-RankOS: Windows 10 20H2Graphics API: DirectX 12Driver: 461.40Resizable BAR: disabled | 79.2 FPS Base GPU test: AMD Radeon RX 6800 VRAM: 16 GBTest CPU: AMD Ryzen 9 5950XSystem RAM: 4 × 8 GB G.Skill TridentZ, DDR4-3600 16-16-16-32-1T, optimierte Sekundär-Timings, Single-RankOS: Windows 10 20H2Graphics API: DirectX 12Driver: 21.1.1Resizable BAR: enabled | Complete test conditions unreported |
| Gaming suite 2021 / Horizon Zero Dawn / 3840x2160 / Ultimative-Qualität-Preset / Rendering unreported | 48.7 FPS Base GPU test: Nvidia GeForce RTX 2080 Ti VRAM: 11 GBTest CPU: AMD Ryzen 9 5950XSystem RAM: 4 × 8 GB G.Skill TridentZ, DDR4-3600 16-16-16-32-1T, optimierte Sekundär-Timings, Single-RankOS: Windows 10 20H2Graphics API: DirectX 12Driver: 461.40Resizable BAR: disabled | 50.6 FPS Base GPU test: AMD Radeon RX 6800 VRAM: 16 GBTest CPU: AMD Ryzen 9 5950XSystem RAM: 4 × 8 GB G.Skill TridentZ, DDR4-3600 16-16-16-32-1T, optimierte Sekundär-Timings, Single-RankOS: Windows 10 20H2Graphics API: DirectX 12Driver: 21.1.1Resizable BAR: enabled | Complete test conditions unreported |
| Gaming suite 2021 / Mafia: Definitive Edition / 1920x1080 / Hoch-Preset / Rendering unreported | 128.7 FPS Base GPU test: Nvidia GeForce RTX 2080 Ti VRAM: 11 GBTest CPU: AMD Ryzen 9 5950XSystem RAM: 4 × 8 GB G.Skill TridentZ, DDR4-3600 16-16-16-32-1T, optimierte Sekundär-Timings, Single-RankOS: Windows 10 20H2Graphics API: DirectX 12Driver: 461.40Resizable BAR: disabled | 118.6 FPS Base GPU test: AMD Radeon RX 6800 VRAM: 16 GBTest CPU: AMD Ryzen 9 5950XSystem RAM: 4 × 8 GB G.Skill TridentZ, DDR4-3600 16-16-16-32-1T, optimierte Sekundär-Timings, Single-RankOS: Windows 10 20H2Graphics API: DirectX 12Driver: 21.1.1Resizable BAR: enabled | Complete test conditions unreported |
| Gaming suite 2021 / Mafia: Definitive Edition / 2560x1440 / Hoch-Preset / Rendering unreported | 91.1 FPS Base GPU test: Nvidia GeForce RTX 2080 Ti VRAM: 11 GBTest CPU: AMD Ryzen 9 5950XSystem RAM: 4 × 8 GB G.Skill TridentZ, DDR4-3600 16-16-16-32-1T, optimierte Sekundär-Timings, Single-RankOS: Windows 10 20H2Graphics API: DirectX 12Driver: 461.40Resizable BAR: disabled | 89.9 FPS Base GPU test: AMD Radeon RX 6800 VRAM: 16 GBTest CPU: AMD Ryzen 9 5950XSystem RAM: 4 × 8 GB G.Skill TridentZ, DDR4-3600 16-16-16-32-1T, optimierte Sekundär-Timings, Single-RankOS: Windows 10 20H2Graphics API: DirectX 12Driver: 21.1.1Resizable BAR: enabled | Complete test conditions unreported |
| Gaming suite 2021 / Mafia: Definitive Edition / 3840x2160 / Hoch-Preset / Rendering unreported | 51.6 FPS Base GPU test: Nvidia GeForce RTX 2080 Ti VRAM: 11 GBTest CPU: AMD Ryzen 9 5950XSystem RAM: 4 × 8 GB G.Skill TridentZ, DDR4-3600 16-16-16-32-1T, optimierte Sekundär-Timings, Single-RankOS: Windows 10 20H2Graphics API: DirectX 12Driver: 461.40Resizable BAR: disabled | 50.5 FPS Base GPU test: AMD Radeon RX 6800 VRAM: 16 GBTest CPU: AMD Ryzen 9 5950XSystem RAM: 4 × 8 GB G.Skill TridentZ, DDR4-3600 16-16-16-32-1T, optimierte Sekundär-Timings, Single-RankOS: Windows 10 20H2Graphics API: DirectX 12Driver: 21.1.1Resizable BAR: enabled | Complete test conditions unreported |
| Gaming suite 2021 / Red Dead Redemption 2 / 1920x1080 / Höchstes Grafik-Preset / Rendering unreported | 77 FPS Base GPU test: Nvidia GeForce RTX 2080 Ti VRAM: 11 GBTest CPU: AMD Ryzen 9 5950XSystem RAM: 4 × 8 GB G.Skill TridentZ, DDR4-3600 16-16-16-32-1T, optimierte Sekundär-Timings, Single-RankOS: Windows 10 20H2Graphics API: VulkanDriver: 461.40Resizable BAR: disabled | 89.5 FPS Base GPU test: AMD Radeon RX 6800 VRAM: 16 GBTest CPU: AMD Ryzen 9 5950XSystem RAM: 4 × 8 GB G.Skill TridentZ, DDR4-3600 16-16-16-32-1T, optimierte Sekundär-Timings, Single-RankOS: Windows 10 20H2Graphics API: DirectX 12Driver: 21.1.1Resizable BAR: enabled | Complete test conditions unreported |
| Gaming suite 2021 / Red Dead Redemption 2 / 2560x1440 / Höchstes Grafik-Preset / Rendering unreported | 65.5 FPS Base GPU test: Nvidia GeForce RTX 2080 Ti VRAM: 11 GBTest CPU: AMD Ryzen 9 5950XSystem RAM: 4 × 8 GB G.Skill TridentZ, DDR4-3600 16-16-16-32-1T, optimierte Sekundär-Timings, Single-RankOS: Windows 10 20H2Graphics API: VulkanDriver: 461.40Resizable BAR: disabled | 72.6 FPS Base GPU test: AMD Radeon RX 6800 VRAM: 16 GBTest CPU: AMD Ryzen 9 5950XSystem RAM: 4 × 8 GB G.Skill TridentZ, DDR4-3600 16-16-16-32-1T, optimierte Sekundär-Timings, Single-RankOS: Windows 10 20H2Graphics API: DirectX 12Driver: 21.1.1Resizable BAR: enabled | Complete test conditions unreported |
| Gaming suite 2021 / Red Dead Redemption 2 / 3840x2160 / Höchstes Grafik-Preset / Rendering unreported | 42.7 FPS Base GPU test: Nvidia GeForce RTX 2080 Ti VRAM: 11 GBTest CPU: AMD Ryzen 9 5950XSystem RAM: 4 × 8 GB G.Skill TridentZ, DDR4-3600 16-16-16-32-1T, optimierte Sekundär-Timings, Single-RankOS: Windows 10 20H2Graphics API: DirectX 12Driver: 461.40Resizable BAR: disabled | 46.8 FPS Base GPU test: AMD Radeon RX 6800 VRAM: 16 GBTest CPU: AMD Ryzen 9 5950XSystem RAM: 4 × 8 GB G.Skill TridentZ, DDR4-3600 16-16-16-32-1T, optimierte Sekundär-Timings, Single-RankOS: Windows 10 20H2Graphics API: VulkanDriver: 21.1.1Resizable BAR: enabled | Complete test conditions unreported |
| Gaming suite 2021 / Serious Sam 4 / 1920x1080 / Ultra-Preset, maximierte GPU-Speed-Einstellungen / Rendering unreported | 75.9 FPS Base GPU test: Nvidia GeForce RTX 2080 Ti VRAM: 11 GBTest CPU: AMD Ryzen 9 5950XSystem RAM: 4 × 8 GB G.Skill TridentZ, DDR4-3600 16-16-16-32-1T, optimierte Sekundär-Timings, Single-RankOS: Windows 10 20H2Graphics API: VulkanDriver: 461.40Resizable BAR: disabled | 77.2 FPS Base GPU test: AMD Radeon RX 6800 VRAM: 16 GBTest CPU: AMD Ryzen 9 5950XSystem RAM: 4 × 8 GB G.Skill TridentZ, DDR4-3600 16-16-16-32-1T, optimierte Sekundär-Timings, Single-RankOS: Windows 10 20H2Graphics API: VulkanDriver: 21.1.1Resizable BAR: enabled | Complete test conditions unreported |
| Gaming suite 2021 / Serious Sam 4 / 2560x1440 / Ultra-Preset, maximierte GPU-Speed-Einstellungen / Rendering unreported | 65 FPS Base GPU test: Nvidia GeForce RTX 2080 Ti VRAM: 11 GBTest CPU: AMD Ryzen 9 5950XSystem RAM: 4 × 8 GB G.Skill TridentZ, DDR4-3600 16-16-16-32-1T, optimierte Sekundär-Timings, Single-RankOS: Windows 10 20H2Graphics API: VulkanDriver: 461.40Resizable BAR: disabled | 70.3 FPS Base GPU test: AMD Radeon RX 6800 VRAM: 16 GBTest CPU: AMD Ryzen 9 5950XSystem RAM: 4 × 8 GB G.Skill TridentZ, DDR4-3600 16-16-16-32-1T, optimierte Sekundär-Timings, Single-RankOS: Windows 10 20H2Graphics API: VulkanDriver: 21.1.1Resizable BAR: enabled | Complete test conditions unreported |
| Gaming suite 2021 / Serious Sam 4 / 3840x2160 / Ultra-Preset, 16×AF / Rendering unreported | 57.7 FPS Base GPU test: Nvidia GeForce RTX 2080 Ti VRAM: 11 GBTest CPU: AMD Ryzen 9 5950XSystem RAM: 4 × 8 GB G.Skill TridentZ, DDR4-3600 16-16-16-32-1T, optimierte Sekundär-Timings, Single-RankOS: Windows 10 20H2Graphics API: VulkanDriver: 461.40Resizable BAR: disabled | 72 FPS Base GPU test: AMD Radeon RX 6800 VRAM: 16 GBTest CPU: AMD Ryzen 9 5950XSystem RAM: 4 × 8 GB G.Skill TridentZ, DDR4-3600 16-16-16-32-1T, optimierte Sekundär-Timings, Single-RankOS: Windows 10 20H2Graphics API: VulkanDriver: 21.1.1Resizable BAR: enabled | Complete test conditions unreported |
| Gaming suite 2021 / Star Wars: Squadrons / 1920x1080 / 125 % Auflösung, Ultra-Preset, Umgebungsverdeckung Ultra / 125% / RT off | 183.5 FPS Base GPU test: Nvidia GeForce RTX 2080 Ti VRAM: 11 GBTest CPU: AMD Ryzen 9 5950XSystem RAM: 4 × 8 GB G.Skill TridentZ, DDR4-3600 16-16-16-32-1T, optimierte Sekundär-Timings, Single-RankOS: Windows 10 20H2Graphics API: DirectX 12Driver: 461.40Resizable BAR: disabled | 218.3 FPS Base GPU test: AMD Radeon RX 6800 VRAM: 16 GBTest CPU: AMD Ryzen 9 5950XSystem RAM: 4 × 8 GB G.Skill TridentZ, DDR4-3600 16-16-16-32-1T, optimierte Sekundär-Timings, Single-RankOS: Windows 10 20H2Graphics API: DirectX 12Driver: 21.1.1Resizable BAR: enabled | Complete test conditions unreported |
| Gaming suite 2021 / Star Wars: Squadrons / 2560x1440 / 125 % Auflösung, Ultra-Preset, Umgebungsverdeckung Ultra / 125% / RT off | 131.3 FPS Base GPU test: Nvidia GeForce RTX 2080 Ti VRAM: 11 GBTest CPU: AMD Ryzen 9 5950XSystem RAM: 4 × 8 GB G.Skill TridentZ, DDR4-3600 16-16-16-32-1T, optimierte Sekundär-Timings, Single-RankOS: Windows 10 20H2Graphics API: DirectX 12Driver: 461.40Resizable BAR: disabled | 152.3 FPS Base GPU test: AMD Radeon RX 6800 VRAM: 16 GBTest CPU: AMD Ryzen 9 5950XSystem RAM: 4 × 8 GB G.Skill TridentZ, DDR4-3600 16-16-16-32-1T, optimierte Sekundär-Timings, Single-RankOS: Windows 10 20H2Graphics API: DirectX 12Driver: 21.1.1Resizable BAR: enabled | Complete test conditions unreported |
| Gaming suite 2021 / Star Wars: Squadrons / 3840x2160 / 125 % Auflösung, Ultra-Preset, Umgebungsverdeckung Ultra / 125% / RT off | 75.1 FPS Base GPU test: Nvidia GeForce RTX 2080 Ti VRAM: 11 GBTest CPU: AMD Ryzen 9 5950XSystem RAM: 4 × 8 GB G.Skill TridentZ, DDR4-3600 16-16-16-32-1T, optimierte Sekundär-Timings, Single-RankOS: Windows 10 20H2Graphics API: DirectX 12Driver: 461.40Resizable BAR: disabled | 80.4 FPS Base GPU test: AMD Radeon RX 6800 VRAM: 16 GBTest CPU: AMD Ryzen 9 5950XSystem RAM: 4 × 8 GB G.Skill TridentZ, DDR4-3600 16-16-16-32-1T, optimierte Sekundär-Timings, Single-RankOS: Windows 10 20H2Graphics API: DirectX 12Driver: 21.1.1Resizable BAR: enabled | Complete test conditions unreported |
| Gaming suite 2021 / Watch Dogs: Legion / 1920x1080 / Ultra-Preset / Rendering unreported | 70.5 FPS Base GPU test: Nvidia GeForce RTX 2080 Ti VRAM: 11 GBTest CPU: AMD Ryzen 9 5950XSystem RAM: 4 × 8 GB G.Skill TridentZ, DDR4-3600 16-16-16-32-1T, optimierte Sekundär-Timings, Single-RankOS: Windows 10 20H2Graphics API: DirectX 12Driver: 461.40Resizable BAR: disabled | 91.6 FPS Base GPU test: AMD Radeon RX 6800 VRAM: 16 GBTest CPU: AMD Ryzen 9 5950XSystem RAM: 4 × 8 GB G.Skill TridentZ, DDR4-3600 16-16-16-32-1T, optimierte Sekundär-Timings, Single-RankOS: Windows 10 20H2Graphics API: DirectX 12Driver: 21.1.1Resizable BAR: enabled | Complete test conditions unreported |
| Gaming suite 2021 / Watch Dogs: Legion / 2560x1440 / Ultra-Preset / Rendering unreported | 57.6 FPS Base GPU test: Nvidia GeForce RTX 2080 Ti VRAM: 11 GBTest CPU: AMD Ryzen 9 5950XSystem RAM: 4 × 8 GB G.Skill TridentZ, DDR4-3600 16-16-16-32-1T, optimierte Sekundär-Timings, Single-RankOS: Windows 10 20H2Graphics API: DirectX 12Driver: 461.40Resizable BAR: disabled | 71.7 FPS Base GPU test: AMD Radeon RX 6800 VRAM: 16 GBTest CPU: AMD Ryzen 9 5950XSystem RAM: 4 × 8 GB G.Skill TridentZ, DDR4-3600 16-16-16-32-1T, optimierte Sekundär-Timings, Single-RankOS: Windows 10 20H2Graphics API: DirectX 12Driver: 21.1.1Resizable BAR: enabled | Complete test conditions unreported |
| Gaming suite 2021 / Watch Dogs: Legion / 3840x2160 / Ultra-Preset / Rendering unreported | 38.2 FPS Base GPU test: Nvidia GeForce RTX 2080 Ti VRAM: 11 GBTest CPU: AMD Ryzen 9 5950XSystem RAM: 4 × 8 GB G.Skill TridentZ, DDR4-3600 16-16-16-32-1T, optimierte Sekundär-Timings, Single-RankOS: Windows 10 20H2Graphics API: DirectX 12Driver: 461.40Resizable BAR: disabled | 43.9 FPS Base GPU test: AMD Radeon RX 6800 VRAM: 16 GBTest CPU: AMD Ryzen 9 5950XSystem RAM: 4 × 8 GB G.Skill TridentZ, DDR4-3600 16-16-16-32-1T, optimierte Sekundär-Timings, Single-RankOS: Windows 10 20H2Graphics API: DirectX 12Driver: 21.1.1Resizable BAR: enabled | Complete test conditions unreported |
¹ Difference of the second result relative to the first in that row. No percentage is calculated for different upscaling algorithms. This compares published results, not a universal performance index.
A base GPU test is a reference for cards using that GPU and the same memory capacity. Board overclocking, cooling and power limits can change the result.
These results have no shared test of both models with the same version and settings. They are shown separately without a percentage difference.
Based on the results of several popular benchmarks, you can more accurately estimate the performance difference between GALAX GeForce RTX 2080 Ti and AMD Radeon RX 6800.
Compare synthetic benchmarks and choose the best graphics card for you!
These are saved results from the earlier catalog. Measurement dates and test configurations were not recorded. Models with no comparable results are omitted.
Recent models: test results with identified primary sources — Game frame rates
Archived results. The original measurement method and test conditions have not been verified.
Higher values are better in this metric.
Higher values are better in this metric.
Higher values are better in this metric.
Higher values are better in this metric.
Higher values are better in this metric.
Higher values are better in this metric.
Higher values are better in this metric.
Higher values are better in this metric.


 Russian
 German
 Portuguese
 Italian
 French
 Japan
Japan Spanish
 Polish
 Chinese
 Korean