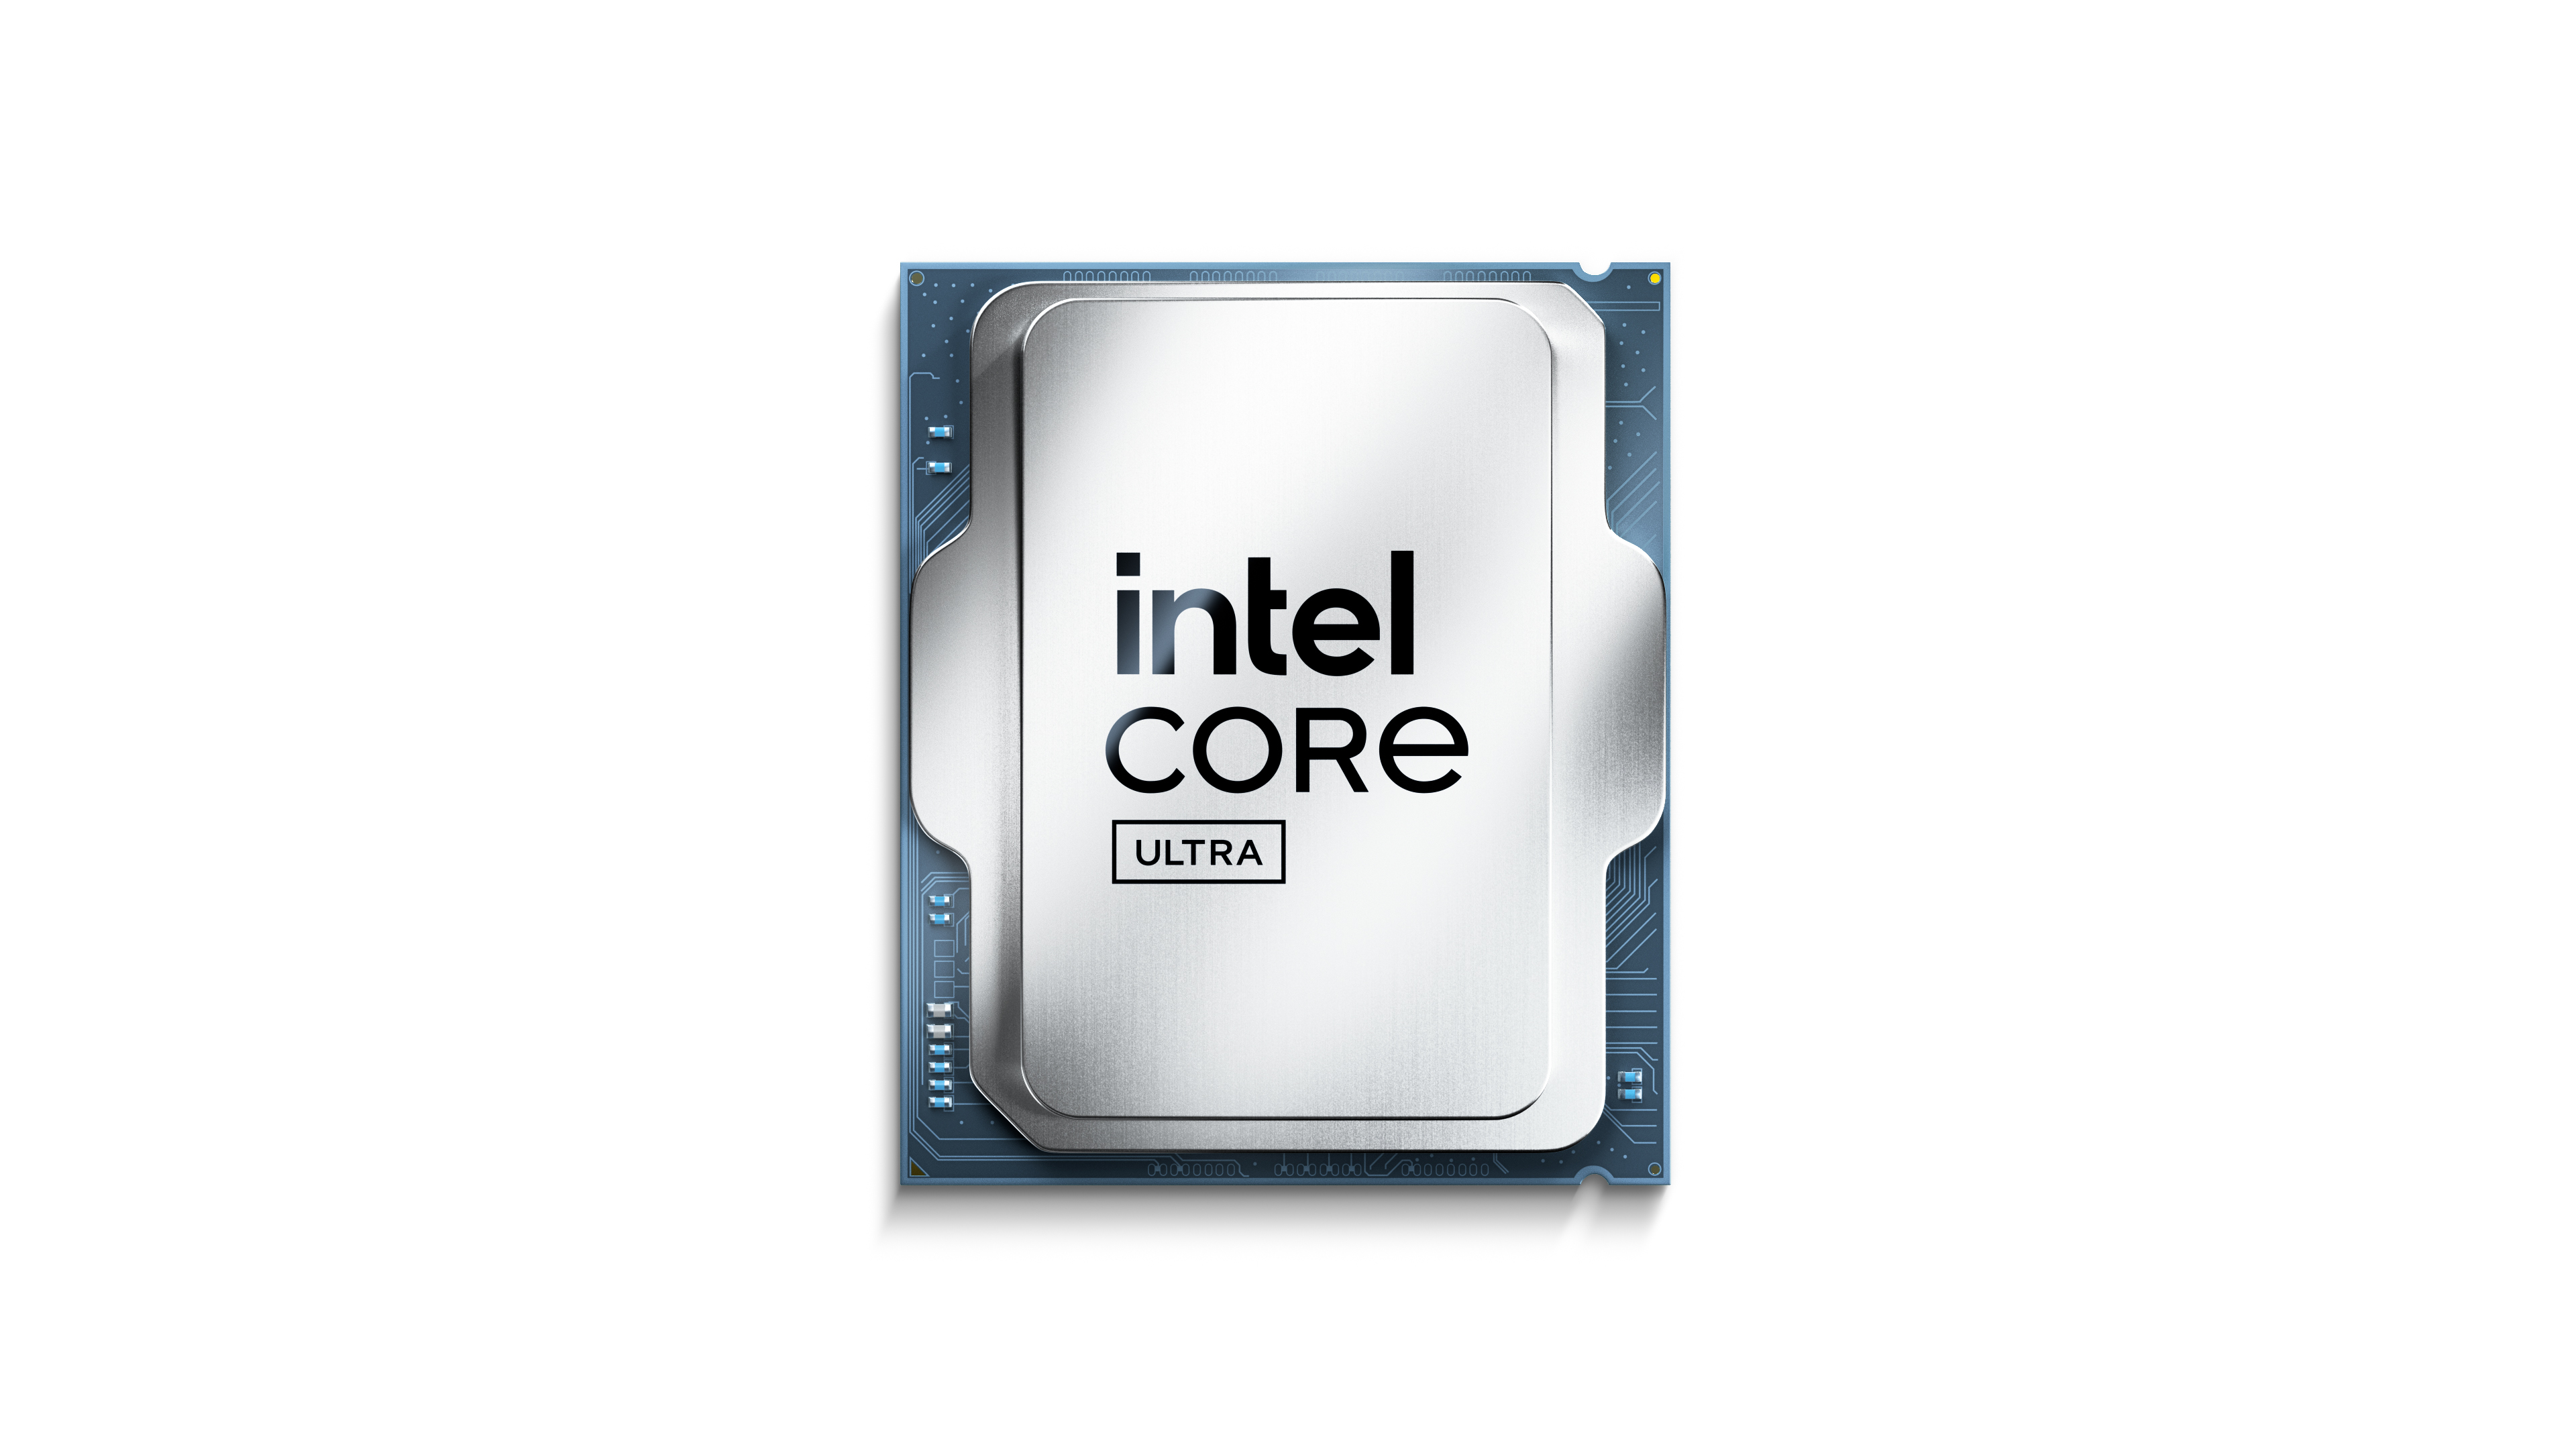


What's the best choice Intel Core i9-13950HX or Intel Core i9-13900KS? Which processor is faster?
We have prepared a comparison to help you choose the best processor. Compare their specifications and benchmarks.
Intel Core i9-13950HX has a base frequency of 2.20 GHz (5.50 GHz). 24 / 32 CPU Cores / Threads. Stated TDP / base power 55 W. Released in Q1/2023.
Intel Core i9-13900KS has a base frequency of 3.20 GHz (6.00 GHz). 24 / 32 CPU Cores / Threads. Stated TDP / base power 150 W. Released in Q1/2023.
Reasons to consider Place in the overall ranking
(based on several benchmarks)
 place
Lower stated TDP / base power
Power limits alone do not measure performance per watt.
 150 W
Common positions Intel Core i9-13950HX CPU in popular benchmarks, for comparison with other models.
Reasons to consider Place in the overall ranking
(based on several benchmarks)
place
Common positions Intel Core i9-13900KS CPU in popular benchmarks, for comparison with other models.
Intel Core i9-13950HX
Background information about the processors being compared, series, generation and market segment.
 Intel Core i 13000
Intel Core i9
13
Intel Core i9-12900KS
Desktop / Server
Core counts, threads, cache and clock modes describe the CPU configuration. Performance depends on the workload and comparable measured results.
8x Raptor Cove
3.20 GHz (6.00 GHz)
16x Gracemont
2.20 GHz (4.30 GHz)
hybrid (big.LITTLE)
24
32
Yes
Yes
Internal Graphics does not affect the performance of the CPU, performs the work of the graphics card in its absence or on mobile devices.
12
32
11
300 MHz
Intel UHD Graphics 770
1650 MHz
3
64 GB
Q4/2021
256
10 nm
Built-in codecs used to encode and decode content. Significantly speeds up the required operations.
Decode
Decode / Encode
Decode / Encode
Decode / Encode
Decode / Encode
Decode
Decode / Encode
Decode / Encode
Types, channel quantity of RAM supported by Intel Core i9-13900KS and Intel Core i9-13950HX. Depending on the motherboards, higher or lower memory frequencies may be supported.
Yes
128 GB
89.6 GB/s
2 (Dual Channel)
DDR4-3200DDR5-5600
5.0 x 20
Yes
Compare the TDP requirements of TDP Intel Core i9-13950HX and Intel Core i9-13900KS Power specifications describe different manufacturer limits. TDP, base power and maximum turbo power are separate values; they do not establish measured system consumption.
100 °C
-
253 W
-
-
150 W
Architecture, interfaces, additional instructions supported by Intel Core i9-13950HX and Intel Core i9-13900KS, virtual machine technologies and process technology.
Raptor Lake S
Monolithic
-
x86-64 (64 bit)
SSE4.1, SSE4.2, AVX2, AVX2+
32 MB
36 MB
Windows 10, Windows 11, Linux
Q1/2023
LGA 1700
10 nm
VT-x, VT-x EPT, VT-d
Shared tests with results for both models: 6
Each row uses one Blender version, operating system and compute backend.
| Test and settings | Intel Core i9-13950HX | Intel Core i9-13900KS | Result difference¹ |
|---|---|---|---|
| Blender 4.5.0 / CPU / Windows | 338.349028 samples/min Submissions: 22 | 505.291001 samples/min Submissions: 11 | +49.3 % |
| Blender 4.4.0 / CPU / Windows | 320.534152 samples/min Submissions: 6 | 501.885652 samples/min Submissions: 13 | +56.6 % |
| Blender 4.3.0 / CPU / Windows | 317.353929 samples/min Submissions: 14 | 475.468961 samples/min Submissions: 11 | +49.8 % |
| Blender 4.2.0 / CPU / Windows | 324.935775 samples/min Submissions: 22 | 495.190602 samples/min Submissions: 19 | +52.4 % |
| Blender 4.1.0 / CPU / Windows | 240.972801 samples/min Submissions: 14 | 425.924975 samples/min Submissions: 8 | +76.8 % |
| Blender 4.0.0 / CPU / Windows | 310.489237 samples/min Submissions: 30 | 518.577746 samples/min Submissions: 19 | +67.0 % |
¹ Difference of the second result relative to the first in that row. No percentage is calculated for different upscaling algorithms. This compares published results, not a universal performance index.
These results have no shared test of both models with the same version and settings. They are shown separately without a percentage difference.
Results were obtained on the reported systems. Test versions and settings remain separate; incomplete conditions do not support calculated model performance differences.
| Model | Result | Reported conditions |
|---|---|---|
| Intel Core i9-13900KS | 4992.087541 H/s | RandomX / XMRig 6.22.2 / 1M / 32 threads / windows System RAM: 32 GB OS: Windows NT 10.0 Motherboard: ASRock / Z690 Extreme Duration: 200.317 s User-submitted run; tuning and power settings are incomplete. |
| Model | Result | Reported conditions |
|---|---|---|
| Intel Core i9-13950HX | 10297.282547 H/s | RandomX / XMRig 6.21.1 / 1M / 32 threads / windows System RAM: 64 GB OS: Windows NT 10.0 Motherboard: Dell Inc. / 05R4R4 Duration: 97.113 s User-submitted run; tuning and power settings are incomplete. |
Based on the results of several benchmarks, you can more accurately estimate the difference in performance between Intel Core i9-13950HX and Intel Core i9-13900KS.
Compare the synthetic test values and choose the best processor!
These are saved results from the earlier catalog. Measurement dates and test configurations were not recorded. Models with no comparable results are omitted.
Recent models: test results with identified primary sources — Cinebench R23 · Cinebench R20 · Cinebench R15 · Cinebench 2026 · RandomX benchmark
Higher values are better in this metric.
Higher values are better in this metric.
Higher values are better in this metric.
Higher values are better in this metric.
Higher values are better in this metric.


 Russian
 German
 Portuguese
 Italian
 French
 Japan
 Spanish
 Polish
 Chinese
 Korean