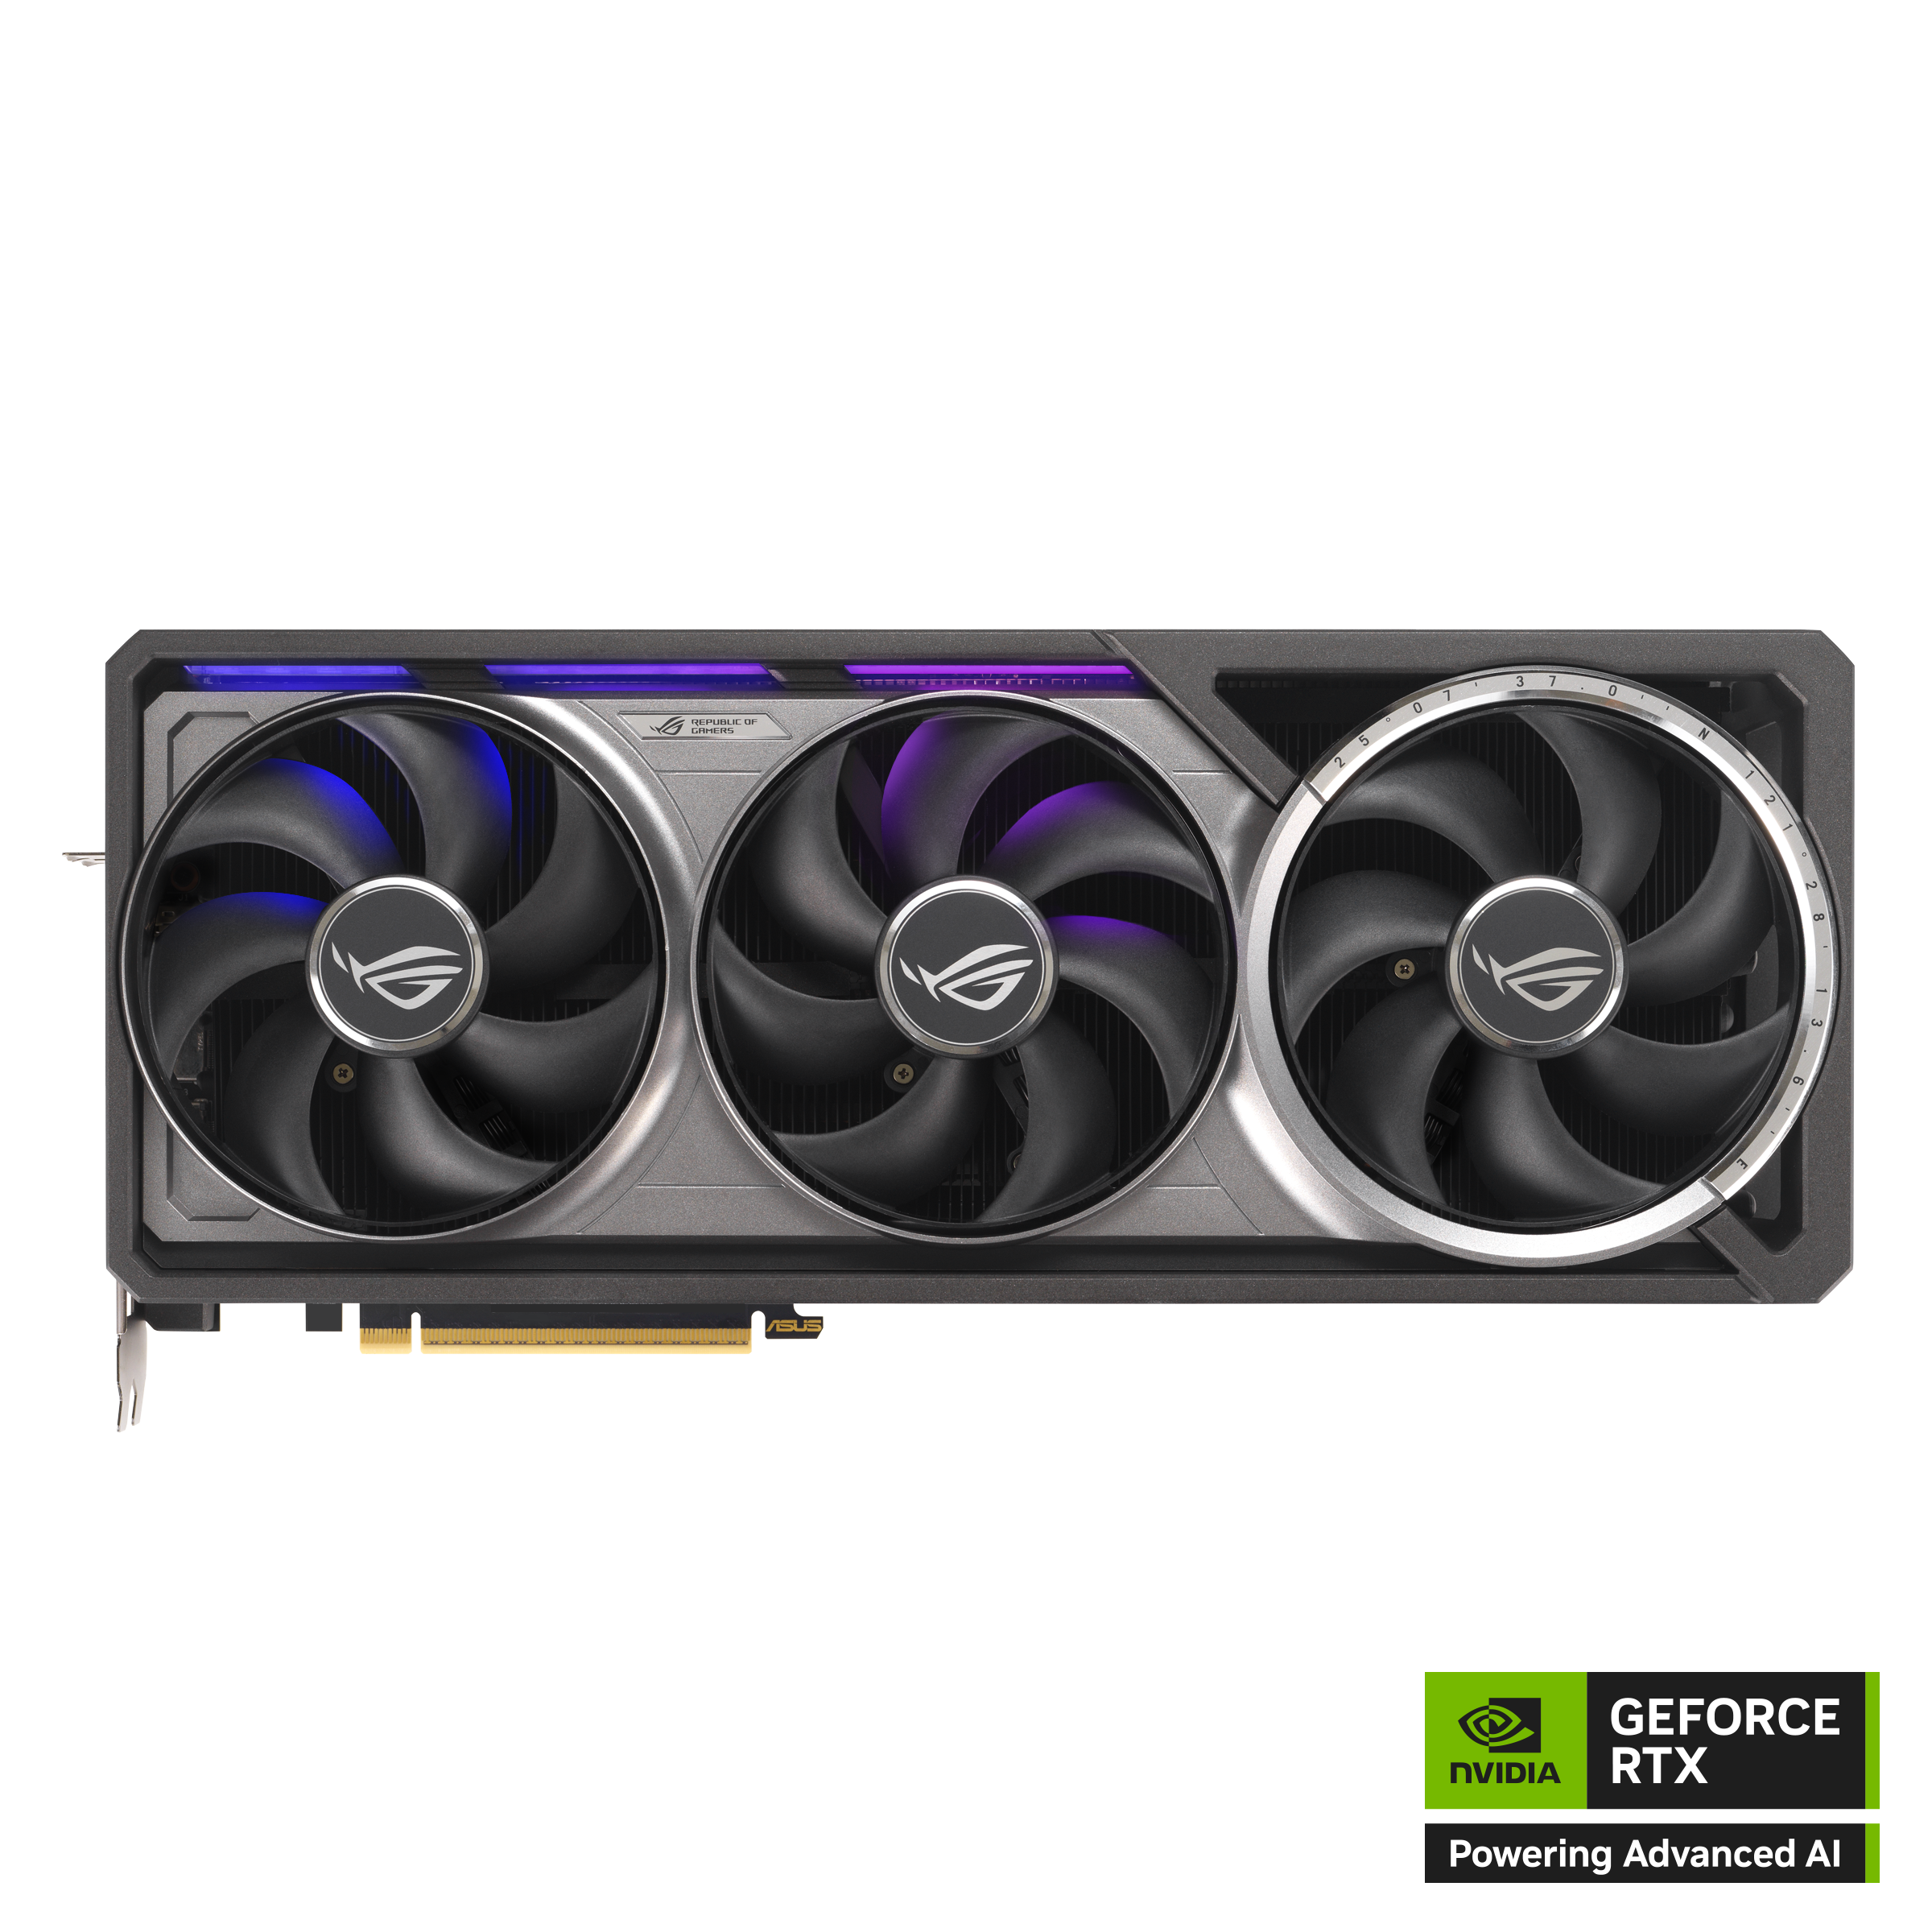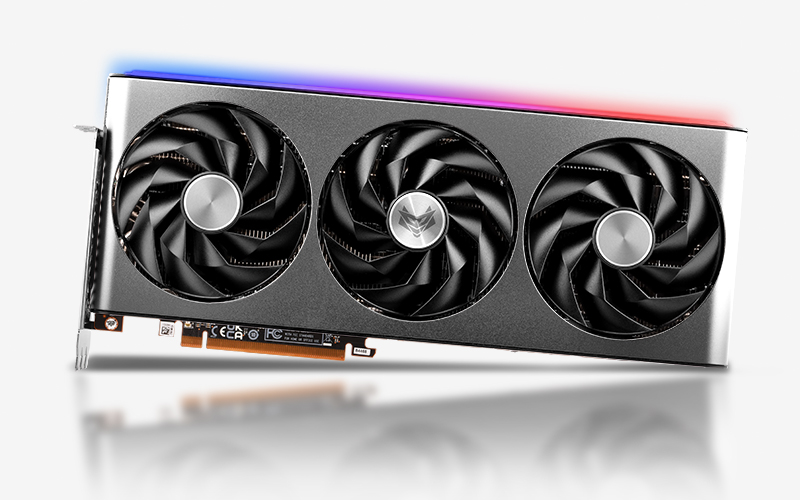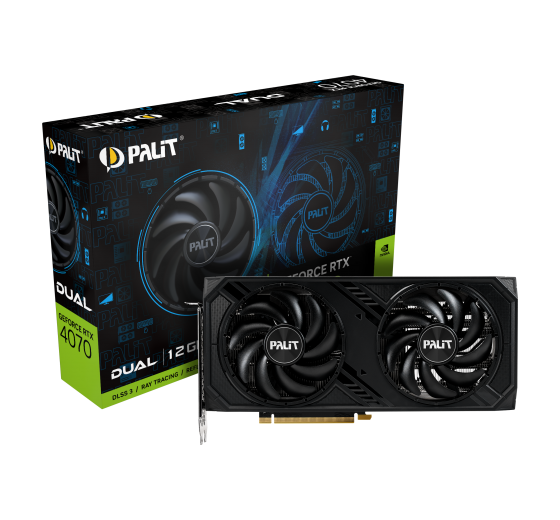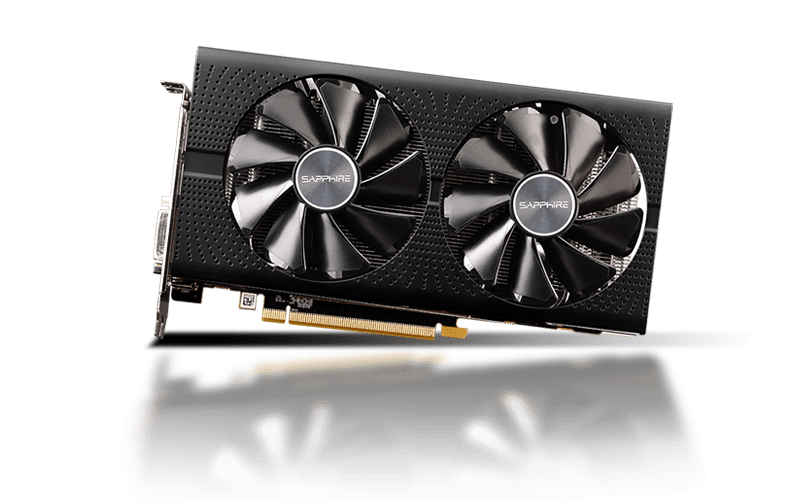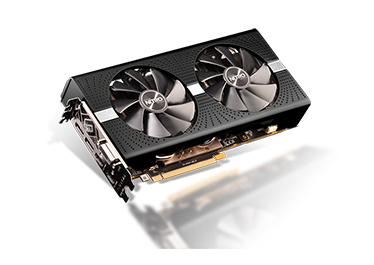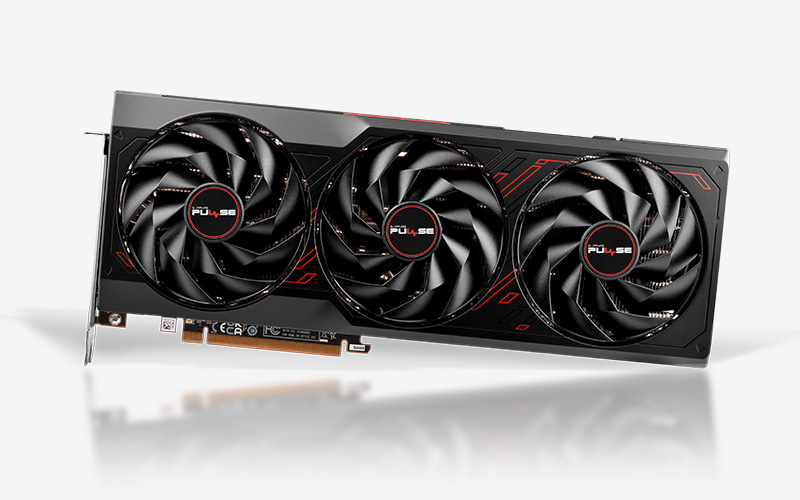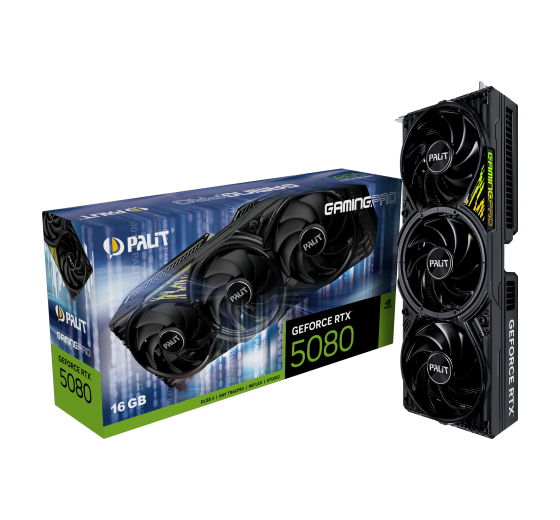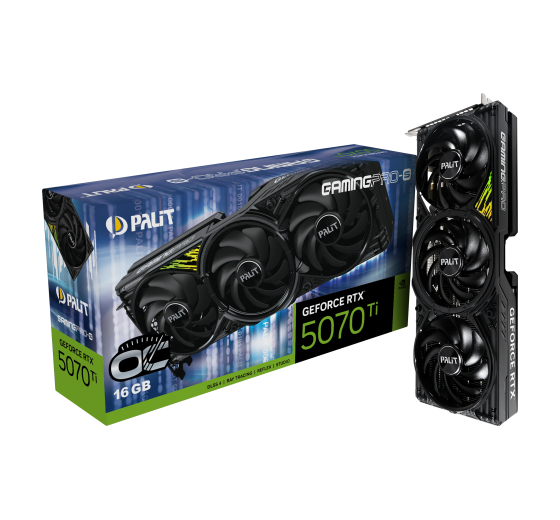

Qual é a melhor escolha MSI GeForce RTX 2060 SUPER VENTUS GP OC ou ZOTAC GAMING GeForce RTX 2080 AMP Extreme? Qual é a placa gráfica mais rápida?
Preparámos uma comparação para o ajudar a escolher a melhor placa gráfica. Comparar as suas especificações e padrões de referência.
MSI GeForce RTX 2060 SUPER VENTUS GP OC has a base frequency of 1.470 GHz. Tamanho da memória 8 GB. Tipo de memória GDDR6. Lançado em Q3/2019.
ZOTAC GAMING GeForce RTX 2080 AMP Extreme has a base frequency of 1.515 GHz. Tamanho da memória 8 GB. Tipo de memória GDDR6. Lançado em Q3/2018.
Razões a considerar Lugar na classificação geral
(com base em vários pontos de referência)
 lugar
lugar
Posições comuns MSI GeForce RTX 2060 SUPER VENTUS GP OC GPU em referências populares, para comparação com outros modelos.
Razões a considerar Lugar na classificação geral
(com base em vários pontos de referência)
lugar
Maior velocidade do relógio
Por volta de 3% melhor velocidade do relógio
 1.470 GHz
Posições comuns ZOTAC GAMING GeForce RTX 2080 AMP Extreme GPU em referências populares, para comparação com outros modelos.
MSI GeForce RTX 2060 SUPER VENTUS GP OC
Comparação dos dados técnicos básicos das placas gráficas MSI GeForce RTX 2060 SUPER VENTUS GP OC e ZOTAC GAMING GeForce RTX 2080 AMP Extreme, chip, unidades de processamento de informação.
 NVIDIA GeForce RTX 2080
46
TU104
64
2944
184
NVIDIA GeForce RTX 2080
46
TU104
64
2944
184
Video memory capacity, type, bus width and bandwidth describe different properties. These values alone do not determine graphics performance.
448 GB/s
256 bit
8 GB
1750 MHz
GDDR6
Published GPU clock frequencies describe different operating modes. Clock speed alone does not determine graphics performance.
1515 MHz
1905 MHz + 11%
1710 MHz
Sim
Graphics card power limits and recommended system power supply describe different specifications.
89 °C
280 W+ 30 %
-
Tipos e tamanhos de refrigeradores para sistema de arrefecimento de placas gráficas MSI GeForce RTX 2060 SUPER VENTUS GP OC e ZOTAC GAMING GeForce RTX 2080 AMP Extreme.
Air cooling
Axial
3 x 90 mm
-
-
-
Conectividade e ligações.
3 × DisplayPort 1.4a
-
2.2
1 × HDMI 2.0b
4
PCIe 3.0 x16
2 x 8-Pin
1 × USB-C
-
Dados técnicos que são utilizados em todo o seu potencial em jogos de computador.
12_2
Sim
ZOTAC SPECTRA
7680 × 4320
Sim
Suporte incorporado para padrões de compressão de vídeo e imagem.
Não
Decode / Encode
Decode / Encode
Decode
Decode
A diferença em tamanho, peso e ranhura dos dispositivos comparados
136 mm
324 mm
3 PCIe-Slots
-
59 mm
Comparação de interfaces e datas de lançamento para GPU ZOTAC GAMING GeForce RTX 2080 AMP Extreme e MSI GeForce RTX 2060 SUPER VENTUS GP OC.
data sheet
-
ZT-T20800B-10P
12 nm
Q3/2018
Shared tests with results for both models: 2
Each row is a separate graphics subtest. Scores are not game FPS.
| Test and settings | MSI GeForce RTX 2060 SUPER VENTUS GP OC | ZOTAC GAMING GeForce RTX 2080 AMP Extreme | Result difference¹ |
|---|---|---|---|
| 3DMark – Steel Nomad — Steel Nomad Score / DirectX 12 | 2011 points Base GPU test: Nvidia GeForce RTX 2060 Super VRAM: 8 GBOS: Windows 11Graphics API: DirectX 12HVCI: enabledApplication version unreported | 2630 points Base GPU test: Nvidia GeForce RTX 2080 VRAM: 8 GBOS: Windows 11Graphics API: DirectX 12HVCI: enabledApplication version unreported | +30.8 % |
| 3DMark – Time Spy — Graphics Score / DirectX 12 | 8744 points Base GPU test: Nvidia GeForce RTX 2060 Super VRAM: 8 GBTest CPU: AMD Ryzen 9 7950X3DOS: Windows 11Graphics API: DirectX 12HVCI: enabledApplication version unreported | 11061 points Base GPU test: Nvidia GeForce RTX 2080 VRAM: 8 GBTest CPU: AMD Ryzen 9 7950X3DOS: Windows 11Graphics API: DirectX 12HVCI: enabledApplication version unreported | +26.5 % |
¹ Difference of the second result relative to the first in that row. No percentage is calculated for different upscaling algorithms. This compares published results, not a universal performance index.
A base GPU test is a reference for cards using that GPU and the same memory capacity. Board overclocking, cooling and power limits can change the result.
These results have no shared test of both models with the same version and settings. They are shown separately without a percentage difference.
Com base nos resultados de vários benchmarks populares, é possível estimar com maior precisão a diferença de desempenho entre MSI GeForce RTX 2060 SUPER VENTUS GP OC e ZOTAC GAMING GeForce RTX 2080 AMP Extreme.
Compare as referências sintéticas e escolha a melhor placa gráfica para si!
These are saved results from the earlier catalog. Measurement dates and test configurations were not recorded. Models with no comparable results are omitted.
Recent models: test results with identified primary sources — Game frame rates
Archived results. The original measurement method and test conditions have not been verified.
Higher values are better in this metric.
Higher values are better in this metric.
Higher values are better in this metric.
Higher values are better in this metric.
Higher values are better in this metric.
Higher values are better in this metric.
Higher values are better in this metric.


 English
 Russian
 German
 Italian
 French
 Japan
Japan Spanish
 Polish
 Chinese
 Korean