Intel Celeron G3930
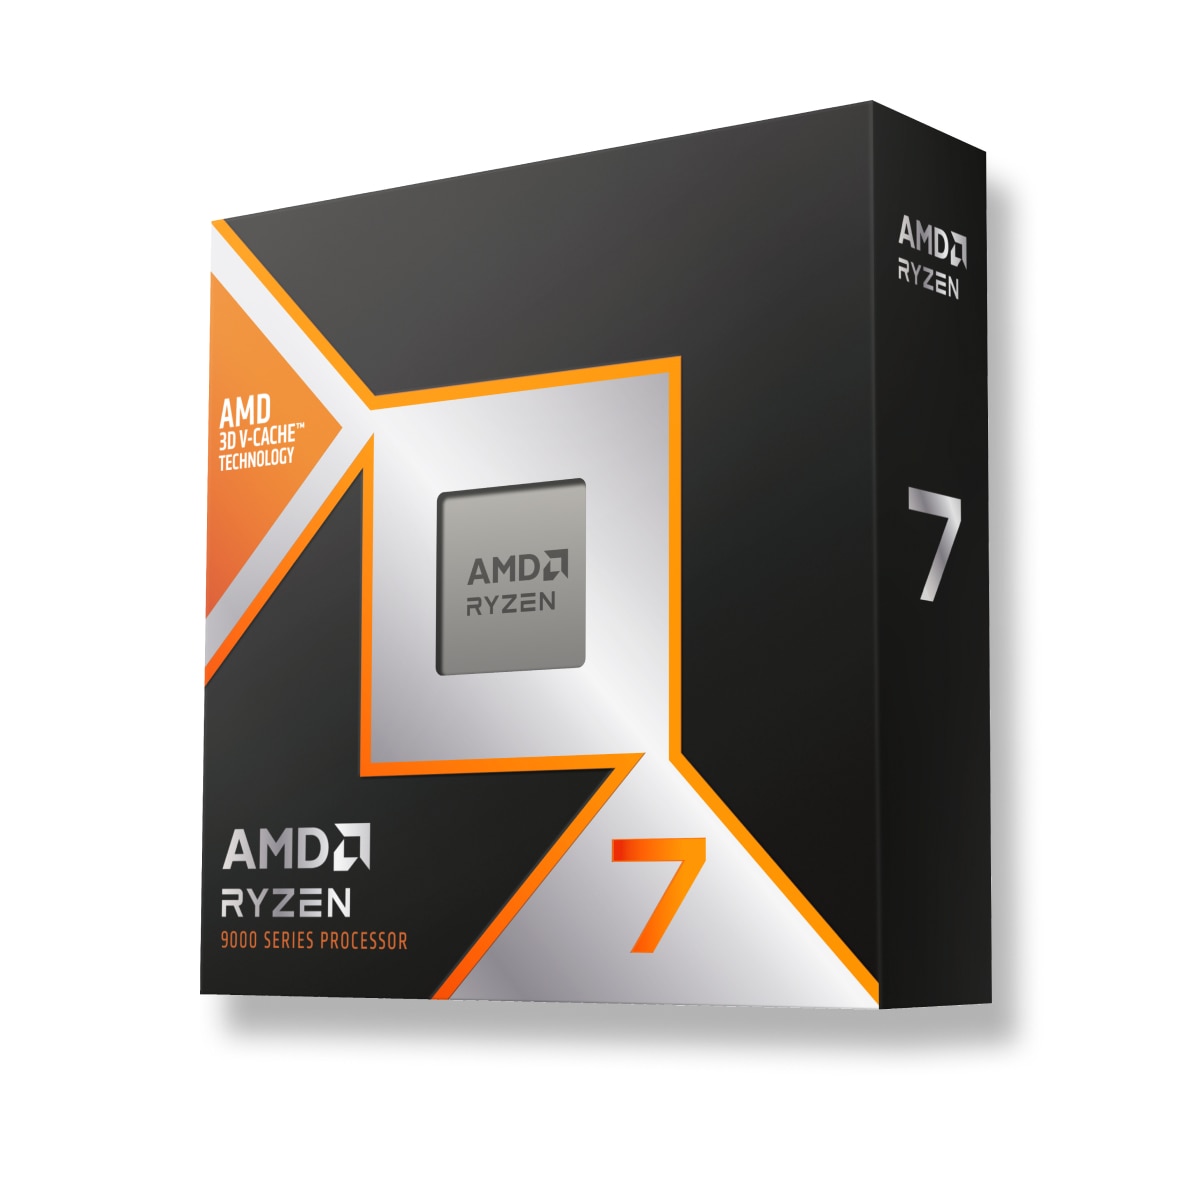
AMD Ryzen 3 3200G
Wybierz kartę graficzną 1
Wybierz kartę graficzną 2

Intel Celeron G3930 kontra AMD Ryzen 3 3200G. Specyfikacje, wydajność, testy

User rating
star star star star star
Wydany
Q1/2017
Intel Celeron G3930
Intel Celeron G3930
Wydany
Q2/2019
User rating
star star star star star
AMD Ryzen 3 3200G
AMD Ryzen 3 3200G

Jaki jest najlepszy wybór Intel Celeron G3930 lub AMD Ryzen 3 3200G? Który procesor jest szybszy?

Przygotowaliśmy porównanie, które pomoże Ci wybrać najlepszy procesor. Porównaj ich specyfikacje i benchmarki.

Intel Celeron G3930 has a base frequency of 2.90 GHz. 2 CPU Cores / Threads. Stated TDP / base power 51 W. Wydany w Q1/2017.

AMD Ryzen 3 3200G has a base frequency of 3.60 GHz. 4 CPU Cores / Threads. Stated TDP / base power 65 W. Wydany w Q2/2019.

Różnice

  • Lower stated TDP / base power

    Power limits alone do not measure performance per watt.

    51 W left arrow 65 W

Pozycje we wszystkich rankingach

Wspólne stanowiska Intel Celeron G3930 Procesor w popularnych benchmarkach, dla porównania z innymi modelami.

  • Cinebench R15 (Single-Core)
    667 place
  • Cinebench R15 (Multi-Core)
    849 place
  • Geekbench 5, 64bit (Single-Core)
    788 place
  • Geekbench 5, 64bit (Multi-Core)
    969 place
  • iGPU - FP32 Performance (Single-precision GFLOPS)
    1268 place
  • Geekbench 3, 64bit (Single-Core)
    480 place
  • Geekbench 3, 64bit (Multi-Core)
    610 place
  • Cinebench R11.5, 64bit (Single-Core)
    430 place
  • Cinebench R11.5, 64bit (Multi-Core)
    583 place
  • Cinebench R11.5, 64bit (iGPU, OpenGL)
    204 place
  • Estimated results for PassMark CPU Mark
    857 place
AMD Ryzen 3 3200G Powody do rozważenia
AMD Ryzen 3 3200G
Zgłoś błąd
  • Wyższa prędkość zegara

    Wokół 24% lepsza prędkość zegara

    3.60 GHz left arrow 2.90 GHz
  • Większa liczba rdzeni

    2 more cores

    4 left arrow 2

Pozycje we wszystkich rankingach

Wspólne stanowiska AMD Ryzen 3 3200G Procesor w popularnych benchmarkach, dla porównania z innymi modelami.

  • Cinebench R20 (Single-Core)
    304 place
  • Cinebench R20 (Multi-Core)
    323 place
  • Cinebench R15 (Single-Core)
    370 place
  • Cinebench R15 (Multi-Core)
    484 place
  • Geekbench 5, 64bit (Single-Core)
    528 place
  • Geekbench 5, 64bit (Multi-Core)
    599 place
  • iGPU - FP32 Performance (Single-precision GFLOPS)
    220 place
  • Estimated results for PassMark CPU Mark
    515 place

Specyfikacje

Dane techniczne
Intel Celeron G3930 Intel Celeron G3930
AMD Ryzen 3 3200G AMD Ryzen 3 3200G
Rodzina i grupa CPU

Informacje ogólne o porównywanych procesorach, serii, generacji i segmencie rynku.

  • Grupa CPU
    Intel Celeron G3000 left arrow AMD Ryzen 3000G
  • Seria
    Intel Celeron left arrow AMD Ryzen
  • Pokolenie
    6 left arrow 2
  • Segment
    Desktop / Server left arrow Desktop / Server
Specyfikacja techniczna procesora

Core counts, threads, cache and clock modes describe the CPU configuration. Performance depends on the workload and comparable measured results.

  • Base Frequency
    2.9 GHz left arrow 3.6 GHz
  • Architektura podstawowa
    normal left arrow normal
  • Rdzenie CPU
    2 left arrow 4
  • CPU Threads
    2 left arrow 4
  • Hyperthreading / SMT
    Nie left arrow Nie
  • Overclocking
    Nie left arrow Tak
  • Turbo Frequency (1 Core)
    No turbo left arrow 4 GHz
  • Turbo Frequency (2 Cores)
    No turbo left arrow -
  • Turbo Frequency (4 Cores)
    - left arrow 3.8 GHz
IGPU

Internal Graphics nie wpływa na wydajność procesora, wykonuje pracę karty graficznej w przypadku jej braku lub na urządzeniach mobilnych.

  • DirectX Version
    12 left arrow 12
  • Jednostki wykonawcze
    12 left arrow 8
  • Pokolenie
    9.5 left arrow 8
  • GPU Frequency
    350 MHz left arrow 1250 MHz
  • Nazwa procesora graficznego
    Intel HD Graphics 610 left arrow AMD Radeon Vega 8 Graphics
  • GPU Turbo
    1050 MHz left arrow No turbo
  • Max. displays
    3 left arrow 3
  • Max. GPU Memory
    32 GB left arrow 2 GB
  • Data wydania
    Q3/2016 left arrow Q1/2018
  • Shader
    96 left arrow 512
  • Proces technologiczny
    14 nm left arrow 14 nm
Obsługa kodeków sprzętowych

Wbudowane kodeki wykorzystywane do kodowania i dekodowania treści. Znacznie przyspiesza wymagane operacje.

  • AV1
    Nie left arrow Nie
  • H.264 / AVC
    Decode / Encode left arrow Decode / Encode
  • h265 / HEVC (8 bit)
    Decode / Encode left arrow Decode / Encode
  • h265 / HEVC (10 bit)
    Decode / Encode left arrow Decode / Encode
  • JPEG
    Decode / Encode left arrow Decode / Encode
  • VC-1
    Decode left arrow Decode
  • VP8
    Decode / Encode left arrow Decode / Encode
  • VP9
    Decode / Encode left arrow Decode / Encode
Specyfikacja pamięci i PCI

Typy, kanały ilość pamięci RAM obsługiwanych przez AMD Ryzen 3 3200G oraz Intel Celeron G3930. W zależności od płyt głównych mogą być obsługiwane wyższe lub niższe częstotliwości pamięci.

  • ECC
    Tak left arrow Tak
  • Max. Pamięć
    - left arrow 64 GB
  • Kanały pamięci
    2 left arrow 2
  • Typ pamięci
    DDR4-2400 left arrow DDR4-2933
  • Pasma PCIe
    16 left arrow 12
  • Wersja PCIe
    3.0 left arrow 3.0
Szyfrowanie
  • AES-NI
    Tak left arrow Tak
Zużycie energii

Porównaj wymagania TDP Intel Celeron G3930 oraz AMD Ryzen 3 3200G Power specifications describe different manufacturer limits. TDP, base power and maximum turbo power are separate values; they do not establish measured system consumption.

  • Maximum Operating Temperature
    - left arrow 95 °C
  • TDP (PL1, legacy label)
    51 W left arrow 65 W
  • TDP down
    - left arrow 45 W
Technologie i rozszerzenia

Architektura, interfejsy, dodatkowe instrukcje obsługiwane przez Intel Celeron G3930 oraz AMD Ryzen 3 3200G, technologie maszyn wirtualnych i technologie procesowe.

  • Architektura
    Skylake S left arrow Picasso (Zen+)
  • Zestaw instrukcji (ISA)
    x86-64 (64 bit) left arrow x86-64 (64 bit)
  • Rozszerzenia ISA
    SSE4.1, SSE4.2 left arrow SSE4a, SSE4.1, SSE4.2, AVX2, FMA3
  • L3-Cache
    2 MB left arrow 4 MB
  • Data wydania
    Q1/2017 left arrow Q2/2019
  • Gniazdo
    LGA 1151 left arrow AM4
  • Proces technologiczny
    14 nm left arrow 12 nm
  • Wirtualizacja
    VT-x, VT-x EPT, VT-d left arrow AMD-V, SVM

Benchmarki

Badania eksploatacyjne CPUs
Individual model tests

These results have no shared test of both models with the same version and settings. They are shown separately without a percentage difference.

Intel Celeron G3930

AMD Ryzen 3 3200G

Individual system tests

Results were obtained on the reported systems. Test versions and settings remain separate; incomplete conditions do not support calculated model performance differences.

RandomX / XMRig 6.25.0 / 1M / 2 threads / windows

Model ResultReported conditions
AMD Ryzen 3 3200G 1167.598215 H/s RandomX / XMRig 6.25.0 / 1M / 2 threads / windows
System RAM: 16 GB
OS: Windows NT 10.0
Motherboard: BIOSTAR Group / B450MHP
Duration: 856.459 s
User-submitted run; tuning and power settings are incomplete.

Na podstawie wyników kilku benchmarków można dokładniej oszacować różnicę w wydajności między Intel Celeron G3930 oraz AMD Ryzen 3 3200G.

Porównaj wartości testów syntetycznych i wybierz najlepszy procesor!

These are saved results from the earlier catalog. Measurement dates and test configurations were not recorded. Models with no comparable results are omitted.

Recent models: test results with identified primary sources — Cinebench R23 · Cinebench R20 · Cinebench R15 · Cinebench 2026 · RandomX benchmark

Cinebench R15 (Single-Core)
The Cinebench R15 SC stresses the computing modules of a desktop or laptop computer to their limits and accurately determines the key performance parameters of the hardware.

Higher values are better in this metric.

123.000000
Intel Celeron G3930
154.000000
AMD Ryzen 3 3200G
Cinebench R15 (Multi-Core)
Cinebench R15 MC obciąża moduły obliczeniowe komputera stacjonarnego lub laptopa do granic możliwości i precyzyjnie określa kluczowe parametry wydajnościowe sprzętu.

Higher values are better in this metric.

220.000000
Intel Celeron G3930
605.000000
AMD Ryzen 3 3200G
Geekbench 5, 64bit (Single-Core)
Geekbench 5 SC to popularny, wieloplatformowy test wydajności dla procesorów stacjonarnych i mobilnych, które intensywnie wykorzystują pamięć systemową.

Higher values are better in this metric.

686.000000
Intel Celeron G3930
890.000000
AMD Ryzen 3 3200G
Geekbench 5, 64bit (Multi-Core)
Geekbench 5 MC to popularny, wieloplatformowy test wydajności dla procesorów stacjonarnych i mobilnych, które intensywnie wykorzystują pamięć systemową.

Higher values are better in this metric.

1264.000000
Intel Celeron G3930
2900.000000
AMD Ryzen 3 3200G
iGPU - FP32 Performance (Single-precision GFLOPS)
Wydajność iGPU - wewnętrznego procesora graficznego w grach.

Higher values are better in this metric.

202.000000
Intel Celeron G3930
1280.000000
AMD Ryzen 3 3200G
Estimated results for PassMark CPU Mark
PassMark to pakiet testowy, który wykonuje złożone obliczenia matematyczne w celu określenia wydajności procesora przy kompresji plików, szyfrowaniu i zadaniach związanych z fizyką.

Higher values are better in this metric.

3350.000000
Intel Celeron G3930
7925.000000
AMD Ryzen 3 3200G

Najnowsze porównania