Seleziona il processore 1
Seleziona il processore 2
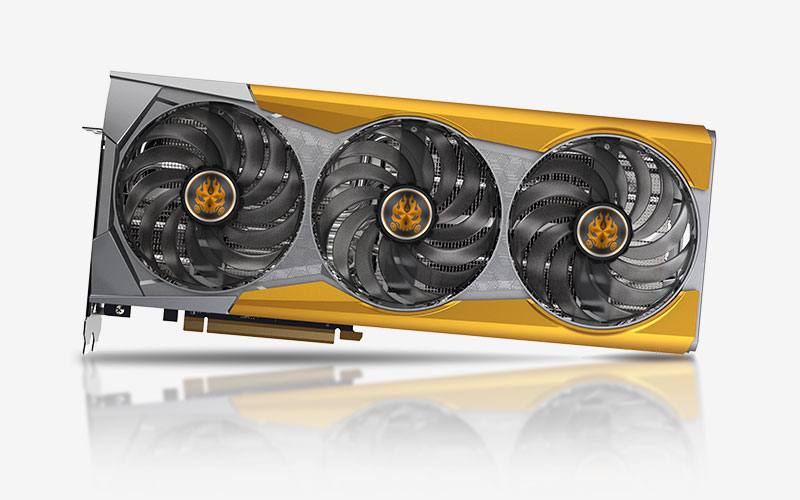
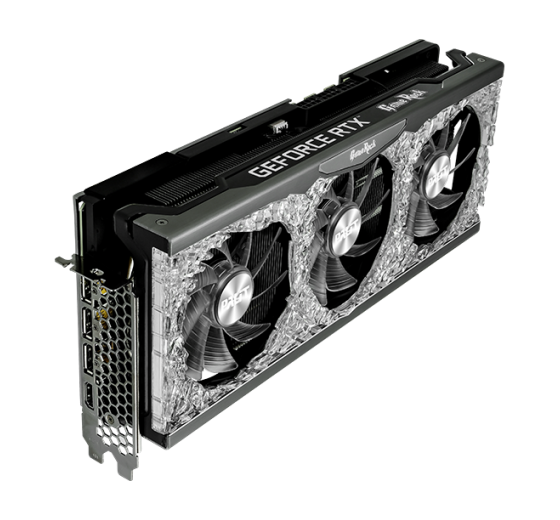
GIGABYTE GeForce RTX 2080 Ti Windforce 11G
NVIDIA TITAN RTX

GIGABYTE GeForce RTX 2080 Ti Windforce 11G contro NVIDIA TITAN RTX. Specifiche, prestazioni, test

User rating
star star star star star
Rilasciato
Q3/2018
GIGABYTE GeForce RTX 2080 Ti Windforce 11G
Rilasciato
Q4/2018
User rating
star star star star star
NVIDIA TITAN RTX
NVIDIA TITAN RTX

Qual è la scelta migliore GIGABYTE GeForce RTX 2080 Ti Windforce 11G o NVIDIA TITAN RTX? Quale scheda grafica è più veloce?

Abbiamo preparato un confronto per aiutarvi a scegliere la migliore scheda grafica. Confrontate le loro specifiche e i loro benchmark.

GIGABYTE GeForce RTX 2080 Ti Windforce 11G has a base frequency of 1.350 GHz. Dimensione della memoria 11 GB. Tipo di memoria GDDR6. Rilasciato in Q3/2018.

NVIDIA TITAN RTX has a base frequency of 1.350 GHz. Dimensione della memoria 24 GB. Tipo di memoria GDDR6. Rilasciato in Q4/2018.

Differenze

  • Posizione nella classifica generale

    (sulla base di diversi parametri di riferimento)

    582 left arrow posto

Posizioni in tutte le classifiche

Posizioni comuni GIGABYTE GeForce RTX 2080 Ti Windforce 11G GPU in benchmark popolari, per un confronto con altri modelli.

  • FP32 Performance (Single-precision TFLOPS)
    903 place
  • 3DMark Benchmark
    655 place
  • Battlefield 5
    648 place
  • Shadow of the Tomb Raider
    564 place
  • Crypto-Mining Ethereum Hashrate (MH/s)
    560 place
  • Crypto-Mining Ergo Hashrate (MH/s)
    811 place
  • Crypto-Mining Ravencoin Hashrate (MH/s)
    381 place
  • Crypto-Mining Vertcoin Hashrate (MH/s)
    433 place
Videokards Motivi da considerare
NVIDIA TITAN RTX
Segnala un bug
  • Più memoria

    118% più memoria

    24 GB left arrow 11 GB

Posizioni in tutte le classifiche

Posizioni comuni NVIDIA TITAN RTX GPU in benchmark popolari, per un confronto con altri modelli.

  • FP32 Performance (Single-precision TFLOPS)
    752 place

Specifiche

Dati tecnici
GIGABYTE GeForce RTX 2080 Ti Windforce 11G GIGABYTE GeForce RTX 2080 Ti Windforce 11G
NVIDIA TITAN RTX NVIDIA TITAN RTX
Informazioni generali

Confronto dei dati tecnici di base delle schede grafiche GIGABYTE GeForce RTX 2080 Ti Windforce 11G e NVIDIA TITAN RTX, chip, unità di elaborazione delle informazioni.

  • Basato su
    NVIDIA GeForce RTX 2080 Ti left arrow NVIDIA TITAN RTX
  • Execution Units
    68 left arrow -
  • Chip GPU
    TU102 left arrow TU102-400-A1
  • Unità di uscita del rendering
    88 left arrow 96
  • Shader
    4352 left arrow 4608
  • Unità di texture
    272 left arrow 288
  • Architettura
    - left arrow Turing
  • RT Cores
    - left arrow 72
  • Streaming Multiprocessors
    - left arrow 72
Impostazioni di memoria

Video memory capacity, type, bus width and bandwidth describe different properties. These values alone do not determine graphics performance.

  • Memory Bandwidth
    616 GB/s left arrow 672 GB/s
  • Memory Bus
    352 bit left arrow 384 bit
  • Dimensione della memoria
    11 GB left arrow 24 GB
  • Memory Speed (legacy frequency label)
    1750 MHz left arrow -
  • Tipo di memoria
    GDDR6 left arrow GDDR6
  • Memory Clock
    - left arrow 1750 MHz
  • Memory Data Rate
    - left arrow 14 Gbps
Frequenza di clock

Published GPU clock frequencies describe different operating modes. Clock speed alone does not determine graphics performance.

  • Frequenza di base
    1350 MHz left arrow 1350 MHz
  • Frequenza massima
    1545 MHz left arrow 1770 MHz
  • Game Clock
    - left arrow -
  • Overclock
    Sì left arrow Sì
Consumo di energia

Graphics card power limits and recommended system power supply describe different specifications.

  • Maximum Junction Temperature
    - left arrow 89 °C
  • TDP
    250 W left arrow 280 W
  • TDP (up)
    320 W left arrow -
Tipo di raffreddatore e ventilatore

Tipi e dimensioni dei dissipatori per il sistema di raffreddamento delle schede grafiche GIGABYTE GeForce RTX 2080 Ti Windforce 11G e NVIDIA TITAN RTX.

  • Cooler-Type
    Air cooling left arrow Air cooling
  • Fan-Type
    Axial left arrow Axial
  • Ventilatore 1
    3 x 80 mm left arrow 2 x 90 mm
  • Ventilatore 2
    - left arrow -
  • Noise (Idle)
    0 dB / Silent left arrow 0 dB / Silent
  • Noise (Load)
    42 dB left arrow -
Interfacce

Connettività e collegamenti.

  • DisplayPort Ports
    3 × DisplayPort 1.4a left arrow 3 × DisplayPort 1.4a
  • Porte DVI
    - left arrow -
  • HDCP Version
    2.2 left arrow -
  • Porte HDMI
    1 × HDMI 2.0b left arrow 1 × HDMI 2.0b
  • Max. Visualizzazioni
    4 left arrow 4
  • PCIe Interface
    PCIe 3.0 x16 left arrow PCIe 3.0 x16
  • Power Connectors
    2 x 8-Pin left arrow 2 x 8-Pin
  • USB-C Ports
    1 × USB-C left arrow 1 × USB-C
  • VGA Ports
    - left arrow -
Dati tecnici

Dati tecnici utilizzati al massimo delle loro potenzialità nei giochi per computer.

  • DirectX
    12_2 left arrow 12_2
  • DLSS / FSR
    Sì left arrow No
  • LED
    No LED lighting left arrow No LED lighting
  • Risoluzione massima
    7680 × 4320 left arrow 7680 × 4320
  • Raytracing
    Sì left arrow Sì
Codec video supportati

Supporto incorporato per gli standard di compressione video e immagine.

  • AV1
    No left arrow No
  • h264
    Decode / Encode left arrow Decode / Encode
  • h265 / HEVC
    Decode / Encode left arrow Decode / Encode
  • VP8
    Decode left arrow Decode / Encode
  • VP9
    Decode left arrow Decode / Encode
Dimensioni

La differenza di dimensioni, peso e slot dei dispositivi a confronto

  • Altezza
    117 mm left arrow 116 mm
  • Lunghezza
    280 mm left arrow 267 mm
  • Slot Size
    2 PCIe-Slots left arrow 2 PCIe-Slots
  • Weight
    - left arrow -
  • Width
    40 mm left arrow 35 mm
Ulteriori informazioni

Confronto tra le interfacce e le date di rilascio per le GPU NVIDIA TITAN RTX e GIGABYTE GeForce RTX 2080 Ti Windforce 11G.

  • Specifica
    data sheet left arrow data sheet
  • Launch Price (historical)
    1,599 $ left arrow 2,499 $ (Reference)
  • Part Number
    GV-N208TWF3-11GC left arrow 900-1G150-2500-000
  • Process Technology
    12 nm left arrow 12 nm
  • Data di rilascio
    Q3/2018 left arrow Q4/2018

Benchmark (test)

Test di performance GPUs
Individual model tests

These results have no shared test of both models with the same version and settings. They are shown separately without a percentage difference.

GIGABYTE GeForce RTX 2080 Ti Windforce 11G

More results: 75

NVIDIA TITAN RTX

Sulla base dei risultati di alcuni benchmark popolari, è possibile stimare con maggiore precisione la differenza di prestazioni tra GIGABYTE GeForce RTX 2080 Ti Windforce 11G e NVIDIA TITAN RTX.

Confronta i benchmark sintetici e scegli la scheda grafica migliore per te!

These are saved results from the earlier catalog. Measurement dates and test configurations were not recorded. Models with no comparable results are omitted.

Recent models: test results with identified primary sources — Game frame rates

Archived results. The original measurement method and test conditions have not been verified.

FP32 Performance (Single-precision TFLOPS)
Benchmark FP32 è un calcolo in virgola mobile a 32 bit per la GPU che è richiesto per il gioco 3D.

Higher values are better in this metric.

13.45 TFLOPS
GIGABYTE GeForce RTX 2080 Ti Windforce 11G
16.31 TFLOPS
NVIDIA TITAN RTX

Ultimi confronti