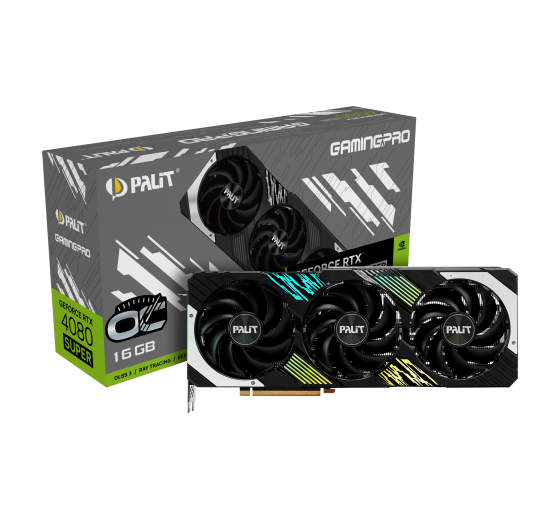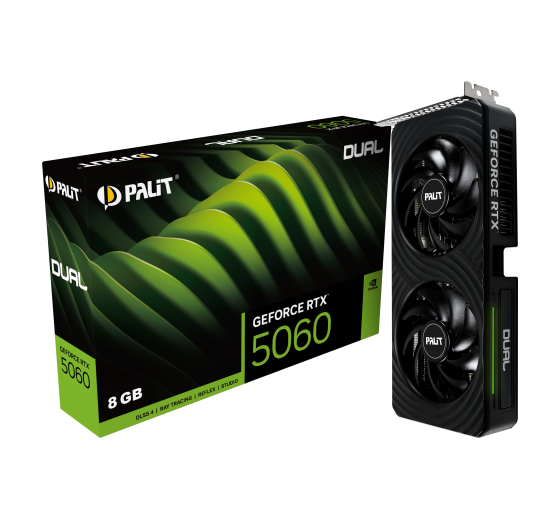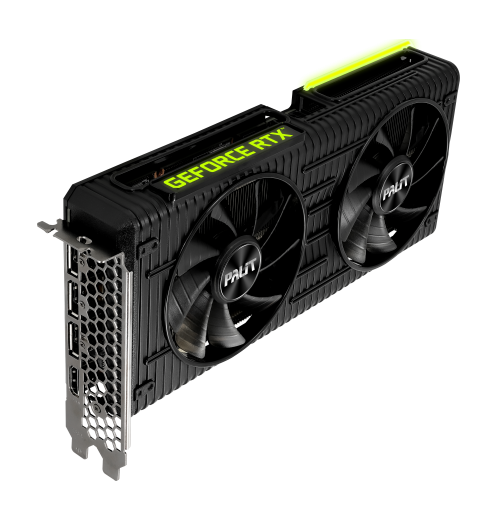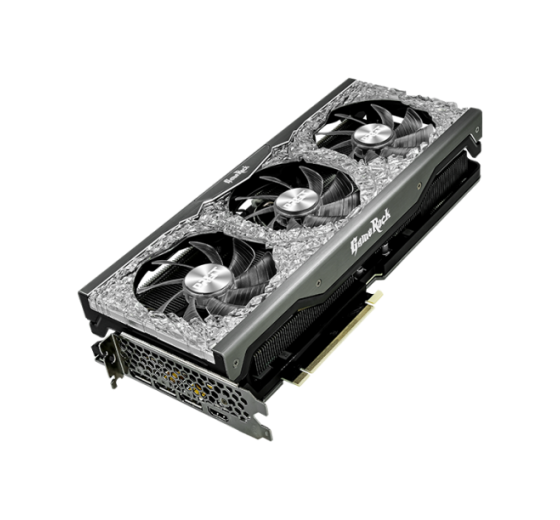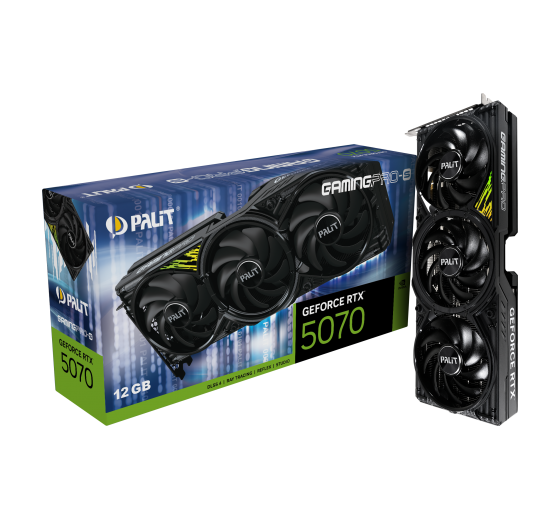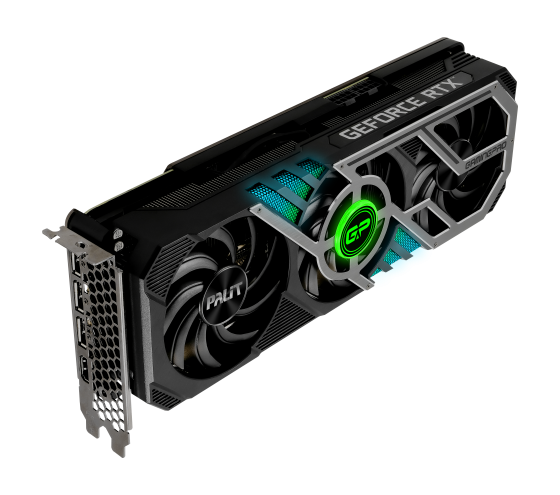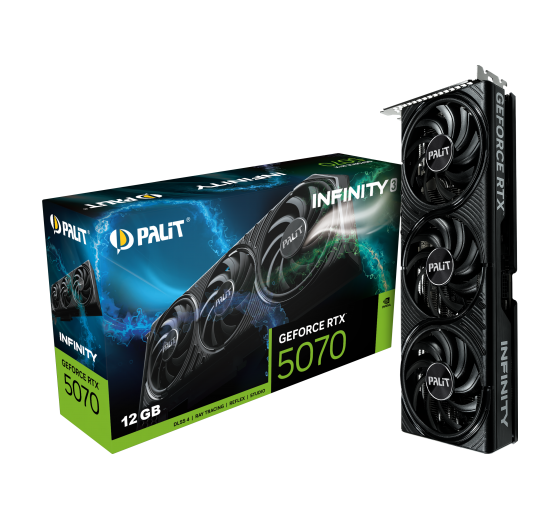

Qual è la scelta migliore Gainward GeForce GTX 1070 o Gainward GeForce GTX 1070 Phoenix GS? Quale scheda grafica è più veloce?
Abbiamo preparato un confronto per aiutarvi a scegliere la migliore scheda grafica. Confrontate le loro specifiche e i loro benchmark.
Gainward GeForce GTX 1070 has a base frequency of 1.506 GHz. Dimensione della memoria 8 GB. Tipo di memoria GDDR5. Rilasciato in Q2/2016.
Gainward GeForce GTX 1070 Phoenix GS has a base frequency of 1.632 GHz+ 8 %. Dimensione della memoria 8 GB. Tipo di memoria GDDR5. Rilasciato in Q2/2016.
Motivi da considerare Posizione nella classifica generale
(sulla base di diversi parametri di riferimento)
 posto
posto
Posizioni comuni Gainward GeForce GTX 1070 GPU in benchmark popolari, per un confronto con altri modelli.
Motivi da considerare Posizione nella classifica generale
(sulla base di diversi parametri di riferimento)
posto
Posizioni comuni Gainward GeForce GTX 1070 Phoenix GS GPU in benchmark popolari, per un confronto con altri modelli.
Gainward GeForce GTX 1070
Confronto dei dati tecnici di base delle schede grafiche Gainward GeForce GTX 1070 e Gainward GeForce GTX 1070 Phoenix GS, chip, unità di elaborazione delle informazioni.
 NVIDIA GeForce GTX 1070
15
GP104-200-A1
64
1920
120
NVIDIA GeForce GTX 1070
15
GP104-200-A1
64
1920
120
Video memory capacity, type, bus width and bandwidth describe different properties. These values alone do not determine graphics performance.
256 GB/s
256 bit
8 GB
2002 MHz
GDDR5
Published GPU clock frequencies describe different operating modes. Clock speed alone does not determine graphics performance.
1632 MHz + 8%
1835 MHz + 9%
-
Sì
Graphics card power limits and recommended system power supply describe different specifications.
-
150 W
-
Tipi e dimensioni dei dissipatori per il sistema di raffreddamento delle schede grafiche Gainward GeForce GTX 1070 e Gainward GeForce GTX 1070 Phoenix GS.
Air cooling
Axial
2 x 100 mm
-
0 dB / Silent
-
Connettività e collegamenti.
3 × DisplayPort 1.4
1 × DVI
2.2
1 × HDMI 2.0b
4
PCIe 3.0 x16
1 x 8-Pin
-
-
Dati tecnici utilizzati al massimo delle loro potenzialità nei giochi per computer.
12_1
No
No LED lighting
7680 × 4320
No
Supporto incorporato per gli standard di compressione video e immagine.
No
Decode / Encode
Decode / Encode
Decode
Decode
La differenza di dimensioni, peso e slot dei dispositivi a confronto
133 mm
285 mm
3 PCIe-Slots
-
-
Confronto tra le interfacce e le date di rilascio per le GPU Gainward GeForce GTX 1070 Phoenix GS e Gainward GeForce GTX 1070.
data sheet
-
426018336-3682
16 nm
Q2/2016
Shared tests with results for both models: 8
Each row is a separate graphics subtest. Scores are not game FPS.
| Test and settings | Gainward GeForce GTX 1070 | Gainward GeForce GTX 1070 Phoenix GS | Result difference¹ |
|---|---|---|---|
| 3DMark Time Spy | 5945 points Base GPU test: Founders Edition Tested board: Founders EditionVRAM: 8 GBTest CPU: AMD Ryzen 9 7900System RAM: 32 GB DDR5-5200CL38OS: Windows 11Driver: 551.23Application version unreported | 5945 points Base GPU test: Founders Edition Tested board: Founders EditionVRAM: 8 GBTest CPU: AMD Ryzen 9 7900System RAM: 32 GB DDR5-5200CL38OS: Windows 11Driver: 551.23Application version unreported | Complete test conditions unreported |
Each row uses one game, resolution, test suite and graphics mode.
| Test and settings | Gainward GeForce GTX 1070 | Gainward GeForce GTX 1070 Phoenix GS | Result difference¹ |
|---|---|---|---|
| Baldur's Gate 3 / 1920x1080 / Ultra / Native / RT off | 52.2 FPS Base GPU test: Founders Edition Tested board: Founders EditionVRAM: 8 GBTest CPU: AMD Ryzen 9 7900System RAM: 32 GB DDR5-5200CL38OS: Windows 11Graphics API: VulkanRendering: Native (no FSR/DLSS)Driver: 551.23 | 52.2 FPS Base GPU test: Founders Edition Tested board: Founders EditionVRAM: 8 GBTest CPU: AMD Ryzen 9 7900System RAM: 32 GB DDR5-5200CL38OS: Windows 11Graphics API: VulkanRendering: Native (no FSR/DLSS)Driver: 551.23 | Complete test conditions unreported |
| Counter-Strike 2 / 1920x1080 / High / Native / RT off | 229.4 FPS Base GPU test: Founders Edition Tested board: Founders EditionVRAM: 8 GBTest CPU: AMD Ryzen 9 7900System RAM: 32 GB DDR5-5200CL38OS: Windows 11Rendering: Native (no FSR/DLSS)Driver: 551.23 | 229.4 FPS Base GPU test: Founders Edition Tested board: Founders EditionVRAM: 8 GBTest CPU: AMD Ryzen 9 7900System RAM: 32 GB DDR5-5200CL38OS: Windows 11Rendering: Native (no FSR/DLSS)Driver: 551.23 | Complete test conditions unreported |
| Cyberpunk 2077 / 1920x1080 / High / Native / RT off | 35.2 FPS Base GPU test: Founders Edition Tested board: Founders EditionVRAM: 8 GBTest CPU: AMD Ryzen 9 7900System RAM: 32 GB DDR5-5200CL38OS: Windows 11Rendering: Native (no FSR/DLSS)Game build: Phantom Liberty / Patch 2.11Driver: 551.23 | 35.2 FPS Base GPU test: Founders Edition Tested board: Founders EditionVRAM: 8 GBTest CPU: AMD Ryzen 9 7900System RAM: 32 GB DDR5-5200CL38OS: Windows 11Rendering: Native (no FSR/DLSS)Game build: Phantom Liberty / Patch 2.11Driver: 551.23 | Complete test conditions unreported |
| Diablo IV / 1920x1080 / Medium / Native / RT off | 122.6 FPS Base GPU test: Founders Edition Tested board: Founders EditionVRAM: 8 GBTest CPU: AMD Ryzen 9 7900System RAM: 32 GB DDR5-5200CL38OS: Windows 11Rendering: Native (no FSR/DLSS)Driver: 551.23 | 122.6 FPS Base GPU test: Founders Edition Tested board: Founders EditionVRAM: 8 GBTest CPU: AMD Ryzen 9 7900System RAM: 32 GB DDR5-5200CL38OS: Windows 11Rendering: Native (no FSR/DLSS)Driver: 551.23 | Complete test conditions unreported |
| Dota 2 / 1920x1080 / Maximum / Native / RT off | 209.7 FPS Base GPU test: Founders Edition Tested board: Founders EditionVRAM: 8 GBTest CPU: AMD Ryzen 9 7900System RAM: 32 GB DDR5-5200CL38OS: Windows 11Graphics API: DirectX 11Rendering: Native (no FSR/DLSS)Driver: 551.23 | 209.7 FPS Base GPU test: Founders Edition Tested board: Founders EditionVRAM: 8 GBTest CPU: AMD Ryzen 9 7900System RAM: 32 GB DDR5-5200CL38OS: Windows 11Graphics API: DirectX 11Rendering: Native (no FSR/DLSS)Driver: 551.23 | Complete test conditions unreported |
| F1 23 / 1920x1080 / High / 16x AF / TAA + FidelityFX Sharpening / Native / RT off | 111.9 FPS Base GPU test: Founders Edition Tested board: Founders EditionVRAM: 8 GBTest CPU: AMD Ryzen 9 7900System RAM: 32 GB DDR5-5200CL38OS: Windows 11Rendering: Native (no FSR/DLSS)Driver: 551.23 | 111.9 FPS Base GPU test: Founders Edition Tested board: Founders EditionVRAM: 8 GBTest CPU: AMD Ryzen 9 7900System RAM: 32 GB DDR5-5200CL38OS: Windows 11Rendering: Native (no FSR/DLSS)Driver: 551.23 | Complete test conditions unreported |
| Ratchet & Clank / 1920x1080 / High / TAA / Native / RT off | 41.2 FPS Base GPU test: Founders Edition Tested board: Founders EditionVRAM: 8 GBTest CPU: AMD Ryzen 9 7900System RAM: 32 GB DDR5-5200CL38OS: Windows 11Rendering: Native (no FSR/DLSS)Driver: 551.23 | 41.2 FPS Base GPU test: Founders Edition Tested board: Founders EditionVRAM: 8 GBTest CPU: AMD Ryzen 9 7900System RAM: 32 GB DDR5-5200CL38OS: Windows 11Rendering: Native (no FSR/DLSS)Driver: 551.23 | Complete test conditions unreported |
¹ Difference of the second result relative to the first in that row. No percentage is calculated for different upscaling algorithms. This compares published results, not a universal performance index.
A base GPU test is a reference for cards using that GPU and the same memory capacity. Board overclocking, cooling and power limits can change the result.
Sulla base dei risultati di alcuni benchmark popolari, è possibile stimare con maggiore precisione la differenza di prestazioni tra Gainward GeForce GTX 1070 e Gainward GeForce GTX 1070 Phoenix GS.
Confronta i benchmark sintetici e scegli la scheda grafica migliore per te!
These are saved results from the earlier catalog. Measurement dates and test configurations were not recorded. Models with no comparable results are omitted.
Recent models: test results with identified primary sources — Game frame rates
Archived results. The original measurement method and test conditions have not been verified.
Higher values are better in this metric.
Higher values are better in this metric.
Higher values are better in this metric.
Higher values are better in this metric.
Higher values are better in this metric.
Higher values are better in this metric.
Higher values are better in this metric.
Higher values are better in this metric.


 English
 Russian
 German
 Portuguese
 French
 Japan
Japan Spanish
 Polish
 Chinese
 Korean