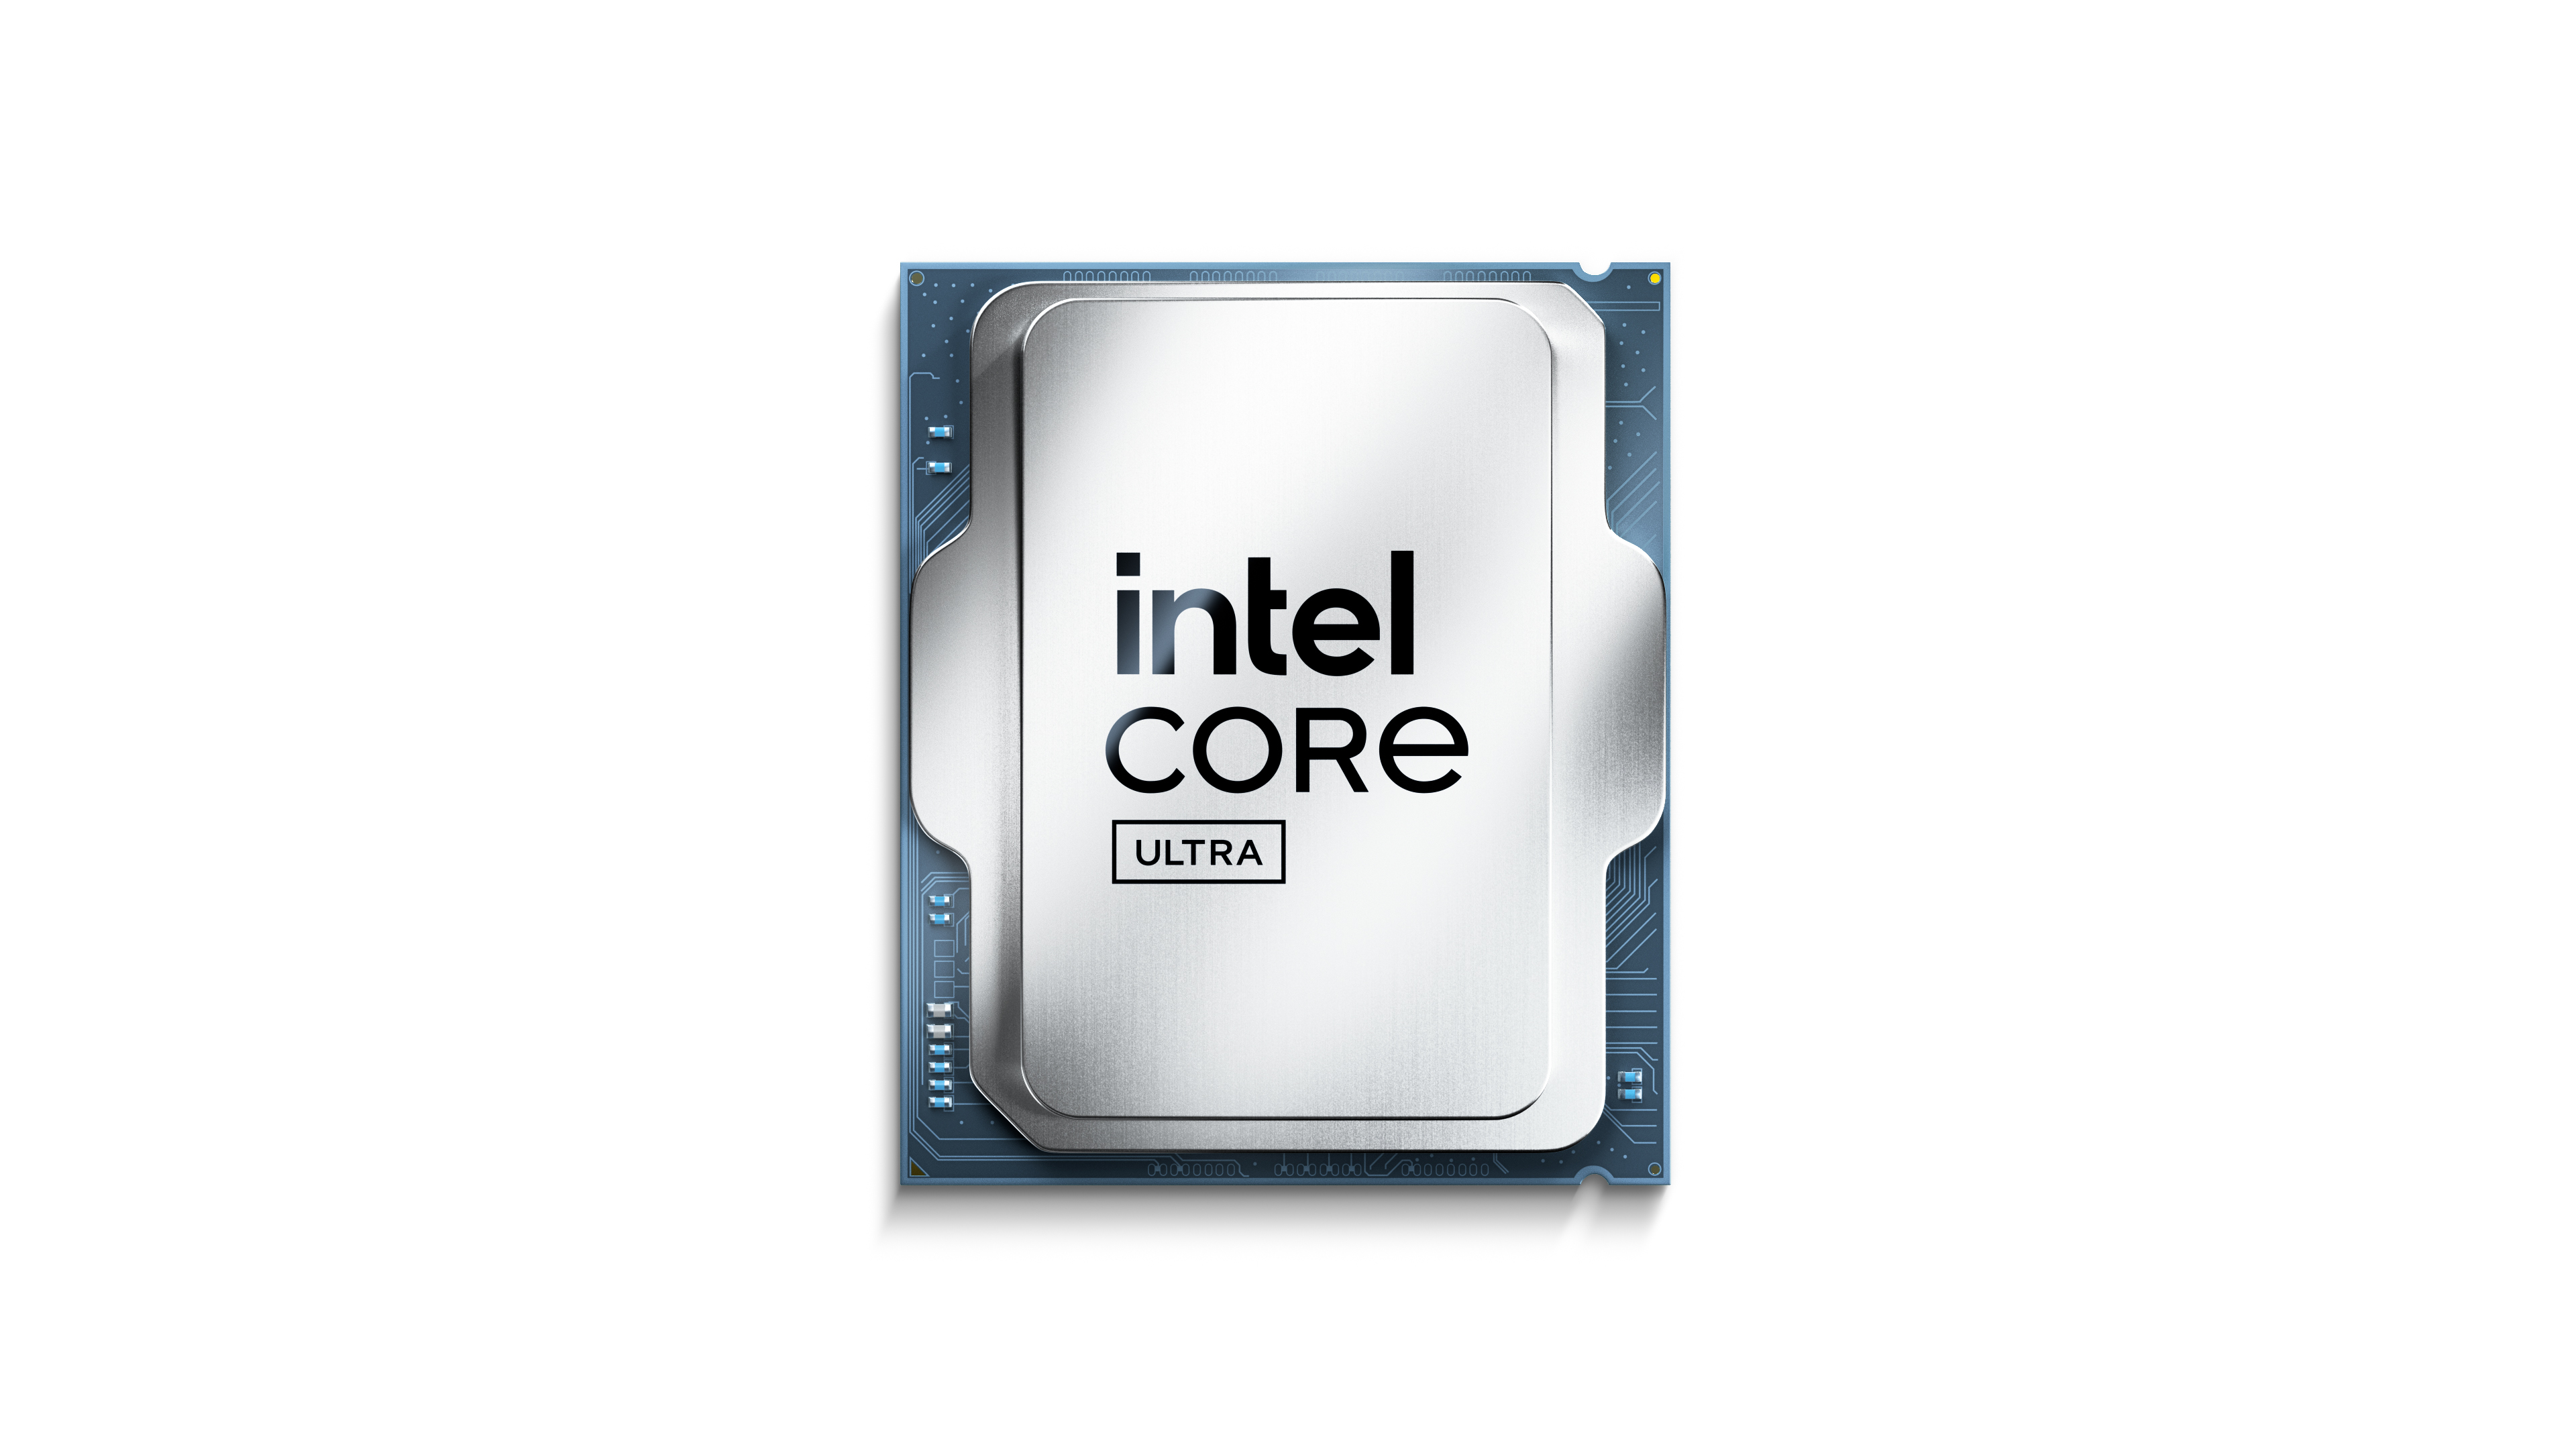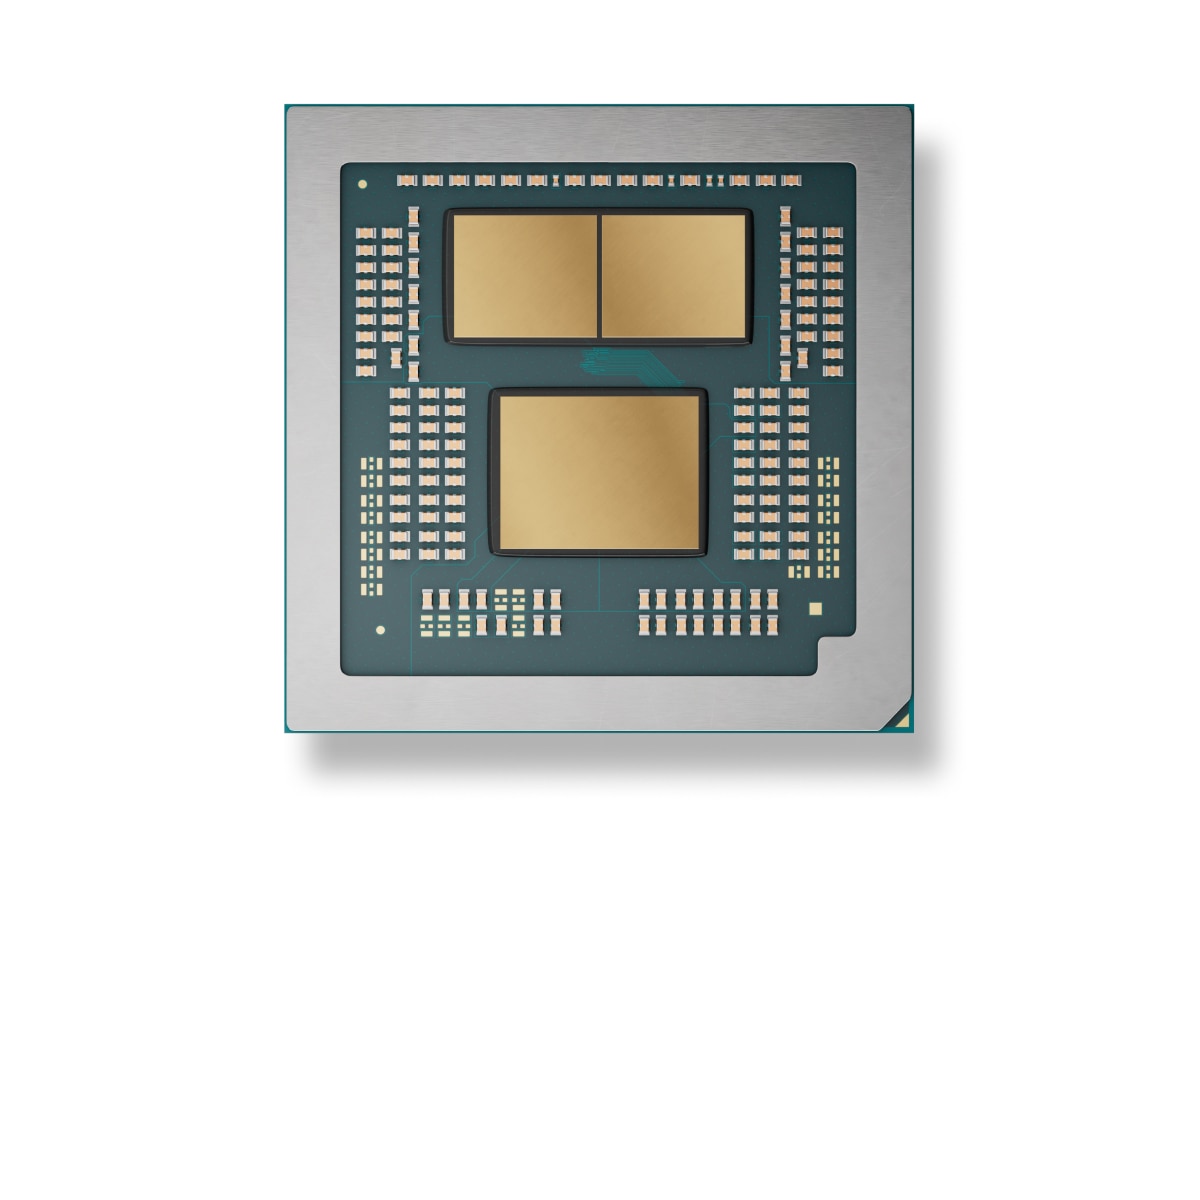


Qual è la scelta migliore Intel Core i9-13900H o AMD Ryzen 7 5800X? Quale processore è più veloce?
Abbiamo preparato un confronto per aiutarvi a scegliere il processore migliore. Confrontate le loro specifiche e i loro benchmark.
Intel Core i9-13900H has a base frequency of 2.60 GHz (5.40 GHz). 14 / 20 CPU Cores / Threads. Stated TDP / base power 45 W. Rilasciato in Q1/2023.
AMD Ryzen 7 5800X has a base frequency of 3.8 GHz. 8 / 16 CPU Cores / Threads. Stated TDP / base power 105 W. Rilasciato in 2020-11-05.
Motivi da considerare Più numero di core
6 more cores
 8
Lower stated TDP / base power
Power limits alone do not measure performance per watt.
105 W
Posizioni comuni Intel Core i9-13900H CPU in benchmark popolari, per un confronto con altri modelli.
Motivi da considerare Posizione nella classifica generale
(sulla base di diversi parametri di riferimento)
 posto
Posizioni comuni AMD Ryzen 7 5800X CPU in benchmark popolari, per un confronto con altri modelli.
Intel Core i9-13900H
Informazioni di base sui processori a confronto, serie, generazione e segmento di mercato.
 AMD Ryzen 5000
Ryzen
4
AMD Ryzen 7 3800X
Desktop
Desktops / Boxed Processor
Ryzen 5000 Series
Core counts, threads, cache and clock modes describe the CPU configuration. Performance depends on the workload and comparable measured results.
-
-
-
-
normal
8
16
Sì
Sì
3.8 GHz
4.7 GHz
4.7 GHz
4.4 GHz
La grafica interna non influisce sulle prestazioni della CPU, ma svolge il lavoro della scheda grafica in sua assenza o su dispositivi mobili.
-
-
-
-
None
-
-
-
-
-
-
Codec integrati utilizzati per codificare e decodificare i contenuti. Velocizza notevolmente le operazioni richieste.
No
No
No
No
No
No
No
No
Tipi, quantità di canali di RAM supportati da AMD Ryzen 7 5800X e Intel Core i9-13900H. A seconda delle schede madri, possono essere supportate frequenze di memoria più alte o più basse.
Sì
128 GB
-
2
DDR4
PCIe 4.0
20
4.0
3200
Sì
Confrontare i requisiti TDP di TDP Intel Core i9-13900H e AMD Ryzen 7 5800X Power specifications describe different manufacturer limits. TDP, base power and maximum turbo power are separate values; they do not establish measured system consumption.
90 °C
-
-
-
105 W
105 W
Architettura, interfacce, istruzioni aggiuntive supportate da Intel Core i9-13900H e AMD Ryzen 7 5800X, tecnologie per macchine virtuali e tecnologia di processo.
Vermeer (Zen 3)
-
-
x86-64 (64 bit)
SSE4a, SSE4.1, SSE4.2, AVX2, FMA3
4 MB
32 MB
-
2020-11-05
-
AM4
TSMC 7nm FinFET
AMD-V, SVM
Vermeer
Shared tests with results for both models: 13
Each row uses one Blender version, operating system and compute backend.
| Test and settings | Intel Core i9-13900H | AMD Ryzen 7 5800X | Result difference¹ |
|---|---|---|---|
| Blender 5.2.0 / CPU / Windows | 214.871098 samples/min Submissions: 6 | 213.455033 samples/min Submissions: 25 | -0.7 % |
| Blender 5.1.1 / CPU / Linux | 230.78364 samples/min Submissions: 6 | 238.790662 samples/min Submissions: 18 | +3.5 % |
| Blender 5.1.1 / CPU / Windows | 165.950779 samples/min Submissions: 16 | 219.538655 samples/min Submissions: 40 | +32.3 % |
| Blender 4.5.0 / CPU / Linux | 239.172077 samples/min Submissions: 10 | 252.417386 samples/min Submissions: 86 | +5.5 % |
| Blender 4.5.0 / CPU / Windows | 183.738244 samples/min Submissions: 56 | 203.851614 samples/min Submissions: 237 | +10.9 % |
| Blender 4.4.0 / CPU / Linux | 180.382133 samples/min Submissions: 13 | 241.730232 samples/min Submissions: 19 | +34.0 % |
| Blender 4.4.0 / CPU / Windows | 196.311314 samples/min Submissions: 39 | 195.366501 samples/min Submissions: 99 | -0.5 % |
| Blender 4.3.0 / CPU / Windows | 206.012944 samples/min Submissions: 49 | 197.377448 samples/min Submissions: 207 | -4.2 % |
| Blender 4.2.0 / CPU / Linux | 195.081862 samples/min Submissions: 8 | 243.986623 samples/min Submissions: 33 | +25.1 % |
| Blender 4.2.0 / CPU / Windows | 151.490866 samples/min Submissions: 53 | 194.110194 samples/min Submissions: 225 | +28.1 % |
| Blender 4.1.0 / CPU / Windows | 201.364266 samples/min Submissions: 31 | 203.822985 samples/min Submissions: 98 | +1.2 % |
| Blender 4.0.0 / CPU / Linux | 258.238432 samples/min Submissions: 13 | 248.932305 samples/min Submissions: 35 | -3.6 % |
| Test and settings | Intel Core i9-13900H | AMD Ryzen 7 5800X | Result difference¹ |
|---|---|---|---|
| Blender 4.0.0 / CPU / Windows | 212.627128 samples/min Submissions: 118 | 203.037866 samples/min Submissions: 256 | -4.5 % |
¹ Difference of the second result relative to the first in that row. No percentage is calculated for different upscaling algorithms. This compares published results, not a universal performance index.
These results have no shared test of both models with the same version and settings. They are shown separately without a percentage difference.
Results were obtained on the reported systems. Test versions and settings remain separate; incomplete conditions do not support calculated model performance differences.
| Model | Result | Reported conditions |
|---|---|---|
| Intel Core i9-13900H | 5067.113924 H/s | RandomX / XMRig 6.26.0 / 1M / 17 threads / windows System RAM: 32 GB OS: Windows NT 10.0 Duration: 197.351 s User-submitted run; tuning and power settings are incomplete. |
| Model | Result | Reported conditions |
|---|---|---|
| AMD Ryzen 7 5800X | 9789.151467 H/s | RandomX / XMRig 6.25.0 / 10M / 16 threads / windows System RAM: 16 GB OS: Windows NT 10.0 Motherboard: Micro-Star International Co., Ltd. / B550 GAMING GEN3 (MS-7B86) Duration: 1021.539 s User-submitted run; tuning and power settings are incomplete. |
Sulla base dei risultati di diversi benchmark, è possibile stimare con maggiore precisione la differenza di prestazioni tra Intel Core i9-13900H e AMD Ryzen 7 5800X.
Confrontate i valori dei test sintetici e scegliete il processore migliore!
These are saved results from the earlier catalog. Measurement dates and test configurations were not recorded. Models with no comparable results are omitted.
Recent models: test results with identified primary sources — Cinebench R23 · Cinebench R20 · Cinebench R15 · Cinebench 2026 · RandomX benchmark
Higher values are better in this metric.
Higher values are better in this metric.
Higher values are better in this metric.


 English
 Russian
 German
 Portuguese
 French
 Japan
 Spanish
 Polish
 Chinese
 Korean