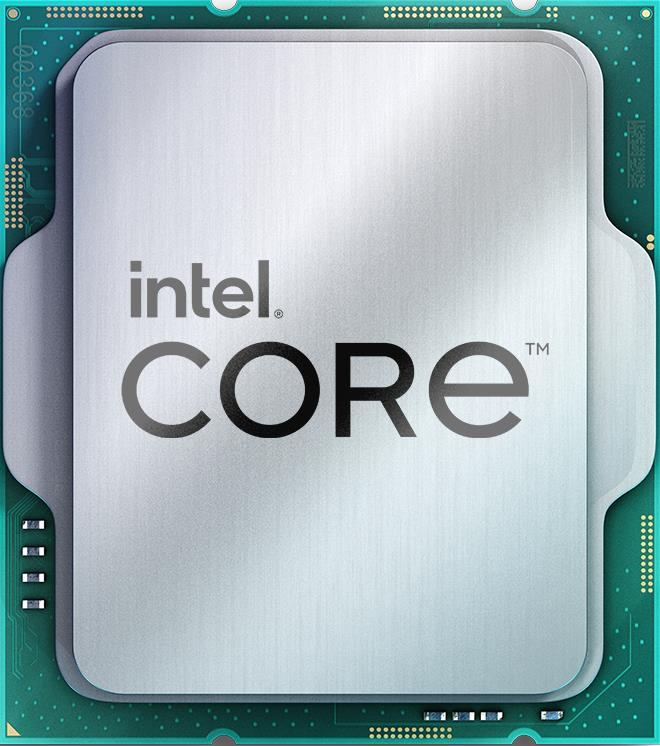
Intel Core i5-4210U
Intel Pentium G4600
Seleziona la scheda video 1
Seleziona la scheda video 2

Intel Core i5-4210U contro Intel Pentium G4600. Specifiche, prestazioni, test

User rating
star star star star star
Rilasciato
Q2/2014
Intel Core i5-4210U
Intel Core i5-4210U
Rilasciato
Q1/2017
User rating
star star star star star
Intel Pentium G4600
Intel Pentium G4600

Qual è la scelta migliore Intel Core i5-4210U o Intel Pentium G4600? Quale processore è più veloce?

Abbiamo preparato un confronto per aiutarvi a scegliere il processore migliore. Confrontate le loro specifiche e i loro benchmark.

Intel Core i5-4210U has a base frequency of 1.70 GHz. 2 CPU Cores / Threads. Stated TDP / base power 15 W. Rilasciato in Q2/2014.

Intel Pentium G4600 has a base frequency of 3.60 GHz. 2 CPU Cores / Threads. Stated TDP / base power 51 W. Rilasciato in Q1/2017.

Differenze

  • Lower stated TDP / base power

    Power limits alone do not measure performance per watt.

    15 W left arrow 51 W

Posizioni in tutte le classifiche

Posizioni comuni Intel Core i5-4210U CPU in benchmark popolari, per un confronto con altri modelli.

  • Cinebench R20 (Single-Core)
    487 place
  • Cinebench R20 (Multi-Core)
    458 place
  • Cinebench R15 (Single-Core)
    803 place
  • Cinebench R15 (Multi-Core)
    825 place
  • Geekbench 5, 64bit (Single-Core)
    907 place
  • Geekbench 5, 64bit (Multi-Core)
    1021 place
  • iGPU - FP32 Performance (Single-precision GFLOPS)
    1072 place
  • Geekbench 3, 64bit (Single-Core)
    533 place
  • Geekbench 3, 64bit (Multi-Core)
    642 place
  • Cinebench R11.5, 64bit (Single-Core)
    544 place
  • Cinebench R11.5, 64bit (Multi-Core)
    618 place
  • Cinebench R11.5, 64bit (iGPU, OpenGL)
    291 place
  • Estimated results for PassMark CPU Mark
    849 place
  • Velocità di clock più alta

    Intorno a 112% migliore velocità di clock

    3.60 GHz left arrow 1.70 GHz

Posizioni in tutte le classifiche

Posizioni comuni Intel Pentium G4600 CPU in benchmark popolari, per un confronto con altri modelli.

  • Cinebench R20 (Single-Core)
    400 place
  • Cinebench R20 (Multi-Core)
    393 place
  • Cinebench R15 (Single-Core)
    361 place
  • Cinebench R15 (Multi-Core)
    613 place
  • Geekbench 5, 64bit (Single-Core)
    545 place
  • Geekbench 5, 64bit (Multi-Core)
    776 place
  • iGPU - FP32 Performance (Single-precision GFLOPS)
    743 place
  • Geekbench 3, 64bit (Single-Core)
    271 place
  • Geekbench 3, 64bit (Multi-Core)
    444 place
  • Cinebench R11.5, 64bit (Single-Core)
    127 place
  • Cinebench R11.5, 64bit (Multi-Core)
    400 place
  • Cinebench R11.5, 64bit (iGPU, OpenGL)
    99 place
  • Estimated results for PassMark CPU Mark
    642 place

Specifiche

Dati tecnici
Intel Core i5-4210U Intel Core i5-4210U
Intel Pentium G4600 Intel Pentium G4600
Famiglia e gruppo di CPU

Informazioni di base sui processori a confronto, serie, generazione e segmento di mercato.

  • Gruppo CPU
    Intel Core i 4000U left arrow Intel Pentium G4000
  • Serie
    Intel Core i5 left arrow Intel Pentium
  • Generazione
    4 left arrow 7
  • Segmento
    Mobile left arrow Desktop / Server
Specifiche tecniche della CPU

Core counts, threads, cache and clock modes describe the CPU configuration. Performance depends on the workload and comparable measured results.

  • Base Frequency
    1.7 GHz left arrow 3.6 GHz
  • Architettura di base
    normal left arrow normal
  • Core della CPU
    2 left arrow 2
  • Threads della CPU
    4 left arrow 4
  • Hyperthreading / SMT
    Sì left arrow Sì
  • Overclock
    No left arrow No
  • Turbo Frequency (1 Core)
    2.7 GHz left arrow No turbo
  • Turbo Frequency (2 Cores)
    2.35 GHz left arrow No turbo
IGPU

La grafica interna non influisce sulle prestazioni della CPU, ma svolge il lavoro della scheda grafica in sua assenza o su dispositivi mobili.

  • DirectX Version
    11.1 left arrow 12
  • Unità di esecuzione
    20 left arrow 24
  • Generazione
    7.5 left arrow 9.5
  • GPU Frequency
    200 MHz left arrow 350 MHz
  • Nome della GPU
    Intel HD Graphics 4400 left arrow Intel HD Graphics 630
  • GPU Turbo
    1000 MHz left arrow 1100 MHz
  • Max. displays
    3 left arrow 3
  • Max. GPU Memory
    2 GB left arrow 64 GB
  • Data di rilascio
    Q2/2013 left arrow Q2/2016
  • Shader
    160 left arrow 192
  • Processo tecnico
    22 nm left arrow 14 nm
Supporto codec hardware

Codec integrati utilizzati per codificare e decodificare i contenuti. Velocizza notevolmente le operazioni richieste.

  • AV1
    No left arrow No
  • H.264 / AVC
    Decode / Encode left arrow Decode / Encode
  • h265 / HEVC (8 bit)
    No left arrow Decode / Encode
  • h265 / HEVC (10 bit)
    No left arrow Decode / Encode
  • JPEG
    Decode left arrow Decode / Encode
  • VC-1
    Decode left arrow Decode
  • VP8
    No left arrow Decode / Encode
  • VP9
    No left arrow Decode / Encode
Specifiche di memoria e PCI

Tipi, quantità di canali di RAM supportati da Intel Pentium G4600 e Intel Core i5-4210U. A seconda delle schede madri, possono essere supportate frequenze di memoria più alte o più basse.

  • ECC
    No left arrow Sì
  • Canali di memoria
    2 left arrow 2
  • Tipo di memoria
    DDR3L-1600 SO-DIMM left arrow DDR4-2400
  • Corsie PCIe
    12 left arrow 16
  • Versione PCIe
    2.0 left arrow 3.0
Crittografia
  • AES-NI
    Sì left arrow Sì
Consumo di energia

Confrontare i requisiti TDP di TDP Intel Core i5-4210U e Intel Pentium G4600 Power specifications describe different manufacturer limits. TDP, base power and maximum turbo power are separate values; they do not establish measured system consumption.

  • TDP (PL1, legacy label)
    15 W left arrow 51 W
Tecnologie ed estensioni

Architettura, interfacce, istruzioni aggiuntive supportate da Intel Core i5-4210U e Intel Pentium G4600, tecnologie per macchine virtuali e tecnologia di processo.

  • Architettura
    Haswell U left arrow Kaby Lake S
  • Set di istruzioni (ISA)
    x86-64 (64 bit) left arrow x86-64 (64 bit)
  • Estensioni ISA
    SSE4.1, SSE4.2, AVX2 left arrow SSE4.1, SSE4.2
  • L3-Cache
    3 MB left arrow 3 MB
  • Data di rilascio
    Q2/2014 left arrow Q1/2017
  • Presa
    BGA 1168 left arrow LGA 1151
  • Processo tecnico
    22 nm left arrow 14 nm
  • Virtualizzazione
    VT-x, VT-x EPT, VT-d left arrow VT-x, VT-x EPT, VT-d

Benchmark (test)

Test di performance CPUs

Sulla base dei risultati di diversi benchmark, è possibile stimare con maggiore precisione la differenza di prestazioni tra Intel Core i5-4210U e Intel Pentium G4600.

Confrontate i valori dei test sintetici e scegliete il processore migliore!

These are saved results from the earlier catalog. Measurement dates and test configurations were not recorded. Models with no comparable results are omitted.

Recent models: test results with identified primary sources — Cinebench R23 · Cinebench R20 · Cinebench R15 · Cinebench 2026 · RandomX benchmark

Cinebench R20 (Single-Core)
Cinebench R20 SC è un test della CPU a carico elevato per compiti lunghi su un PC desktop o notebook, utilizza un core della CPU, senza ipetrading.

Higher values are better in this metric.

202.000000
Intel Core i5-4210U
327.000000
Intel Pentium G4600
Cinebench R20 (Multi-Core)
Cinebench R20 MC è un test della CPU ad alto carico per compiti lunghi su un PC desktop o notebook, utilizzando un multi-core e hyperthreading.

Higher values are better in this metric.

449.000000
Intel Core i5-4210U
838.000000
Intel Pentium G4600
Cinebench R15 (Single-Core)
Il Cinebench R15 SC stressa i moduli di calcolo di un computer desktop o portatile ai loro limiti e determina accuratamente i parametri chiave delle prestazioni dell'hardware.

Higher values are better in this metric.

92.000000
Intel Core i5-4210U
155.000000
Intel Pentium G4600
Cinebench R15 (Multi-Core)
Il Cinebench R15 MC stressa i moduli di calcolo di un computer desktop o portatile ai loro limiti e determina accuratamente i parametri chiave delle prestazioni dell'hardware.

Higher values are better in this metric.

236.000000
Intel Core i5-4210U
392.000000
Intel Pentium G4600
Geekbench 5, 64bit (Single-Core)
Geekbench 5 SC è un popolare test di prestazioni multipiattaforma per processori desktop o mobili che utilizza intensamente la memoria di sistema.

Higher values are better in this metric.

547.000000
Intel Core i5-4210U
873.000000
Intel Pentium G4600
Geekbench 5, 64bit (Multi-Core)
Geekbench 5 MC è un popolare test di prestazioni multipiattaforma per processori desktop o mobili che utilizza intensamente la memoria di sistema.

Higher values are better in this metric.

1150.000000
Intel Core i5-4210U
1913.000000
Intel Pentium G4600
iGPU - FP32 Performance (Single-precision GFLOPS)
Le prestazioni della iGPU - la GPU interna nei giochi.

Higher values are better in this metric.

320.000000
Intel Core i5-4210U
422.000000
Intel Pentium G4600
Geekbench 3, 64bit (Single-Core)
Geekbench 3 SC per un core della CPU, include stress test che simulano scenari 3D reali per Windows, Mac, Linux, Ansroid, iOS.

Higher values are better in this metric.

2544.000000
Intel Core i5-4210U
3686.000000
Intel Pentium G4600
Geekbench 3, 64bit (Multi-Core)
Geekbench 3 MC utilizzando un multi-core e hyperthreading, include stress test che simulano scenari 3D reali per Windows, Mac, Linux, Ansroid, iOS.

Higher values are better in this metric.

4659.000000
Intel Core i5-4210U
7816.000000
Intel Pentium G4600
Cinebench R11.5, 64bit (Single-Core)
Il test della CPU e della GPU del PC prevede il rendering di una specifica scena 3D in modalità single-core, basata su CINEMA 4D.

Higher values are better in this metric.

1.070000
Intel Core i5-4210U
1.890000
Intel Pentium G4600
Cinebench R11.5, 64bit (Multi-Core)
The PC CPU and GPU test involves rendering a specific 3D scene in multi-core mode and hyperthreading, based on CINEMA 4D

Higher values are better in this metric.

2.410000
Intel Core i5-4210U
4.750000
Intel Pentium G4600
Cinebench R11.5, 64bit (iGPU, OpenGL)
Il test iGPU prevede il rendering di una specifica scena 3D, basata su CINEMA 4D.

Higher values are better in this metric.

14.800000
Intel Core i5-4210U
35.700000
Intel Pentium G4600
Estimated results for PassMark CPU Mark
PassMark è una suite di test che esegue complessi calcoli matematici per determinare le prestazioni della CPU sulla compressione dei file, la crittografia e i compiti legati alla fisica.

Higher values are better in this metric.

3431.000000
Intel Core i5-4210U
5378.000000
Intel Pentium G4600

Ultimi confronti