Qual è la scelta migliore Intel Core i5-1235U o AMD Ryzen 7 7800X3D? Quale processore è più veloce?
Abbiamo preparato un confronto per aiutarvi a scegliere il processore migliore. Confrontate le loro specifiche e i loro benchmark.
Intel Core i5-1235U has a base frequency of 1.30 GHz. 10 / 12 CPU Cores / Threads. Stated TDP / base power 15 W. Rilasciato in Q1/2022.
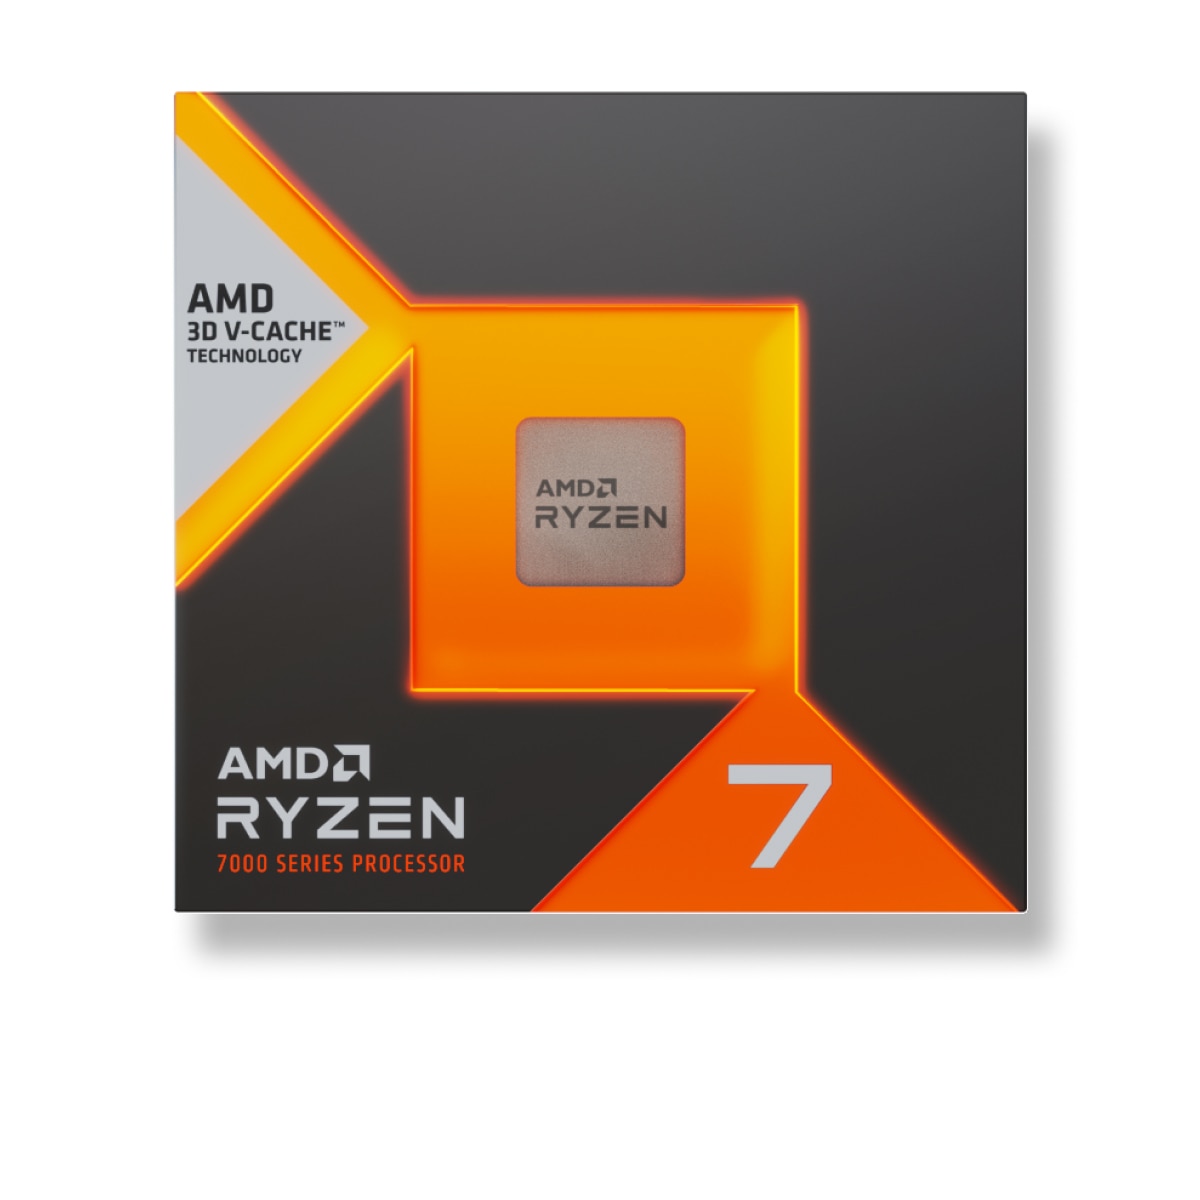
AMD Ryzen 7 7800X3D has a base frequency of 4.2 GHz. 8 / 16 CPU Cores / Threads. Stated TDP / base power 120 W. Rilasciato in 2023-04-06.
Motivi da considerare Più numero di core
2 more cores
 8
Lower stated TDP / base power
Power limits alone do not measure performance per watt.
120 W
Posizioni comuni Intel Core i5-1235U CPU in benchmark popolari, per un confronto con altri modelli.
Motivi da considerare Velocità di clock più alta
Intorno a 223% migliore velocità di clock
1.30 GHz
Velocità di clock turbo più alta
Intorno a 14 % higher specified turbo frequency
4.40 GHz
Posizioni comuni AMD Ryzen 7 7800X3D CPU in benchmark popolari, per un confronto con altri modelli.
Intel Core i5-1235U
Informazioni di base sui processori a confronto, serie, generazione e segmento di mercato.
 AMD Ryzen 7000
Ryzen
6
AMD Ryzen 7 5800X3D
Desktop
Desktops / Boxed Processor
Ryzen 7000 Series
Core counts, threads, cache and clock modes describe the CPU configuration. Performance depends on the workload and comparable measured results.
-
-
4.2 GHz
normal
8
16
Sì
Sì
5.6 GHz
-
8x
5 GHz
5.4 GHz
La grafica interna non influisce sulle prestazioni della CPU, ma svolge il lavoro della scheda grafica in sua assenza o su dispositivi mobili.
12
2
9
2200 MHz
AMD Radeon Graphics
2200 MHz
3
8 GB
Q3/2022
128
5 nm
2
Codec integrati utilizzati per codificare e decodificare i contenuti. Velocizza notevolmente le operazioni richieste.
No
Decode / Encode
Decode / Encode
Decode / Encode
Decode / Encode
Decode
Decode / Encode
Decode / Encode
Tipi, quantità di canali di RAM supportati da AMD Ryzen 7 7800X3D e Intel Core i5-1235U. A seconda delle schede madri, possono essere supportate frequenze di memoria più alte o più basse.
Sì
128 GB
2
DDR5
PCIe 5.0
83.2 GB/s
Sì
Confrontare i requisiti TDP di TDP Intel Core i5-1235U e AMD Ryzen 7 7800X3D Power specifications describe different manufacturer limits. TDP, base power and maximum turbo power are separate values; they do not establish measured system consumption.
89 °C
170 W
230 W
120 W
Architettura, interfacce, istruzioni aggiuntive supportate da Intel Core i5-1235U e AMD Ryzen 7 7800X3D, tecnologie per macchine virtuali e tecnologia di processo.
Raphael (Zen 4)
x86-64 (64 bit)
SSE4a, SSE4.1, SSE4.2,FMA3, AVX2, AVX512
8 MB
96 MB
2023-04-06
AM5
TSMC 5nm FinFET
AMD-V, SVM
Chiplet
Raphael AM5
Windows 10, Windows 11, Linux
Shared tests with results for both models: 10
Each row uses one Blender version, operating system and compute backend.
| Test and settings | Intel Core i5-1235U | AMD Ryzen 7 7800X3D | Result difference¹ |
|---|---|---|---|
| Blender 5.2.0 / CPU / Windows | 54.33796 samples/min Submissions: 5 | 292.687665 samples/min Submissions: 56 | +438.6 % |
| Blender 5.1.1 / CPU / Windows | 76.352364 samples/min Submissions: 7 | 293.059443 samples/min Submissions: 72 | +283.8 % |
| Blender 4.5.0 / CPU / Linux | 47.372177 samples/min Submissions: 5 | 318.901589 samples/min Submissions: 58 | +573.2 % |
| Blender 4.5.0 / CPU / Windows | 62.248659 samples/min Submissions: 14 | 262.013881 samples/min Submissions: 304 | +320.9 % |
| Blender 4.4.0 / CPU / Linux | 43.523777 samples/min Submissions: 7 | 302.968143 samples/min Submissions: 17 | +596.1 % |
| Blender 4.4.0 / CPU / Windows | 63.495331 samples/min Submissions: 13 | 255.841339 samples/min Submissions: 169 | +302.9 % |
| Blender 4.3.0 / CPU / Windows | 68.864953 samples/min Submissions: 30 | 252.365344 samples/min Submissions: 333 | +266.5 % |
| Blender 4.2.0 / CPU / Windows | 62.385861 samples/min Submissions: 20 | 255.855441 samples/min Submissions: 410 | +310.1 % |
| Blender 4.1.0 / CPU / Windows | 69.891565 samples/min Submissions: 20 | 264.848985 samples/min Submissions: 310 | +278.9 % |
| Blender 4.0.0 / CPU / Windows | 69.294435 samples/min Submissions: 17 | 265.58705 samples/min Submissions: 555 | +283.3 % |
¹ Difference of the second result relative to the first in that row. No percentage is calculated for different upscaling algorithms. This compares published results, not a universal performance index.
These results have no shared test of both models with the same version and settings. They are shown separately without a percentage difference.
Published measurements are separate from the archived index. Incomplete conditions and unknown run counts do not support ranking positions or calculated performance differences.
| Model | Test | Result | Reported conditions |
|---|---|---|---|
| AMD Ryzen 7 7800X3D | Cinebench R15 / multi-core | 2974 points | Graphics card: GeForce RTX 4090 System RAM: 32 GB |
| AMD Ryzen 7 7800X3D | Cinebench R15 / single-core | 291 points | Graphics card: GeForce RTX 4090 System RAM: 32 GB |
| AMD Ryzen 7 7800X3D | Cinebench R20 / multi-core | 7121 points | Graphics card: GeForce RTX 4090 System RAM: 32 GB |
| AMD Ryzen 7 7800X3D | Cinebench R20 / single-core | 709 points | Graphics card: GeForce RTX 4090 System RAM: 32 GB |
| AMD Ryzen 7 7800X3D | Cinebench R23 / multi-core | 18086 points | Graphics card: GeForce RTX 4090 System RAM: 32 GB |
| AMD Ryzen 7 7800X3D | Cinebench R23 / single-core | 1820 points | Graphics card: GeForce RTX 4090 System RAM: 32 GB |
Results were obtained on the reported systems. Test versions and settings remain separate; incomplete conditions do not support calculated model performance differences.
| Model | Result | Reported conditions |
|---|---|---|
| AMD Ryzen 7 7800X3D | 11512.514103 H/s | RandomX / XMRig 6.26.0 / 1M / 16 threads / windows System RAM: 32 GB OS: Windows NT 10.0 Motherboard: Gigabyte Technology Co., Ltd. / B650E AORUS ELITE X AX ICE Duration: 86.862 s User-submitted run; tuning and power settings are incomplete. |
| Model | Result | Reported conditions |
|---|---|---|
| Intel Core i5-1235U | 1042.451763 H/s | RandomX / XMRig 6.26.0 / 1M / 9 threads / windows System RAM: 8 GB OS: Windows NT 10.0 Duration: 959.277 s User-submitted run; tuning and power settings are incomplete. |
Sulla base dei risultati di diversi benchmark, è possibile stimare con maggiore precisione la differenza di prestazioni tra Intel Core i5-1235U e AMD Ryzen 7 7800X3D.
Confrontate i valori dei test sintetici e scegliete il processore migliore!
These are saved results from the earlier catalog. Measurement dates and test configurations were not recorded. Models with no comparable results are omitted.
Recent models: test results with identified primary sources — Cinebench R23 · Cinebench R20 · Cinebench R15 · Cinebench 2026 · RandomX benchmark
Higher values are better in this metric.


 English
 Russian
 German
 Portuguese
 French
 Japan
 Spanish
 Polish
 Chinese
 Korean