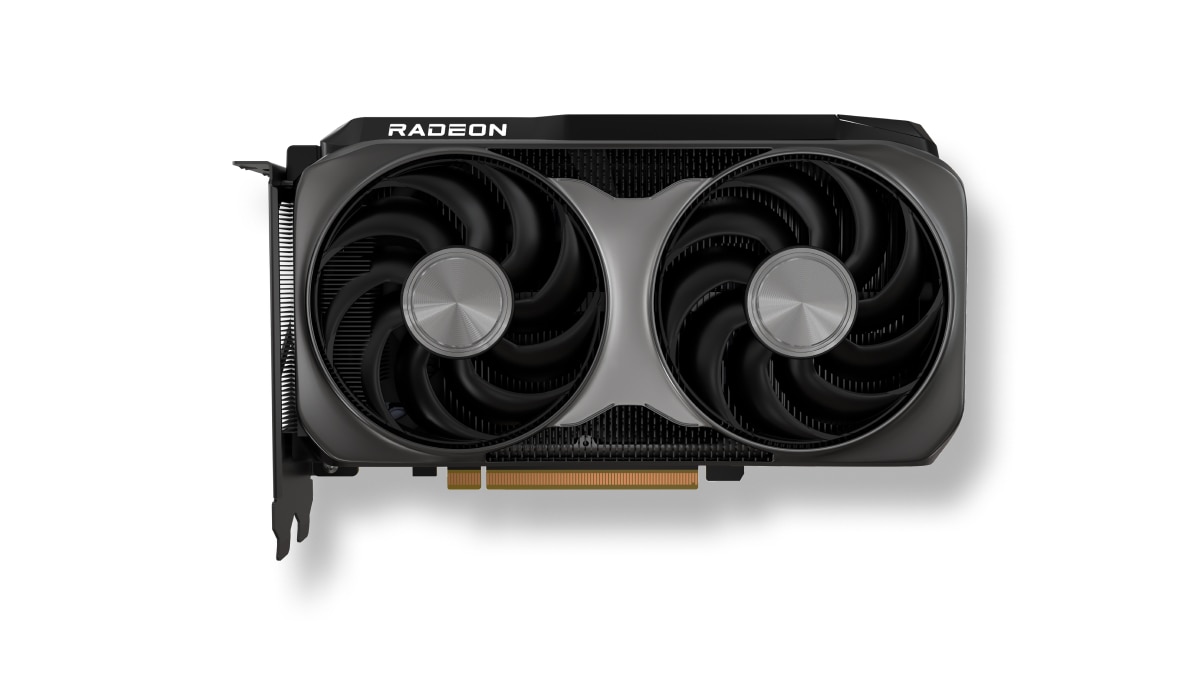

What's the best choice Biostar Radeon RX Vega 56 8G or GIGABYTE Radeon RX Vega 56 8G? Which graphics card is faster?
We have prepared a comparison to help you choose the best graphics card. Compare their specifications and benchmarks.
Biostar Radeon RX Vega 56 8G has a base frequency of 1.156 GHz. Memory size 8 GB. Memory type HBM2. Released in Q3/2017.
GIGABYTE Radeon RX Vega 56 8G has a base frequency of 1.156 GHz. Memory size 8 GB. Memory type HBM2. Released in Q3/2017.
Reasons to consider Place in the overall ranking
(based on several benchmarks)
 place
place
Common positions Biostar Radeon RX Vega 56 8G GPU in popular benchmarks, for comparison with other models.
Reasons to consider Place in the overall ranking
(based on several benchmarks)
place
Common positions GIGABYTE Radeon RX Vega 56 8G GPU in popular benchmarks, for comparison with other models.
Biostar Radeon RX Vega 56 8G
Comparison of basic technical data of graphics cards Biostar Radeon RX Vega 56 8G and GIGABYTE Radeon RX Vega 56 8G, chip, information processing units.
 AMD RX Vega 56
56
Vega 10 XL
64
3584
256
AMD RX Vega 56
56
Vega 10 XL
64
3584
256
Video memory capacity, type, bus width and bandwidth describe different properties. These values alone do not determine graphics performance.
410 GB/s
2048 bit
8 GB
800 MHz
HBM2
Published GPU clock frequencies describe different operating modes. Clock speed alone does not determine graphics performance.
1156 MHz
1471 MHz
-
Yes
Graphics card power limits and recommended system power supply describe different specifications.
-
210 W
-
Types and sizes of coolers for graphics card cooling system Biostar Radeon RX Vega 56 8G and GIGABYTE Radeon RX Vega 56 8G.
Air cooling
Radial
1 x 70 mm
-
37 dB
49 dB
Connectivity and connections.
3 × DisplayPort 1.4
-
-
1 × HDMI 2.0b
4
PCIe 3.0 x16
2 x 8-Pin
-
-
Technical data that is used to its full potential in computer games.
12_1
No
No LED lighting
7680 × 4320
No
Built-in support for video and image compression standards.
No
Decode / Encode
Decode / Encode
Decode
Decode / Encode
The difference in size, weight and slot of the compared devices
127 mm
280 mm
2 PCIe-Slots
1090 g
40 mm
Comparison of interfaces and release dates for GPU GIGABYTE Radeon RX Vega 56 8G and Biostar Radeon RX Vega 56 8G.
data sheet
-
-
14 nm
Q3/2017
Based on the results of several popular benchmarks, you can more accurately estimate the performance difference between Biostar Radeon RX Vega 56 8G and GIGABYTE Radeon RX Vega 56 8G.
Compare synthetic benchmarks and choose the best graphics card for you!
These are saved results from the earlier catalog. Measurement dates and test configurations were not recorded. Models with no comparable results are omitted.
Recent models: test results with identified primary sources — Game frame rates
Archived results. The original measurement method and test conditions have not been verified.
Higher values are better in this metric.
Higher values are better in this metric.
Higher values are better in this metric.
Higher values are better in this metric.
Higher values are better in this metric.
Higher values are better in this metric.
Higher values are better in this metric.
Higher values are better in this metric.


 Russian
 German
 Portuguese
 Italian
 French
 Japan
Japan Spanish
 Polish
 Chinese
 Korean