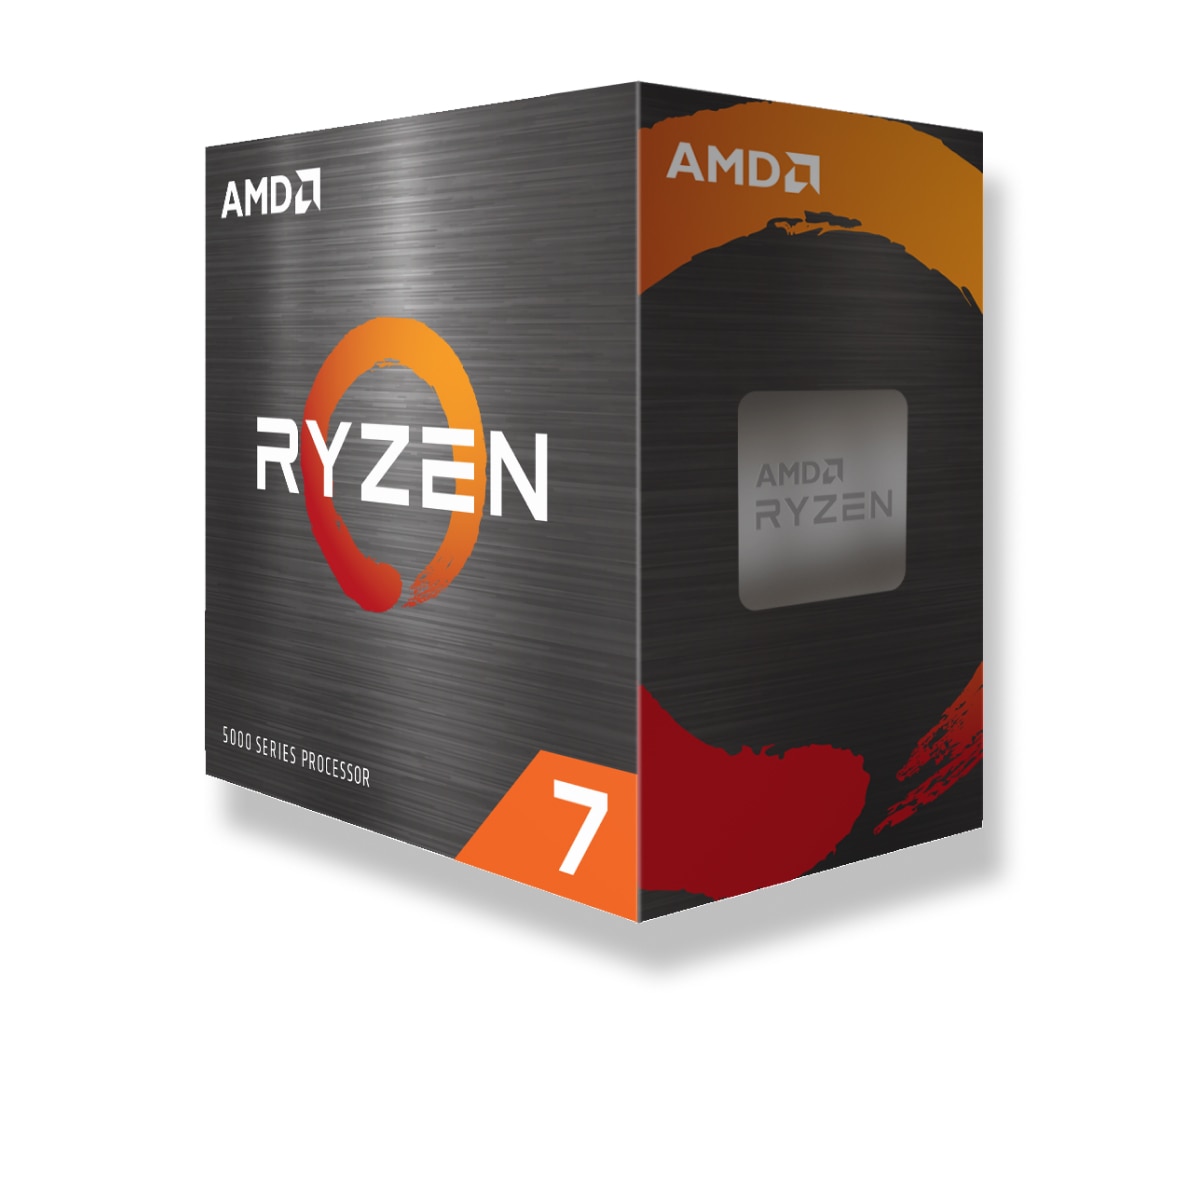
AMD E1-6010
AMD A6-6400K
Select video card 1
Select video card 2

AMD E1-6010 vs AMD A6-6400K. Specifications, performance, tests

User rating
star star star star star
Released
Q2/2014
AMD E1-6010
AMD E1-6010
Released
Q2/2013
User rating
star star star star star
AMD A6-6400K
AMD A6-6400K

What's the best choice AMD E1-6010 or AMD A6-6400K? Which processor is faster?

We have prepared a comparison to help you choose the best processor. Compare their specifications and benchmarks.

AMD E1-6010 has a base frequency of 1.35 GHz. 2 CPU Cores / Threads. Stated TDP / base power 10 W. Released in Q2/2014.

AMD A6-6400K has a base frequency of 3.90 GHz. 2 CPU Cores / Threads. Stated TDP / base power 65 W. Released in Q2/2013.

Differences

AMD E1-6010 Reasons to consider
AMD E1-6010
Report a bug
  • Lower stated TDP / base power

    Power limits alone do not measure performance per watt.

    10 W left arrow 65 W

Positions in all rankings

Common positions AMD E1-6010 CPU in popular benchmarks, for comparison with other models.

  • Cinebench R15 (Single-Core)
    1039 place
  • Cinebench R15 (Multi-Core)
    1038 place
  • Geekbench 5, 64bit (Single-Core)
    1269 place
  • Geekbench 5, 64bit (Multi-Core)
    1274 place
  • iGPU - FP32 Performance (Single-precision GFLOPS)
    1546 place
  • Geekbench 3, 64bit (Single-Core)
    890 place
  • Geekbench 3, 64bit (Multi-Core)
    895 place
  • Cinebench R11.5, 64bit (Single-Core)
    795 place
  • Cinebench R11.5, 64bit (Multi-Core)
    811 place
  • Estimated results for PassMark CPU Mark
    1177 place
AMD A6-6400K Reasons to consider
AMD A6-6400K
Report a bug
  • Higher clock speed

    Around 189% better clock speed

    3.90 GHz left arrow 1.35 GHz

Positions in all rankings

Common positions AMD A6-6400K CPU in popular benchmarks, for comparison with other models.

  • Cinebench R20 (Multi-Core)
    485 place
  • Geekbench 5, 64bit (Single-Core)
    995 place
  • Geekbench 5, 64bit (Multi-Core)
    1168 place
  • iGPU - FP32 Performance (Single-precision GFLOPS)
    1093 place
  • Geekbench 3, 64bit (Single-Core)
    610 place
  • Geekbench 3, 64bit (Multi-Core)
    747 place
  • Cinebench R11.5, 64bit (Single-Core)
    668 place
  • Cinebench R11.5, 64bit (Multi-Core)
    731 place
  • Estimated results for PassMark CPU Mark
    977 place

Specifications

Technical data
AMD E1-6010 AMD E1-6010
AMD A6-6400K AMD A6-6400K
CPU family and group

Background information about the processors being compared, series, generation and market segment.

  • CPU group
    AMD E1/E2-6000 left arrow AMD A6-6000
  • Family
    AMD E left arrow AMD A
  • Generation
    4 left arrow 3
  • Segment
    Mobile left arrow Desktop / Server
CPU Technical specs

Core counts, threads, cache and clock modes describe the CPU configuration. Performance depends on the workload and comparable measured results.

  • Base Frequency
    1.35 GHz left arrow 3.9 GHz
  • Core architecture
    normal left arrow normal
  • CPU Cores
    2 left arrow 2
  • CPU Threads
    2 left arrow 2
  • Hyperthreading / SMT
    No left arrow No
  • Overclocking
    No left arrow Yes
  • Turbo Frequency (1 Core)
    No turbo left arrow 4.1 GHz
  • Turbo Frequency (2 Cores)
    No turbo left arrow 4.1 GHz
IGPU

Internal Graphics does not affect the performance of the CPU, performs the work of the graphics card in its absence or on mobile devices.

  • DirectX Version
    12 left arrow 11.2
  • Execution units
    2 left arrow 3
  • Generation
    6 left arrow 5
  • GPU Frequency
    350 MHz left arrow 800 MHz
  • GPU name
    AMD Radeon R2 (Beema) left arrow AMD Radeon HD 8470D
  • GPU Turbo
    No turbo left arrow No turbo
  • Max. displays
    2 left arrow 2
  • Max. GPU Memory
    2 GB left arrow 2 GB
  • Release date
    Q1/2015 left arrow Q2/2013
  • Shader
    128 left arrow 192
  • Technology
    28 nm left arrow 32 nm
Hardware codec support

Built-in codecs used to encode and decode content. Significantly speeds up the required operations.

  • AV1
    No left arrow No
  • H.264 / AVC
    Decode left arrow Decode
  • h265 / HEVC (8 bit)
    No left arrow No
  • h265 / HEVC (10 bit)
    No left arrow No
  • JPEG
    Decode / Encode left arrow Decode / Encode
  • VC-1
    Decode left arrow Decode
  • VP8
    No left arrow No
  • VP9
    No left arrow No
Memory specs & PCI

Types, channel quantity of RAM supported by AMD A6-6400K and AMD E1-6010. Depending on the motherboards, higher or lower memory frequencies may be supported.

  • ECC
    No left arrow No
  • Memory channels
    1 left arrow 2
  • Memory type
    DDR3L-1333 SO-DIMM left arrow DDR3-1866
Encryption
  • AES-NI
    Yes left arrow Yes
Thermal Management

Compare the TDP requirements of TDP AMD E1-6010 and AMD A6-6400K Power specifications describe different manufacturer limits. TDP, base power and maximum turbo power are separate values; they do not establish measured system consumption.

  • TDP (PL1, legacy label)
    10 W left arrow 65 W
Technologies and extensions

Architecture, interfaces, additional instructions supported by AMD E1-6010 and AMD A6-6400K, virtual machine technologies and process technology.

  • Architecture
    Beema (Puma) left arrow Richland (Piledriver)
  • Instruction set (ISA)
    x86-64 (64 bit) left arrow x86-64 (64 bit)
  • ISA extensions
    SSE4a, SSE4.1, SSE4.2, AVX left arrow SSE4a, SSE4.1, SSE4.2, AVX, FMA3, FMA4
  • L3-Cache
    1 MB left arrow 1 MB
  • Release date
    Q2/2014 left arrow Q2/2013
  • Socket
    AM1 left arrow FM2
  • Technology
    28 nm left arrow 32 nm
  • Virtualization
    AMD-V left arrow AMD-V

Benchmarks

Performance tests CPUs

Based on the results of several benchmarks, you can more accurately estimate the difference in performance between AMD E1-6010 and AMD A6-6400K.

Compare the synthetic test values and choose the best processor!

These are saved results from the earlier catalog. Measurement dates and test configurations were not recorded. Models with no comparable results are omitted.

Recent models: test results with identified primary sources — Cinebench R23 · Cinebench R20 · Cinebench R15 · Cinebench 2026 · RandomX benchmark

Geekbench 5, 64bit (Single-Core)
Geekbench 5 SC is a popular cross-platform performance test for desktop or mobile processors that uses system memory intensively

Higher values are better in this metric.

143.000000
AMD E1-6010
471.000000
AMD A6-6400K
Geekbench 5, 64bit (Multi-Core)
Geekbench 5 MC is a popular cross-platform performance test for desktop or mobile processors that uses system memory intensively

Higher values are better in this metric.

261.000000
AMD E1-6010
723.000000
AMD A6-6400K
iGPU - FP32 Performance (Single-precision GFLOPS)
The performance of the iGPU - the internal GPU in games

Higher values are better in this metric.

90.000000
AMD E1-6010
307.000000
AMD A6-6400K
Geekbench 3, 64bit (Single-Core)
Geekbench 3 SC for one CPU core, includes stress tests simulating real 3D scenarios for Windows, Mac, Linux, Ansroid, iOS

Higher values are better in this metric.

698.000000
AMD E1-6010
2063.000000
AMD A6-6400K
Geekbench 3, 64bit (Multi-Core)
Geekbench 3 MC using a multi-core and hyperthreading, includes stress tests simulating real 3D scenarios for Windows, Mac, Linux, Ansroid, iOS

Higher values are better in this metric.

1134.000000
AMD E1-6010
3292.000000
AMD A6-6400K
Cinebench R11.5, 64bit (Single-Core)
The PC CPU and GPU test involves rendering a specific 3D scene in single-core mode, based on CINEMA 4D

Higher values are better in this metric.

0.310000
AMD E1-6010
0.830000
AMD A6-6400K
Cinebench R11.5, 64bit (Multi-Core)
The PC CPU and GPU test involves rendering a specific 3D scene in multi-core mode and hyperthreading, based on CINEMA 4D

Higher values are better in this metric.

0.610000
AMD E1-6010
1.660000
AMD A6-6400K
Estimated results for PassMark CPU Mark
PassMark is a test suite that performs complex mathematical calculations to determine CPU performance on file compression, encryption and physics-related tasks

Higher values are better in this metric.

885.000000
AMD E1-6010
2397.000000
AMD A6-6400K

Latest comparisons