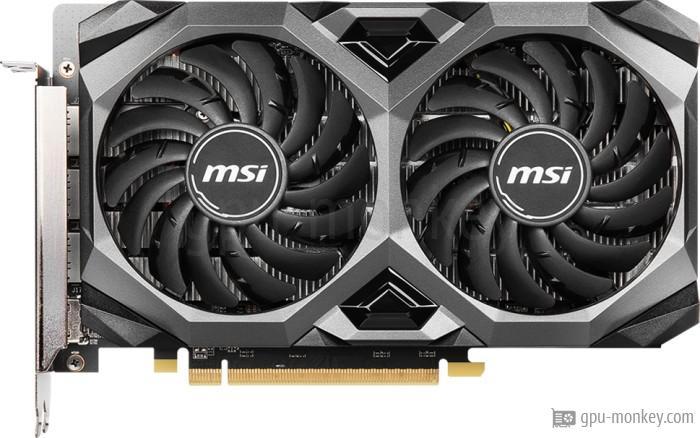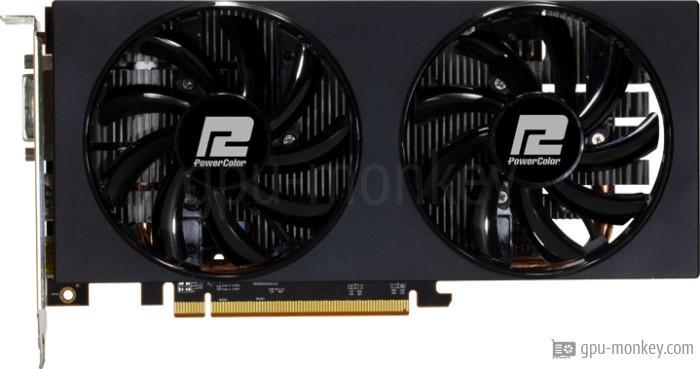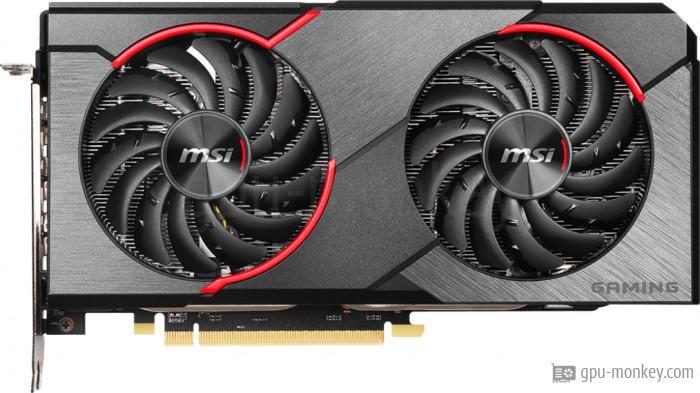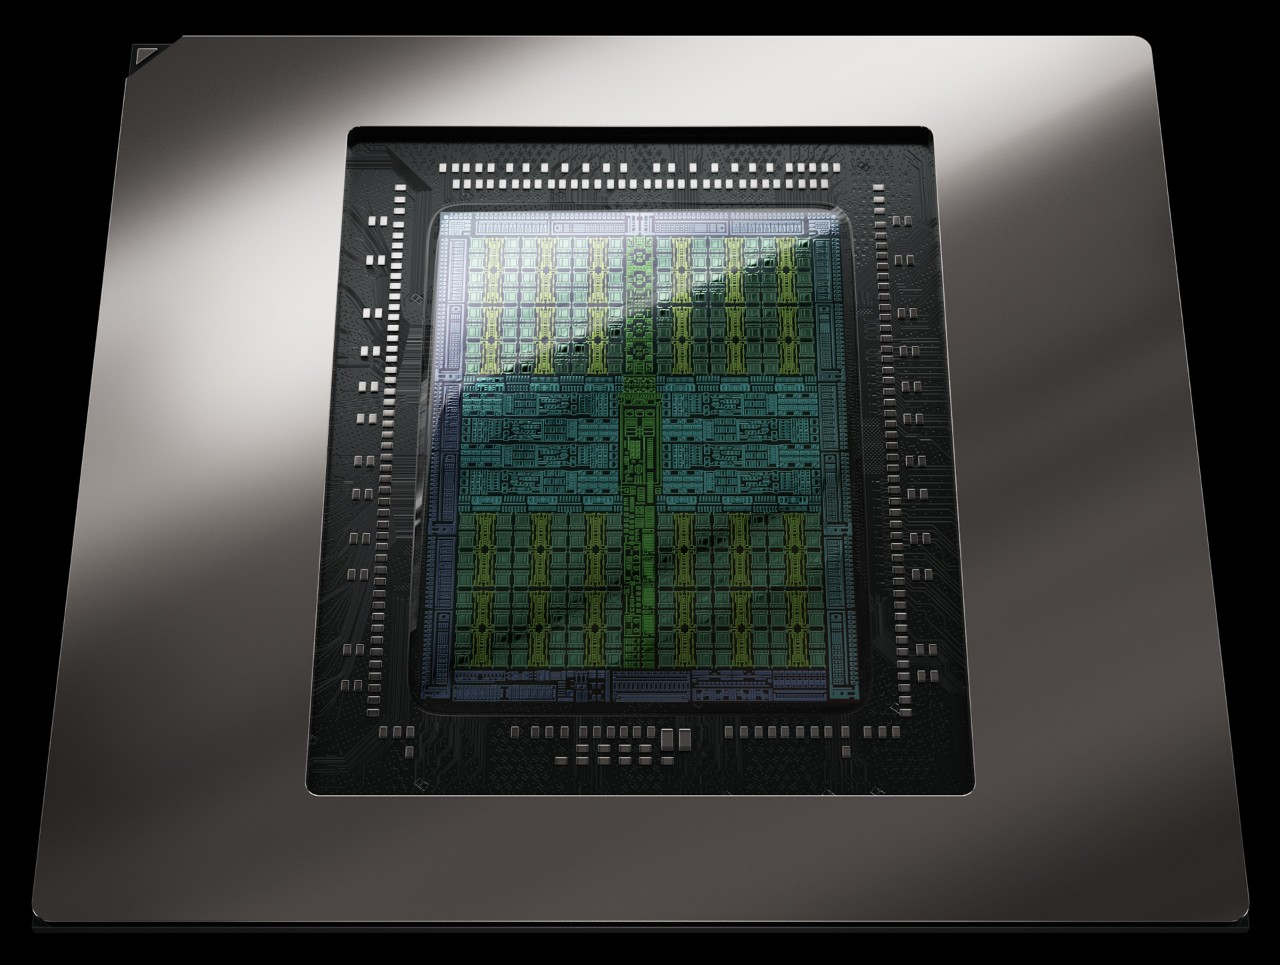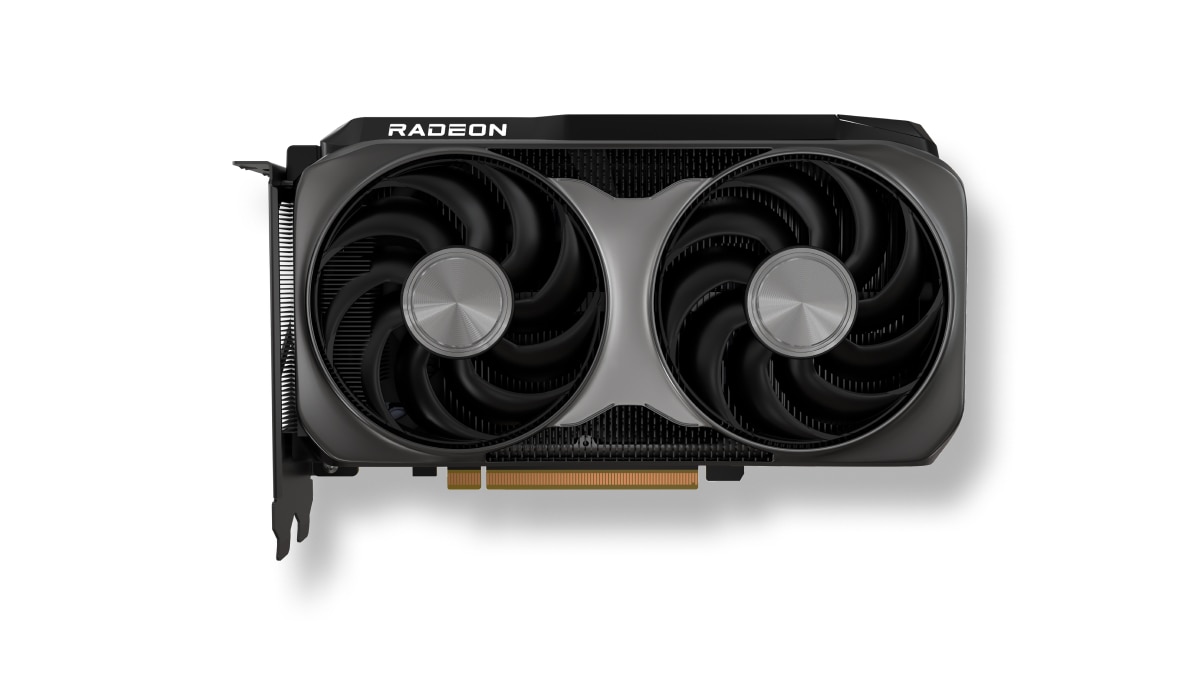
Posições comuns MSI Radeon RX 5500 XT Mech 4G OC GPU em referências populares, para comparação com outros modelos.
Board specifications and benchmark results are specific to each version.
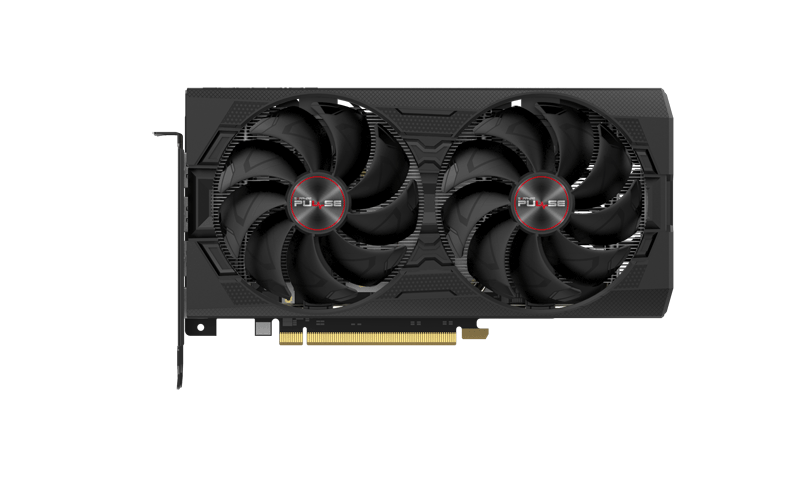 SAPPHIRE PULSE RX 5500 XT 4G GDDR6 4GB
Sapphire · 4 GB
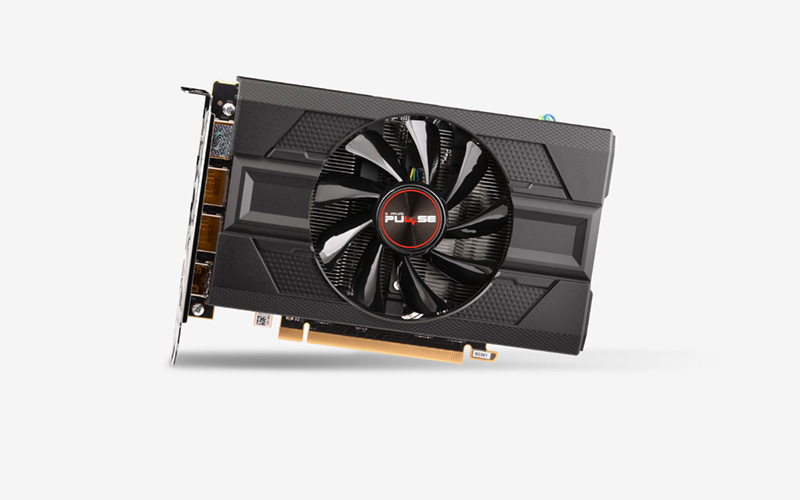 SAPPHIRE PULSE RX 5500 XT SF 4G GDDR6 4GB
Sapphire · 4 GB
Published results: 2
Each row is a separate graphics subtest. Scores are not game FPS.
| Test and settings | MSI Radeon RX 5500 XT Mech 4G OC |
|---|---|
| 3DMark – Time Spy — Graphics Score / DirectX 12 | 5016 points Base GPU test: AMD Radeon RX 5500 XT 4 GB VRAM: 4 GBTest CPU: AMD Ryzen 9 7950X3DOS: Windows 11Graphics API: DirectX 12HVCI: enabledApplication version unreported |
| 3DMark – Steel Nomad — Steel Nomad Score / DirectX 12 | 432 points Base GPU test: AMD Radeon RX 5500 XT 4 GB VRAM: 4 GBOS: Windows 11Graphics API: DirectX 12HVCI: enabledApplication version unreported |
A base GPU test is a reference for cards using that GPU and the same memory capacity. Board overclocking, cooling and power limits can change the result.
Comparar as pontuações dos pontos de referência populares MSI Radeon RX 5500 XT Mech 4G OC com outras placas gráficas para compreender a velocidade real da GPU ao processar o conteúdo.
Os testes incluem trabalho com ponto flutuante, criação de modelos 3D, moedas criptográficas de mineração.
These are saved results from the earlier catalog. Measurement dates and test configurations were not recorded. Models with no comparable results are omitted.
Recent models: test results with identified primary sources — Game frame rates
Archived results. The original measurement method and test conditions have not been verified.
Higher values are better in this metric.
Higher values are better in this metric.
Higher values are better in this metric.
Higher values are better in this metric.
Higher values are better in this metric.
Higher values are better in this metric.
Higher values are better in this metric.
Higher values are better in this metric.
These are saved results from the earlier catalog. Measurement dates and test configurations were not recorded. Models with no comparable results are omitted. Index 0–100: equal-weight mean of each score relative to the best saved score among models with both tests. Tests: Battlefield 5 + Shadow of the Tomb Raider. This index does not predict performance in every workload.
Recent models: test results with identified primary sources — Game frame rates
*
Base Clock is the base GPU frequency stated by the manufacturer for this model.
Boost Clock describes automatic frequency increases. Actual clock speed varies with workload, temperature and power limits; it is not a guarantee of manual overclocking.


 English
 Russian
 German
 Italian
 French
 Japan
Japan Spanish
 Polish
 Chinese
 Korean