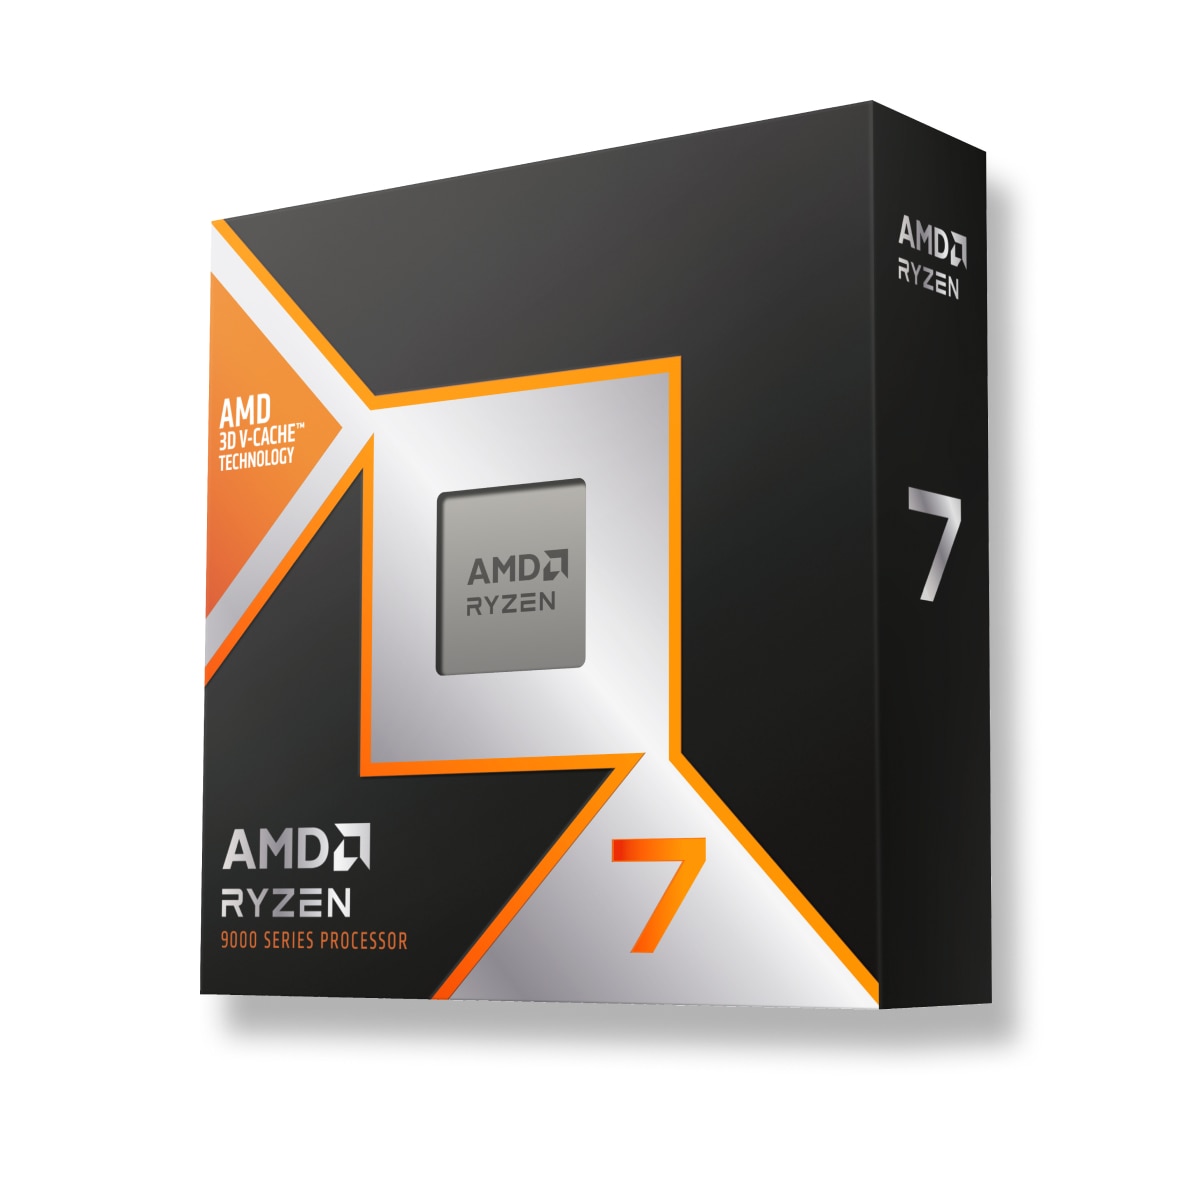


Qual é a melhor escolha AMD Ryzen 7 7800X3D ou Intel Core i9-13900HX? Qual é o processador mais rápido?
Preparámos uma comparação para o ajudar a escolher o melhor processador. Comparar as suas especificações e padrões de referência.
AMD Ryzen 7 7800X3D has a base frequency of 4.2 GHz. 8 / 16 CPU Cores / Threads. Stated TDP / base power 120 W. Lançado em 2023-04-06.
Intel Core i9-13900HX has a base frequency of 2.00 GHz (5.40 GHz). 24 / 32 CPU Cores / Threads. Stated TDP / base power 55 W. Lançado em Q1/2023.
Razões a considerar Posições comuns AMD Ryzen 7 7800X3D CPU em padrões de referência populares, para comparação com outros modelos.
Razões a considerar Mais número de núcleos
16 more cores
 8
Lower stated TDP / base power
Power limits alone do not measure performance per watt.
120 W
Posições comuns Intel Core i9-13900HX CPU em padrões de referência populares, para comparação com outros modelos.
AMD Ryzen 7 7800X3D
Informação de base sobre os processadores a serem comparados, séries, geração e segmento de mercado.
 Intel Core i 13000H
Intel Core i9
-
13
Intel Core i9-12900HX
Mobile
-
Core counts, threads, cache and clock modes describe the CPU configuration. Performance depends on the workload and comparable measured results.
-
hybrid (big.LITTLE)
-
24
32
Sim
-
Não
-
-
8x Raptor Cove
2.00 GHz (5.40 GHz)
16x Gracemont
1.80 GHz (3.90 GHz)
A placa gráfica interna não afecta o desempenho da CPU, realiza o trabalho da placa gráfica na sua ausência ou em dispositivos móveis.
12
32
11
300 MHz
Intel UHD Graphics 770
1500 MHz
-
3
64 GB
Q4/2021
256
10 nm
Codecs incorporados utilizados para codificar e descodificar o conteúdo. Acelera significativamente as operações necessárias.
Decode
Decode / Encode
Decode / Encode
Decode / Encode
Decode / Encode
Decode
Decode / Encode
Decode / Encode
Tipos, quantidade de canais de RAM suportados por Intel Core i9-13900HX e AMD Ryzen 7 7800X3D. Dependendo das placas-mãe, podem ser suportadas frequências de memória mais altas ou mais baixas.
Sim
128 GB
89.6 GB/s
2 (Dual Channel)
DDR4-3200DDR5-5600LPDDR4X-4266LPDDR5-5200
5.0 x 20
Sim
Comparar os requisitos de TDP do TDP AMD Ryzen 7 7800X3D e Intel Core i9-13900HX Power specifications describe different manufacturer limits. TDP, base power and maximum turbo power are separate values; they do not establish measured system consumption.
-
100 °C
55 W
157 W
45 W
86 W
Arquitectura, interfaces, instruções adicionais suportadas por AMD Ryzen 7 7800X3D e Intel Core i9-13900HX, tecnologias de máquinas virtuais e tecnologia de processos.
Raptor Lake H
Monolithic
-
x86-64 (64 bit)
SSE4.1, SSE4.2, AVX2, AVX2+
32 MB
36 MB
Windows 10, Windows 11, Linux
Q1/2023
BGA 1744
10 nm
VT-x, VT-x EPT, VT-d
Shared tests with results for both models: 12
Each row uses one Blender version, operating system and compute backend.
| Test and settings | AMD Ryzen 7 7800X3D | Intel Core i9-13900HX | Result difference¹ |
|---|---|---|---|
| Blender 5.2.0 / CPU / Windows | 291.925091 samples/min Submissions: 71 | 377.58323 samples/min Submissions: 9 | +29.3 % |
| Blender 5.1.1 / CPU / Linux | 308.852511 samples/min Submissions: 16 | 426.53273 samples/min Submissions: 5 | +38.1 % |
| Blender 5.1.1 / CPU / Windows | 293.059443 samples/min Submissions: 72 | 291.153005 samples/min Submissions: 7 | -0.7 % |
| Blender 5.1.0 / CPU / Windows | 289.884349 samples/min Submissions: 32 | 358.271086 samples/min Submissions: 9 | +23.6 % |
| Blender 4.5.0 / CPU / Linux | 318.901589 samples/min Submissions: 58 | 434.178371 samples/min Submissions: 32 | +36.1 % |
| Blender 4.5.0 / CPU / Windows | 262.013881 samples/min Submissions: 304 | 347.602066 samples/min Submissions: 73 | +32.7 % |
| Blender 4.4.0 / CPU / Windows | 255.841339 samples/min Submissions: 169 | 330.685394 samples/min Submissions: 25 | +29.3 % |
| Blender 4.3.0 / CPU / Windows | 252.365344 samples/min Submissions: 333 | 294.767578 samples/min Submissions: 62 | +16.8 % |
| Blender 4.2.0 / CPU / Windows | 255.855441 samples/min Submissions: 410 | 320.871804 samples/min Submissions: 57 | +25.4 % |
| Blender 4.1.0 / CPU / Windows | 264.848985 samples/min Submissions: 310 | 313.229039 samples/min Submissions: 48 | +18.3 % |
| Blender 4.0.0 / CPU / Linux | 324.125082 samples/min Submissions: 44 | 395.004333 samples/min Submissions: 8 | +21.9 % |
| Blender 4.0.0 / CPU / Windows | 265.58705 samples/min Submissions: 555 | 361.636386 samples/min Submissions: 88 | +36.2 % |
¹ Difference of the second result relative to the first in that row. No percentage is calculated for different upscaling algorithms. This compares published results, not a universal performance index.
These results have no shared test of both models with the same version and settings. They are shown separately without a percentage difference.
Published measurements are separate from the archived index. Incomplete conditions and unknown run counts do not support ranking positions or calculated performance differences.
| Model | Test | Result | Reported conditions |
|---|---|---|---|
| AMD Ryzen 7 7800X3D | Cinebench R15 / multi-core | 2974 points | Graphics card: GeForce RTX 4090 System RAM: 32 GB |
| AMD Ryzen 7 7800X3D | Cinebench R15 / single-core | 291 points | Graphics card: GeForce RTX 4090 System RAM: 32 GB |
| AMD Ryzen 7 7800X3D | Cinebench R20 / multi-core | 7121 points | Graphics card: GeForce RTX 4090 System RAM: 32 GB |
| AMD Ryzen 7 7800X3D | Cinebench R20 / single-core | 709 points | Graphics card: GeForce RTX 4090 System RAM: 32 GB |
| AMD Ryzen 7 7800X3D | Cinebench R23 / multi-core | 18086 points | Graphics card: GeForce RTX 4090 System RAM: 32 GB |
| AMD Ryzen 7 7800X3D | Cinebench R23 / single-core | 1820 points | Graphics card: GeForce RTX 4090 System RAM: 32 GB |
Results were obtained on the reported systems. Test versions and settings remain separate; incomplete conditions do not support calculated model performance differences.
| Model | Result | Reported conditions |
|---|---|---|
| Intel Core i9-13900HX | 1675 points | System: Schenker XMG Focus 17 M25 CPU / power label: i9-13900HX 150 W / 135 W Graphics: GeForce RTX 5070 Ti Laptop 140 W 12 GB RAM: 32 GB Exact test build and complete conditions are unreported; no ranking position. |
| Model | Result | Reported conditions |
|---|---|---|
| Intel Core i9-13900HX | 121.4 points | System: Schenker XMG Focus 17 M25 CPU / power label: i9-13900HX 150 W / 135 W Graphics: GeForce RTX 5070 Ti Laptop 140 W 12 GB RAM: 32 GB Exact test build and complete conditions are unreported; no ranking position. |
| Model | Result | Reported conditions |
|---|---|---|
| AMD Ryzen 7 7800X3D | 10164.770937 H/s | RandomX / XMRig 6.26.0 / 1M / 16 threads / windows System RAM: 96 GB OS: Windows NT 10.0 Motherboard: Gigabyte Technology Co., Ltd. / B650I AORUS ULTRA Duration: 98.379 s User-submitted run; tuning and power settings are incomplete. |
| Model | Result | Reported conditions |
|---|---|---|
| Intel Core i9-13900HX | 9669.926721 H/s | RandomX / XMRig 6.25.0 / 10M / 32 threads / windows System RAM: 32 GB OS: Windows NT 10.0 Duration: 1034.134 s User-submitted run; tuning and power settings are incomplete. |
| Model | Result | Reported conditions |
|---|---|---|
| Intel Core i9-13900HX | 29376 points | System: Schenker XMG Focus 17 M25 CPU / power label: i9-13900HX 150 W / 135 W Graphics: GeForce RTX 5070 Ti Laptop 140 W 12 GB RAM: 32 GB Exact test build and complete conditions are unreported; no ranking position. |
| Model | Result | Reported conditions |
|---|---|---|
| Intel Core i9-13900HX | 2057 points | System: Schenker XMG Focus 17 M25 CPU / power label: i9-13900HX 150 W / 135 W Graphics: GeForce RTX 5070 Ti Laptop 140 W 12 GB RAM: 32 GB Exact test build and complete conditions are unreported; no ranking position. |
| Model | Result | Reported conditions |
|---|---|---|
| Intel Core i9-13900HX | 11164 points | System: Schenker XMG Focus 17 M25 CPU / power label: i9-13900HX 150 W / 135 W Graphics: GeForce RTX 5070 Ti Laptop 140 W 12 GB RAM: 32 GB Exact test build and complete conditions are unreported; no ranking position. |
| Model | Result | Reported conditions |
|---|---|---|
| Intel Core i9-13900HX | 790 points | System: Schenker XMG Focus 17 M25 CPU / power label: i9-13900HX 150 W / 135 W Graphics: GeForce RTX 5070 Ti Laptop 140 W 12 GB RAM: 32 GB Exact test build and complete conditions are unreported; no ranking position. |
| Model | Result | Reported conditions |
|---|---|---|
| Intel Core i9-13900HX | 4502 points | System: Schenker XMG Focus 17 M25 CPU / power label: i9-13900HX 150 W / 135 W Graphics: GeForce RTX 5070 Ti Laptop 140 W 12 GB RAM: 32 GB Exact test build and complete conditions are unreported; no ranking position. |
| Model | Result | Reported conditions |
|---|---|---|
| Intel Core i9-13900HX | 299 points | System: Schenker XMG Focus 17 M25 CPU / power label: i9-13900HX 150 W / 135 W Graphics: GeForce RTX 5070 Ti Laptop 140 W 12 GB RAM: 32 GB Exact test build and complete conditions are unreported; no ranking position. |
Com base nos resultados de vários parâmetros de referência, é possível estimar com maior precisão a diferença de desempenho entre AMD Ryzen 7 7800X3D e Intel Core i9-13900HX.
Compare os valores dos testes sintéticos e escolha o melhor processador!
These are saved results from the earlier catalog. Measurement dates and test configurations were not recorded. Models with no comparable results are omitted.
Recent models: test results with identified primary sources — Cinebench R23 · Cinebench R20 · Cinebench R15 · Cinebench 2026 · RandomX benchmark
Higher values are better in this metric.


 English
 Russian
 German
 Italian
 French
 Japan
 Spanish
 Polish
 Chinese
 Korean