ロセッサー1を選択
ロセッサー2を選択
MSI GeForce RTX 2080 Gaming Trio
ビデオカード2の選択
User rating
star star star star star
発売済み
Q3/2018
MSI GeForce RTX 2080 Gaming Trio

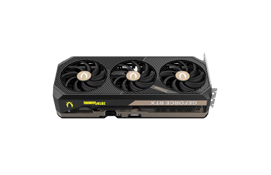
グラフィックカード MSI GeForce RTX 2080 Gaming Trio, 仕様とベンチマーク

1106 総合ランキング1位 グラフィックスカード (GPU)!
製造開始日がQ3/2018のMSI GeForce RTX 2080 Gaming Trioの詳細レビューです。ここでは、すべての仕様と、最新のベンチマークによる推定性能の結果を紹介します。ベースクロック周波数は1.515 GHzです。GPUはGDDR6をサポートし、8 GBのグラフィックメモリを搭載しています。TDPは260 W+ 21 %です。GPUの性能については、弊社ホームページの他モデルと比較されることをお勧めします。

仕様

技術データ
GPU
  • に基づいています。
    NVIDIA GeForce RTX 2080
  • Execution Units
    46
  • GPUチップ
    TU104
  • レンダリング出力単位
    64
  • シェーダー
    2944
  • テクスチャユニット
    184
メモリ
  • Memory Bandwidth
    448 GB/s
  • Memory Bus
    256 bit
  • メモリサイズ
    8 GB
  • Memory Speed (legacy frequency label)
    1750 MHz
  • メモリータイプ
    GDDR6
クロック周波数
  • 基本周波数
    1515 MHz
  • 最大周波数
    1710 MHz
  • Game Clock
    —
  • オーバークロッキング
    はい
エネルギー消費量
  • Maximum Junction Temperature
    89 °C
  • TDP
    260 W+ 21 %
  • TDP (up)
    310 W+ 30 %
冷却
  • クーラータイプ
    Air cooling
  • ファンタイプ
    Axial
  • ファン1
    2 x 100 mm
  • ファン2
    1 x 90 mm
  • Noise (Idle)
    34 dB
  • Noise (Load)
    43 dB
コネクティビティ
  • DisplayPort Ports
    3 × DisplayPort 1.4a
  • DVIポート
    —
  • HDCP Version
    2.2
  • HDMI端子
    1 × HDMI 2.0b
  • Max. 表示数
    4
  • PCIe Interface
    PCIe 3.0 x16
  • Power Connectors
    2 x 8-Pin
  • USB-C Ports
    1 × USB-C
  • VGA Ports
    —
フィーチャーセット
  • DirectX
    12_2
  • DLSS / FSR
    はい
  • LED
    MSI Mystic Light
  • 最大解像度
    7680 × 4320
  • レイトレーシング
    はい
対応するビデオコーデック
  • AV1
    いいえ
  • h264
    Decode / Encode
  • h265 / HEVC
    Decode / Encode
  • VP8
    Decode
  • VP9
    Decode
外形寸法図
  • 高さ
    140 mm
  • 長さ
    327 mm
  • Slot Size
    3 PCIe-Slots
  • Weight
    1533 g
  • Width
    56 mm
追加データ
  • スペック
    data sheet
  • Launch Price (historical)
    799 $
  • Part Number
    —
  • Process Technology
    12 nm
  • 発売日
    Q3/2018
全ランキングでの順位

共通ポジション MSI GeForce RTX 2080 Gaming Trio 他機種との比較のため、一般的なベンチマークでGPUを使用。.

  • FP32 Performance (Single-precision TFLOPS)
    1439 place
  • 3DMark Benchmark
    1069 place
  • Battlefield 5
    1164 place
  • Shadow of the Tomb Raider
    1092 place
  • Crypto-Mining Ethereum Hashrate (MH/s)
    1157 place
  • Crypto-Mining Ergo Hashrate (MH/s)
    1664 place
  • Crypto-Mining Ravencoin Hashrate (MH/s)
    839 place
  • Crypto-Mining Vertcoin Hashrate (MH/s)
    856 place

ベンチマーク

性能試験 GPU

一般的なベンチマークのスコアを比較する MSI GeForce RTX 2080 Gaming Trio 他のグラフィックスカードとの比較により、コンテンツ処理時のGPUの実速度を把握することができます.

テスト内容は、浮動小数点演算、3Dモデルの作成、暗号通貨の採掘などです.

These are saved results from the earlier catalog. Measurement dates and test configurations were not recorded. Models with no comparable results are omitted.

Recent models: test results with identified primary sources — Game frame rates

Archive: saved catalog source links. The original measurement method and test conditions have not been verified; current source pages may differ from the imported content. MSI GeForce RTX 2080 Gaming Trio

FP32 Performance (Single-precision TFLOPS)
ベンチマークFP32は、3Dゲームに必要なGPUの32ビット浮動小数点演算です.

Higher values are better in this metric.

10.07 TFLOPS
MSI GeForce RTX 2080 Gaming Trio
10.14 TFLOPS
10.14 TFLOPS
10.07 TFLOPS
3DMark Benchmark
3DMarkは、ハードウェアの性能を最大限に引き出したいゲーマー、オーバークロッカー、システムビルダーのために設計されています.

Higher values are better in this metric.

Battlefield 5
バトルフィールド5」はリアルなゲームであり、ベンチマークを内蔵しているので、グラフィックカードのテストとして非常に適している.

Higher values are better in this metric.

Shadow of the Tomb Raider
シャドウ オブ ザ トゥームレイダー』には、Crystal Dynamics Foundation製エンジンをベースにしたベンチマークが内蔵されています.

Higher values are better in this metric.

Crypto-Mining Ethereum Hashrate (MH/s)
Ethashは、GPUを最大限に活用してイーサリアム暗号通貨を採掘するアルゴリズムです.

Higher values are better in this metric.

Crypto-Mining Ergo Hashrate (MH/s)
Ergo暗号のベースとなっているAutolykosアルゴリズムは、最新のGPUだけでなく、過去の世代のGPUもマイニングに使用することが可能です.

Higher values are better in this metric.

Crypto-Mining Ravencoin Hashrate (MH/s)
KawPoWアルゴリズムでRavencoin暗号通貨を採掘するハッシュレートは、最新のビデオカードで最速となる.

Higher values are better in this metric.

Crypto-Mining Vertcoin Hashrate (MH/s)
VertCoin暗号通貨はNvidiaとAMDの両方で採掘でき、GTX1050、R9 290、さらにはGTX970といった古いGPUでも完璧に採掘できるのが面白いところです.

Higher values are better in this metric.

0.6 MH/s
MSI GeForce RTX 2080 Gaming Trio
0.61 MH/s
0.61 MH/s
0.6 MH/s

同義語

Nearby models in the composite benchmark index.

These are saved results from the earlier catalog. Measurement dates and test configurations were not recorded. Models with no comparable results are omitted. Index 0–100: equal-weight mean of each score relative to the best saved score among models with both tests. Tests: Battlefield 5 + Shadow of the Tomb Raider. This index does not predict performance in every workload.

Recent models: test results with identified primary sources — Game frame rates

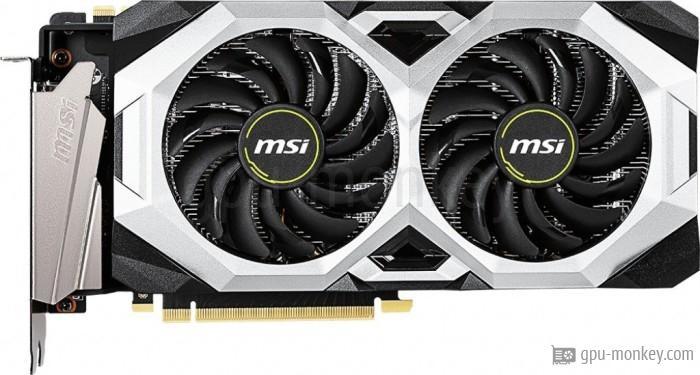
MSI GeForce RTX 2080 Ventus 8G MSI GeForce RTX 2080 Ventus 8G 表示
MSI GeForce RTX 2080 Ventus 8G V2 MSI GeForce RTX 2080 Ventus 8G V2 表示
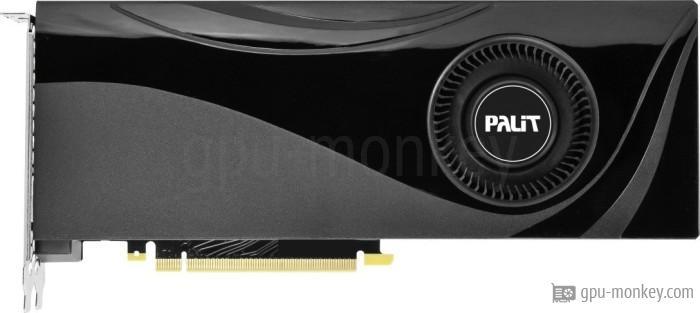
Palit GeForce RTX 2080 Palit GeForce RTX 2080 表示
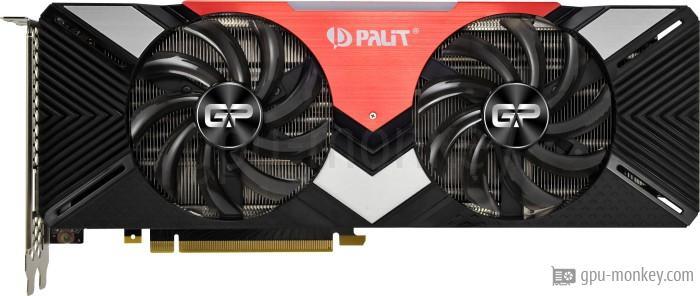
Palit GeForce RTX 2080 Dual Palit GeForce RTX 2080 Dual 表示
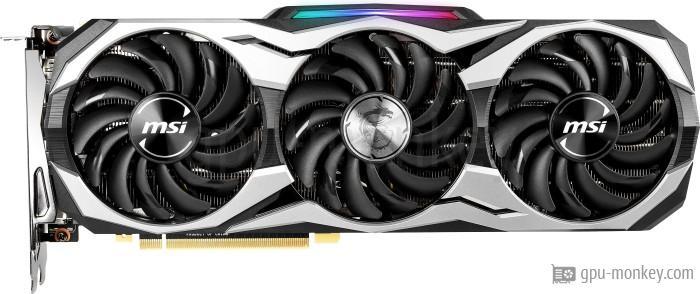
MSI GeForce RTX 2080 Duke 8G MSI GeForce RTX 2080 Duke 8G 表示
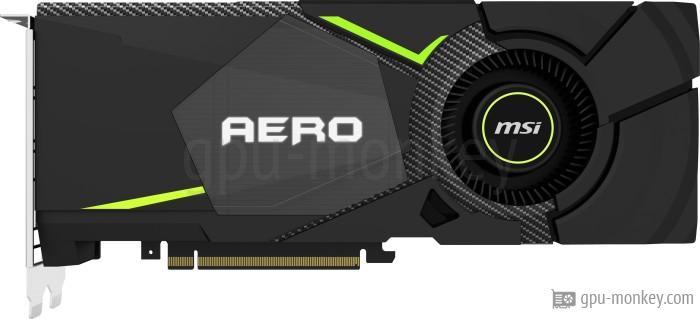
MSI GeForce RTX 2080 Aero 8G MSI GeForce RTX 2080 Aero 8G 表示
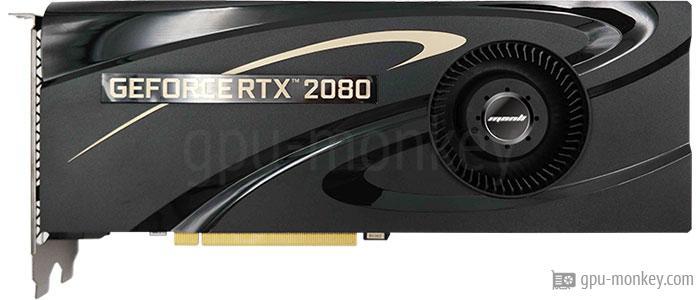
MANLI GeForce RTX 2080 (M3423+N502-00) MANLI GeForce RTX 2080 (M3423+N502-00) 表示
MANLI GeForce RTX 2080 (F393G+N502-00) MANLI GeForce RTX 2080 (F393G+N502-00) 表示

*

Base Clock is the base GPU frequency stated by the manufacturer for this model.

Boost Clock describes automatic frequency increases. Actual clock speed varies with workload, temperature and power limits; it is not a guarantee of manual overclocking.

ビデオカードの評価
MSI GeForce RTX 2080 Gaming Trio

最新の比較