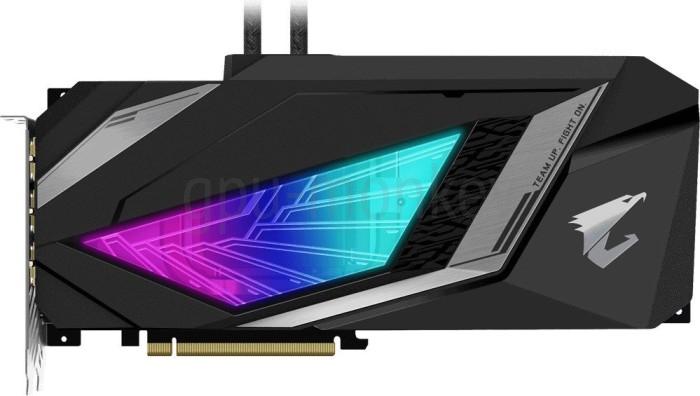
共通ポジション GIGABYTE AORUS GeForce RTX 2080 SUPER 8G 他機種との比較のため、一般的なベンチマークでGPUを使用。.
Published results: 51
Each row uses one game, resolution, test suite and graphics mode.
| Test and settings | GIGABYTE AORUS GeForce RTX 2080 SUPER 8G |
|---|---|
| Gaming suite 2021 / Assassin's Creed Valhalla / 1920x1080 / Extrem-Hoch-Preset / Rendering unreported | 67 FPS Base GPU test: Nvidia GeForce RTX 2080 Super VRAM: 8 GBTest CPU: AMD Ryzen 9 5950XSystem RAM: 4 × 8 GB G.Skill TridentZ, DDR4-3600 16-16-16-32-1T, optimierte Sekundär-Timings, Single-RankOS: Windows 10 20H2Graphics API: DirectX 12Driver: 461.40Resizable BAR: disabled |
| Gaming suite 2021 / Borderlands 3 / 1920x1080 / Badass-Preset / Rendering unreported | 104.7 FPS Base GPU test: Nvidia GeForce RTX 2080 Super VRAM: 8 GBTest CPU: AMD Ryzen 9 5950XSystem RAM: 4 × 8 GB G.Skill TridentZ, DDR4-3600 16-16-16-32-1T, optimierte Sekundär-Timings, Single-RankOS: Windows 10 20H2Graphics API: DirectX 11Driver: 461.40Resizable BAR: disabled |
| Gaming suite 2021 / Call of Duty Black Ops Cold War / 1920x1080 / Maximale Grafikdetails, SSR Niedrig / Rendering unreported | 106 FPS Base GPU test: Nvidia GeForce RTX 2080 Super VRAM: 8 GBTest CPU: AMD Ryzen 9 5950XSystem RAM: 4 × 8 GB G.Skill TridentZ, DDR4-3600 16-16-16-32-1T, optimierte Sekundär-Timings, Single-RankOS: Windows 10 20H2Graphics API: DirectX 12Driver: 461.40Resizable BAR: disabled |
| Gaming suite 2021 / Control / 1920x1080 / Hoch-Preset / Rendering unreported | 94.8 FPS Base GPU test: Nvidia GeForce RTX 2080 Super VRAM: 8 GBTest CPU: AMD Ryzen 9 5950XSystem RAM: 4 × 8 GB G.Skill TridentZ, DDR4-3600 16-16-16-32-1T, optimierte Sekundär-Timings, Single-RankOS: Windows 10 20H2Graphics API: DirectX 12Driver: 461.40Resizable BAR: disabled |
| Gaming suite 2021 / Cyberpunk 2077 / 1920x1080 / Ultra-Preset / Rendering unreported | 66.3 FPS Base GPU test: Nvidia GeForce RTX 2080 Super VRAM: 8 GBTest CPU: AMD Ryzen 9 5950XSystem RAM: 4 × 8 GB G.Skill TridentZ, DDR4-3600 16-16-16-32-1T, optimierte Sekundär-Timings, Single-RankOS: Windows 10 20H2Graphics API: DirectX 12Driver: 461.40Resizable BAR: disabled |
| Gaming suite 2021 / Death Stranding / 1920x1080 / Sehr-Hoch-Preset / Rendering unreported | 154.5 FPS Base GPU test: Nvidia GeForce RTX 2080 Super VRAM: 8 GBTest CPU: AMD Ryzen 9 5950XSystem RAM: 4 × 8 GB G.Skill TridentZ, DDR4-3600 16-16-16-32-1T, optimierte Sekundär-Timings, Single-RankOS: Windows 10 20H2Graphics API: DirectX 12Driver: 461.40Resizable BAR: disabled |
| Gaming suite 2021 / Dirt 5 / 1920x1080 / Ultrahoch-Preset / Rendering unreported | 94 FPS Base GPU test: Nvidia GeForce RTX 2080 Super VRAM: 8 GBTest CPU: AMD Ryzen 9 5950XSystem RAM: 4 × 8 GB G.Skill TridentZ, DDR4-3600 16-16-16-32-1T, optimierte Sekundär-Timings, Single-RankOS: Windows 10 20H2Graphics API: DirectX 12Driver: 461.40Resizable BAR: disabled |
| Gaming suite 2021 / Doom Eternal / 1920x1080 / Ultra-Albtraum-Preset / Rendering unreported | 211.3 FPS Base GPU test: Nvidia GeForce RTX 2080 Super VRAM: 8 GBTest CPU: AMD Ryzen 9 5950XSystem RAM: 4 × 8 GB G.Skill TridentZ, DDR4-3600 16-16-16-32-1T, optimierte Sekundär-Timings, Single-RankOS: Windows 10 20H2Graphics API: VulkanDriver: 461.40Resizable BAR: disabled |
| Gaming suite 2021 / F1 2020 / 1920x1080 / Ultrahoch-Preset, ASSAO, SRT Schatten Ein / Rendering unreported | 135.2 FPS Base GPU test: Nvidia GeForce RTX 2080 Super VRAM: 8 GBTest CPU: AMD Ryzen 9 5950XSystem RAM: 4 × 8 GB G.Skill TridentZ, DDR4-3600 16-16-16-32-1T, optimierte Sekundär-Timings, Single-RankOS: Windows 10 20H2Graphics API: DirectX 12Driver: 461.40Resizable BAR: disabled |
| Gaming suite 2021 / Gears 5 / 1920x1080 / Ultra-Preset, Animation Beste, Dynamische Schatten, Volumetrischer Nebel, Oberflächenreflexionen und Umgebungsverdeckung Wahnsinnig, SSGI Strahlen 32, kein VRS / Rendering unreported | 74.6 FPS Base GPU test: Nvidia GeForce RTX 2080 Super VRAM: 8 GBTest CPU: AMD Ryzen 9 5950XSystem RAM: 4 × 8 GB G.Skill TridentZ, DDR4-3600 16-16-16-32-1T, optimierte Sekundär-Timings, Single-RankOS: Windows 10 20H2Graphics API: DirectX 12Driver: 461.40Resizable BAR: disabled |
| Gaming suite 2021 / Hitman 3 / 1920x1080 / Maximale Grafikdetails, kein VRS / Rendering unreported | 130 FPS Base GPU test: Nvidia GeForce RTX 2080 Super VRAM: 8 GBTest CPU: AMD Ryzen 9 5950XSystem RAM: 4 × 8 GB G.Skill TridentZ, DDR4-3600 16-16-16-32-1T, optimierte Sekundär-Timings, Single-RankOS: Windows 10 20H2Graphics API: DirectX 12Driver: 461.40Resizable BAR: disabled |
| Gaming suite 2021 / Horizon Zero Dawn / 1920x1080 / Ultimative-Qualität-Preset / Rendering unreported | 81 FPS Base GPU test: Nvidia GeForce RTX 2080 Super VRAM: 8 GBTest CPU: AMD Ryzen 9 5950XSystem RAM: 4 × 8 GB G.Skill TridentZ, DDR4-3600 16-16-16-32-1T, optimierte Sekundär-Timings, Single-RankOS: Windows 10 20H2Graphics API: DirectX 12Driver: 461.40Resizable BAR: disabled |
| Test and settings | GIGABYTE AORUS GeForce RTX 2080 SUPER 8G |
|---|---|
| Gaming suite 2021 / Mafia: Definitive Edition / 1920x1080 / Hoch-Preset / Rendering unreported | 108.5 FPS Base GPU test: Nvidia GeForce RTX 2080 Super VRAM: 8 GBTest CPU: AMD Ryzen 9 5950XSystem RAM: 4 × 8 GB G.Skill TridentZ, DDR4-3600 16-16-16-32-1T, optimierte Sekundär-Timings, Single-RankOS: Windows 10 20H2Graphics API: DirectX 12Driver: 461.40Resizable BAR: disabled |
| Gaming suite 2021 / Red Dead Redemption 2 / 1920x1080 / Höchstes Grafik-Preset / Rendering unreported | 64.3 FPS Base GPU test: Nvidia GeForce RTX 2080 Super VRAM: 8 GBTest CPU: AMD Ryzen 9 5950XSystem RAM: 4 × 8 GB G.Skill TridentZ, DDR4-3600 16-16-16-32-1T, optimierte Sekundär-Timings, Single-RankOS: Windows 10 20H2Graphics API: VulkanDriver: 461.40Resizable BAR: disabled |
| Gaming suite 2021 / Serious Sam 4 / 1920x1080 / Ultra-Preset, maximierte GPU-Speed-Einstellungen / Rendering unreported | 64.1 FPS Base GPU test: Nvidia GeForce RTX 2080 Super VRAM: 8 GBTest CPU: AMD Ryzen 9 5950XSystem RAM: 4 × 8 GB G.Skill TridentZ, DDR4-3600 16-16-16-32-1T, optimierte Sekundär-Timings, Single-RankOS: Windows 10 20H2Graphics API: VulkanDriver: 461.40Resizable BAR: disabled |
| Gaming suite 2021 / Star Wars: Squadrons / 1920x1080 / 125 % Auflösung, Ultra-Preset, Umgebungsverdeckung Ultra / 125% / RT off | 162.7 FPS Base GPU test: Nvidia GeForce RTX 2080 Super VRAM: 8 GBTest CPU: AMD Ryzen 9 5950XSystem RAM: 4 × 8 GB G.Skill TridentZ, DDR4-3600 16-16-16-32-1T, optimierte Sekundär-Timings, Single-RankOS: Windows 10 20H2Graphics API: DirectX 12Driver: 461.40Resizable BAR: disabled |
| Gaming suite 2021 / Watch Dogs: Legion / 1920x1080 / Ultra-Preset / Rendering unreported | 62.9 FPS Base GPU test: Nvidia GeForce RTX 2080 Super VRAM: 8 GBTest CPU: AMD Ryzen 9 5950XSystem RAM: 4 × 8 GB G.Skill TridentZ, DDR4-3600 16-16-16-32-1T, optimierte Sekundär-Timings, Single-RankOS: Windows 10 20H2Graphics API: DirectX 12Driver: 461.40Resizable BAR: disabled |
| Gaming suite 2021 / Assassin's Creed Valhalla / 2560x1440 / Extrem-Hoch-Preset / Rendering unreported | 53.8 FPS Base GPU test: Nvidia GeForce RTX 2080 Super VRAM: 8 GBTest CPU: AMD Ryzen 9 5950XSystem RAM: 4 × 8 GB G.Skill TridentZ, DDR4-3600 16-16-16-32-1T, optimierte Sekundär-Timings, Single-RankOS: Windows 10 20H2Graphics API: DirectX 12Driver: 461.40Resizable BAR: disabled |
| Gaming suite 2021 / Borderlands 3 / 2560x1440 / Badass-Preset / Rendering unreported | 72.2 FPS Base GPU test: Nvidia GeForce RTX 2080 Super VRAM: 8 GBTest CPU: AMD Ryzen 9 5950XSystem RAM: 4 × 8 GB G.Skill TridentZ, DDR4-3600 16-16-16-32-1T, optimierte Sekundär-Timings, Single-RankOS: Windows 10 20H2Graphics API: DirectX 11Driver: 461.40Resizable BAR: disabled |
| Gaming suite 2021 / Call of Duty Black Ops Cold War / 2560x1440 / Maximale Grafikdetails, SSR Niedrig / Rendering unreported | 79 FPS Base GPU test: Nvidia GeForce RTX 2080 Super VRAM: 8 GBTest CPU: AMD Ryzen 9 5950XSystem RAM: 4 × 8 GB G.Skill TridentZ, DDR4-3600 16-16-16-32-1T, optimierte Sekundär-Timings, Single-RankOS: Windows 10 20H2Graphics API: DirectX 12Driver: 461.40Resizable BAR: disabled |
| Gaming suite 2021 / Control / 2560x1440 / Hoch-Preset / Rendering unreported | 62.8 FPS Base GPU test: Nvidia GeForce RTX 2080 Super VRAM: 8 GBTest CPU: AMD Ryzen 9 5950XSystem RAM: 4 × 8 GB G.Skill TridentZ, DDR4-3600 16-16-16-32-1T, optimierte Sekundär-Timings, Single-RankOS: Windows 10 20H2Graphics API: DirectX 12Driver: 461.40Resizable BAR: disabled |
| Gaming suite 2021 / Cyberpunk 2077 / 2560x1440 / Ultra-Preset / Rendering unreported | 45.2 FPS Base GPU test: Nvidia GeForce RTX 2080 Super VRAM: 8 GBTest CPU: AMD Ryzen 9 5950XSystem RAM: 4 × 8 GB G.Skill TridentZ, DDR4-3600 16-16-16-32-1T, optimierte Sekundär-Timings, Single-RankOS: Windows 10 20H2Graphics API: DirectX 12Driver: 461.40Resizable BAR: disabled |
| Gaming suite 2021 / Death Stranding / 2560x1440 / Sehr-Hoch-Preset / Rendering unreported | 115.4 FPS Base GPU test: Nvidia GeForce RTX 2080 Super VRAM: 8 GBTest CPU: AMD Ryzen 9 5950XSystem RAM: 4 × 8 GB G.Skill TridentZ, DDR4-3600 16-16-16-32-1T, optimierte Sekundär-Timings, Single-RankOS: Windows 10 20H2Graphics API: DirectX 12Driver: 461.40Resizable BAR: disabled |
| Gaming suite 2021 / Dirt 5 / 2560x1440 / Ultrahoch-Preset / Rendering unreported | 75.6 FPS Base GPU test: Nvidia GeForce RTX 2080 Super VRAM: 8 GBTest CPU: AMD Ryzen 9 5950XSystem RAM: 4 × 8 GB G.Skill TridentZ, DDR4-3600 16-16-16-32-1T, optimierte Sekundär-Timings, Single-RankOS: Windows 10 20H2Graphics API: DirectX 12Driver: 461.40Resizable BAR: disabled |
| Gaming suite 2021 / Doom Eternal / 2560x1440 / Ultra-Albtraum-Preset / Rendering unreported | 157.1 FPS Base GPU test: Nvidia GeForce RTX 2080 Super VRAM: 8 GBTest CPU: AMD Ryzen 9 5950XSystem RAM: 4 × 8 GB G.Skill TridentZ, DDR4-3600 16-16-16-32-1T, optimierte Sekundär-Timings, Single-RankOS: Windows 10 20H2Graphics API: VulkanDriver: 461.40Resizable BAR: disabled |
| Gaming suite 2021 / F1 2020 / 2560x1440 / Ultrahoch-Preset, ASSAO, SRT Schatten Ein / Rendering unreported | 100.1 FPS Base GPU test: Nvidia GeForce RTX 2080 Super VRAM: 8 GBTest CPU: AMD Ryzen 9 5950XSystem RAM: 4 × 8 GB G.Skill TridentZ, DDR4-3600 16-16-16-32-1T, optimierte Sekundär-Timings, Single-RankOS: Windows 10 20H2Graphics API: DirectX 12Driver: 461.40Resizable BAR: disabled |
| Gaming suite 2021 / Gears 5 / 2560x1440 / Ultra-Preset, Animation Beste, Dynamische Schatten, Volumetrischer Nebel, Oberflächenreflexionen und Umgebungsverdeckung Wahnsinnig, SSGI Strahlen 32, kein VRS / Rendering unreported | 52.8 FPS Base GPU test: Nvidia GeForce RTX 2080 Super VRAM: 8 GBTest CPU: AMD Ryzen 9 5950XSystem RAM: 4 × 8 GB G.Skill TridentZ, DDR4-3600 16-16-16-32-1T, optimierte Sekundär-Timings, Single-RankOS: Windows 10 20H2Graphics API: DirectX 12Driver: 461.40Resizable BAR: disabled |
| Gaming suite 2021 / Hitman 3 / 2560x1440 / Maximale Grafikdetails, kein VRS / Rendering unreported | 93.9 FPS Base GPU test: Nvidia GeForce RTX 2080 Super VRAM: 8 GBTest CPU: AMD Ryzen 9 5950XSystem RAM: 4 × 8 GB G.Skill TridentZ, DDR4-3600 16-16-16-32-1T, optimierte Sekundär-Timings, Single-RankOS: Windows 10 20H2Graphics API: DirectX 12Driver: 461.40Resizable BAR: disabled |
| Gaming suite 2021 / Horizon Zero Dawn / 2560x1440 / Ultimative-Qualität-Preset / Rendering unreported | 66.5 FPS Base GPU test: Nvidia GeForce RTX 2080 Super VRAM: 8 GBTest CPU: AMD Ryzen 9 5950XSystem RAM: 4 × 8 GB G.Skill TridentZ, DDR4-3600 16-16-16-32-1T, optimierte Sekundär-Timings, Single-RankOS: Windows 10 20H2Graphics API: DirectX 12Driver: 461.40Resizable BAR: disabled |
| Gaming suite 2021 / Mafia: Definitive Edition / 2560x1440 / Hoch-Preset / Rendering unreported | 77.4 FPS Base GPU test: Nvidia GeForce RTX 2080 Super VRAM: 8 GBTest CPU: AMD Ryzen 9 5950XSystem RAM: 4 × 8 GB G.Skill TridentZ, DDR4-3600 16-16-16-32-1T, optimierte Sekundär-Timings, Single-RankOS: Windows 10 20H2Graphics API: DirectX 12Driver: 461.40Resizable BAR: disabled |
| Gaming suite 2021 / Red Dead Redemption 2 / 2560x1440 / Höchstes Grafik-Preset / Rendering unreported | 56.7 FPS Base GPU test: Nvidia GeForce RTX 2080 Super VRAM: 8 GBTest CPU: AMD Ryzen 9 5950XSystem RAM: 4 × 8 GB G.Skill TridentZ, DDR4-3600 16-16-16-32-1T, optimierte Sekundär-Timings, Single-RankOS: Windows 10 20H2Graphics API: VulkanDriver: 461.40Resizable BAR: disabled |
| Gaming suite 2021 / Serious Sam 4 / 2560x1440 / Ultra-Preset, maximierte GPU-Speed-Einstellungen / Rendering unreported | 51.9 FPS Base GPU test: Nvidia GeForce RTX 2080 Super VRAM: 8 GBTest CPU: AMD Ryzen 9 5950XSystem RAM: 4 × 8 GB G.Skill TridentZ, DDR4-3600 16-16-16-32-1T, optimierte Sekundär-Timings, Single-RankOS: Windows 10 20H2Graphics API: VulkanDriver: 461.40Resizable BAR: disabled |
| Gaming suite 2021 / Star Wars: Squadrons / 2560x1440 / 125 % Auflösung, Ultra-Preset, Umgebungsverdeckung Ultra / 125% / RT off | 112.2 FPS Base GPU test: Nvidia GeForce RTX 2080 Super VRAM: 8 GBTest CPU: AMD Ryzen 9 5950XSystem RAM: 4 × 8 GB G.Skill TridentZ, DDR4-3600 16-16-16-32-1T, optimierte Sekundär-Timings, Single-RankOS: Windows 10 20H2Graphics API: DirectX 12Driver: 461.40Resizable BAR: disabled |
| Gaming suite 2021 / Watch Dogs: Legion / 2560x1440 / Ultra-Preset / Rendering unreported | 49.6 FPS Base GPU test: Nvidia GeForce RTX 2080 Super VRAM: 8 GBTest CPU: AMD Ryzen 9 5950XSystem RAM: 4 × 8 GB G.Skill TridentZ, DDR4-3600 16-16-16-32-1T, optimierte Sekundär-Timings, Single-RankOS: Windows 10 20H2Graphics API: DirectX 12Driver: 461.40Resizable BAR: disabled |
| Gaming suite 2021 / Assassin's Creed Valhalla / 3840x2160 / Extrem-Hoch-Preset / Rendering unreported | 34.2 FPS Base GPU test: Nvidia GeForce RTX 2080 Super VRAM: 8 GBTest CPU: AMD Ryzen 9 5950XSystem RAM: 4 × 8 GB G.Skill TridentZ, DDR4-3600 16-16-16-32-1T, optimierte Sekundär-Timings, Single-RankOS: Windows 10 20H2Graphics API: DirectX 12Driver: 461.40Resizable BAR: disabled |
| Gaming suite 2021 / Borderlands 3 / 3840x2160 / Badass-Preset / Rendering unreported | 38.8 FPS Base GPU test: Nvidia GeForce RTX 2080 Super VRAM: 8 GBTest CPU: AMD Ryzen 9 5950XSystem RAM: 4 × 8 GB G.Skill TridentZ, DDR4-3600 16-16-16-32-1T, optimierte Sekundär-Timings, Single-RankOS: Windows 10 20H2Graphics API: DirectX 11Driver: 461.40Resizable BAR: disabled |
| Gaming suite 2021 / Call of Duty Black Ops Cold War / 3840x2160 / Maximale Grafikdetails, SSR Niedrig / Rendering unreported | 43.9 FPS Base GPU test: Nvidia GeForce RTX 2080 Super VRAM: 8 GBTest CPU: AMD Ryzen 9 5950XSystem RAM: 4 × 8 GB G.Skill TridentZ, DDR4-3600 16-16-16-32-1T, optimierte Sekundär-Timings, Single-RankOS: Windows 10 20H2Graphics API: DirectX 12Driver: 461.40Resizable BAR: disabled |
| Gaming suite 2021 / Control / 3840x2160 / Mittel-Preset / Rendering unreported | 39.5 FPS Base GPU test: Nvidia GeForce RTX 2080 Super VRAM: 8 GBTest CPU: AMD Ryzen 9 5950XSystem RAM: 4 × 8 GB G.Skill TridentZ, DDR4-3600 16-16-16-32-1T, optimierte Sekundär-Timings, Single-RankOS: Windows 10 20H2Graphics API: DirectX 11Driver: 461.40Resizable BAR: disabled |
| Gaming suite 2021 / Cyberpunk 2077 / 3840x2160 / Mittel-Preset / Rendering unreported | 33.8 FPS Base GPU test: Nvidia GeForce RTX 2080 Super VRAM: 8 GBTest CPU: AMD Ryzen 9 5950XSystem RAM: 4 × 8 GB G.Skill TridentZ, DDR4-3600 16-16-16-32-1T, optimierte Sekundär-Timings, Single-RankOS: Windows 10 20H2Graphics API: DirectX 12Driver: 461.40Resizable BAR: disabled |
| Gaming suite 2021 / Death Stranding / 3840x2160 / Sehr-Hoch-Preset / Rendering unreported | 67.4 FPS Base GPU test: Nvidia GeForce RTX 2080 Super VRAM: 8 GBTest CPU: AMD Ryzen 9 5950XSystem RAM: 4 × 8 GB G.Skill TridentZ, DDR4-3600 16-16-16-32-1T, optimierte Sekundär-Timings, Single-RankOS: Windows 10 20H2Graphics API: DirectX 12Driver: 461.40Resizable BAR: disabled |
| Gaming suite 2021 / Dirt 5 / 3840x2160 / Ultrahoch-Preset / Rendering unreported | 50 FPS Base GPU test: Nvidia GeForce RTX 2080 Super VRAM: 8 GBTest CPU: AMD Ryzen 9 5950XSystem RAM: 4 × 8 GB G.Skill TridentZ, DDR4-3600 16-16-16-32-1T, optimierte Sekundär-Timings, Single-RankOS: Windows 10 20H2Graphics API: DirectX 12Driver: 461.40Resizable BAR: disabled |
| Gaming suite 2021 / Doom Eternal / 3840x2160 / Ultra-Albtraum-Preset / Rendering unreported | 78.4 FPS Base GPU test: Nvidia GeForce RTX 2080 Super VRAM: 8 GBTest CPU: AMD Ryzen 9 5950XSystem RAM: 4 × 8 GB G.Skill TridentZ, DDR4-3600 16-16-16-32-1T, optimierte Sekundär-Timings, Single-RankOS: Windows 10 20H2Graphics API: VulkanDriver: 461.40Resizable BAR: disabled |
| Gaming suite 2021 / F1 2020 / 3840x2160 / Ultrahoch-Preset, ASSAO, SRT Schatten Ein / Rendering unreported | 54.6 FPS Base GPU test: Nvidia GeForce RTX 2080 Super VRAM: 8 GBTest CPU: AMD Ryzen 9 5950XSystem RAM: 4 × 8 GB G.Skill TridentZ, DDR4-3600 16-16-16-32-1T, optimierte Sekundär-Timings, Single-RankOS: Windows 10 20H2Graphics API: DirectX 12Driver: 461.40Resizable BAR: disabled |
| Gaming suite 2021 / Gears 5 / 3840x2160 / Ultra-Preset, kein VRS / Rendering unreported | 40.3 FPS Base GPU test: Nvidia GeForce RTX 2080 Super VRAM: 8 GBTest CPU: AMD Ryzen 9 5950XSystem RAM: 4 × 8 GB G.Skill TridentZ, DDR4-3600 16-16-16-32-1T, optimierte Sekundär-Timings, Single-RankOS: Windows 10 20H2Graphics API: DirectX 12Driver: 461.40Resizable BAR: disabled |
| Gaming suite 2021 / Hitman 3 / 3840x2160 / Maximale Grafikdetails, kein VRS / Rendering unreported | 56 FPS Base GPU test: Nvidia GeForce RTX 2080 Super VRAM: 8 GBTest CPU: AMD Ryzen 9 5950XSystem RAM: 4 × 8 GB G.Skill TridentZ, DDR4-3600 16-16-16-32-1T, optimierte Sekundär-Timings, Single-RankOS: Windows 10 20H2Graphics API: DirectX 12Driver: 461.40Resizable BAR: disabled |
| Gaming suite 2021 / Horizon Zero Dawn / 3840x2160 / Ultimative-Qualität-Preset / Rendering unreported | 41.7 FPS Base GPU test: Nvidia GeForce RTX 2080 Super VRAM: 8 GBTest CPU: AMD Ryzen 9 5950XSystem RAM: 4 × 8 GB G.Skill TridentZ, DDR4-3600 16-16-16-32-1T, optimierte Sekundär-Timings, Single-RankOS: Windows 10 20H2Graphics API: DirectX 12Driver: 461.40Resizable BAR: disabled |
| Gaming suite 2021 / Mafia: Definitive Edition / 3840x2160 / Hoch-Preset / Rendering unreported | 42.6 FPS Base GPU test: Nvidia GeForce RTX 2080 Super VRAM: 8 GBTest CPU: AMD Ryzen 9 5950XSystem RAM: 4 × 8 GB G.Skill TridentZ, DDR4-3600 16-16-16-32-1T, optimierte Sekundär-Timings, Single-RankOS: Windows 10 20H2Graphics API: DirectX 12Driver: 461.40Resizable BAR: disabled |
| Gaming suite 2021 / Red Dead Redemption 2 / 3840x2160 / Höchstes Grafik-Preset / Rendering unreported | 37.3 FPS Base GPU test: Nvidia GeForce RTX 2080 Super VRAM: 8 GBTest CPU: AMD Ryzen 9 5950XSystem RAM: 4 × 8 GB G.Skill TridentZ, DDR4-3600 16-16-16-32-1T, optimierte Sekundär-Timings, Single-RankOS: Windows 10 20H2Graphics API: DirectX 12Driver: 461.40Resizable BAR: disabled |
| Gaming suite 2021 / Serious Sam 4 / 3840x2160 / Ultra-Preset, 16×AF / Rendering unreported | 48.7 FPS Base GPU test: Nvidia GeForce RTX 2080 Super VRAM: 8 GBTest CPU: AMD Ryzen 9 5950XSystem RAM: 4 × 8 GB G.Skill TridentZ, DDR4-3600 16-16-16-32-1T, optimierte Sekundär-Timings, Single-RankOS: Windows 10 20H2Graphics API: VulkanDriver: 461.40Resizable BAR: disabled |
| Gaming suite 2021 / Star Wars: Squadrons / 3840x2160 / 125 % Auflösung, Ultra-Preset, Umgebungsverdeckung Ultra / 125% / RT off | 60.7 FPS Base GPU test: Nvidia GeForce RTX 2080 Super VRAM: 8 GBTest CPU: AMD Ryzen 9 5950XSystem RAM: 4 × 8 GB G.Skill TridentZ, DDR4-3600 16-16-16-32-1T, optimierte Sekundär-Timings, Single-RankOS: Windows 10 20H2Graphics API: DirectX 12Driver: 461.40Resizable BAR: disabled |
| Gaming suite 2021 / Watch Dogs: Legion / 3840x2160 / Ultra-Preset / Rendering unreported | 32.5 FPS Base GPU test: Nvidia GeForce RTX 2080 Super VRAM: 8 GBTest CPU: AMD Ryzen 9 5950XSystem RAM: 4 × 8 GB G.Skill TridentZ, DDR4-3600 16-16-16-32-1T, optimierte Sekundär-Timings, Single-RankOS: Windows 10 20H2Graphics API: DirectX 12Driver: 461.40Resizable BAR: disabled |
A base GPU test is a reference for cards using that GPU and the same memory capacity. Board overclocking, cooling and power limits can change the result.
一般的なベンチマークのスコアを比較する GIGABYTE AORUS GeForce RTX 2080 SUPER 8G 他のグラフィックスカードとの比較により、コンテンツ処理時のGPUの実速度を把握することができます.
テスト内容は、浮動小数点演算、3Dモデルの作成、暗号通貨の採掘などです.
These are saved results from the earlier catalog. Measurement dates and test configurations were not recorded. Models with no comparable results are omitted.
Recent models: test results with identified primary sources — Game frame rates
Archived results. The original measurement method and test conditions have not been verified.
Higher values are better in this metric.
Higher values are better in this metric.
Higher values are better in this metric.
Higher values are better in this metric.
Higher values are better in this metric.
Higher values are better in this metric.
Higher values are better in this metric.
These are saved results from the earlier catalog. Measurement dates and test configurations were not recorded. Models with no comparable results are omitted. Index 0–100: equal-weight mean of each score relative to the best saved score among models with both tests. Tests: Battlefield 5 + Shadow of the Tomb Raider. This index does not predict performance in every workload.
Recent models: test results with identified primary sources — Game frame rates
*
Base Clock is the base GPU frequency stated by the manufacturer for this model.
Boost Clock describes automatic frequency increases. Actual clock speed varies with workload, temperature and power limits; it is not a guarantee of manual overclocking.


 English
 Russian
 German
 Portuguese
 Italian
 French
 Spanish
 Polish
 Chinese
 Korean