
ロセッサー1を選択
ロセッサー2を選択
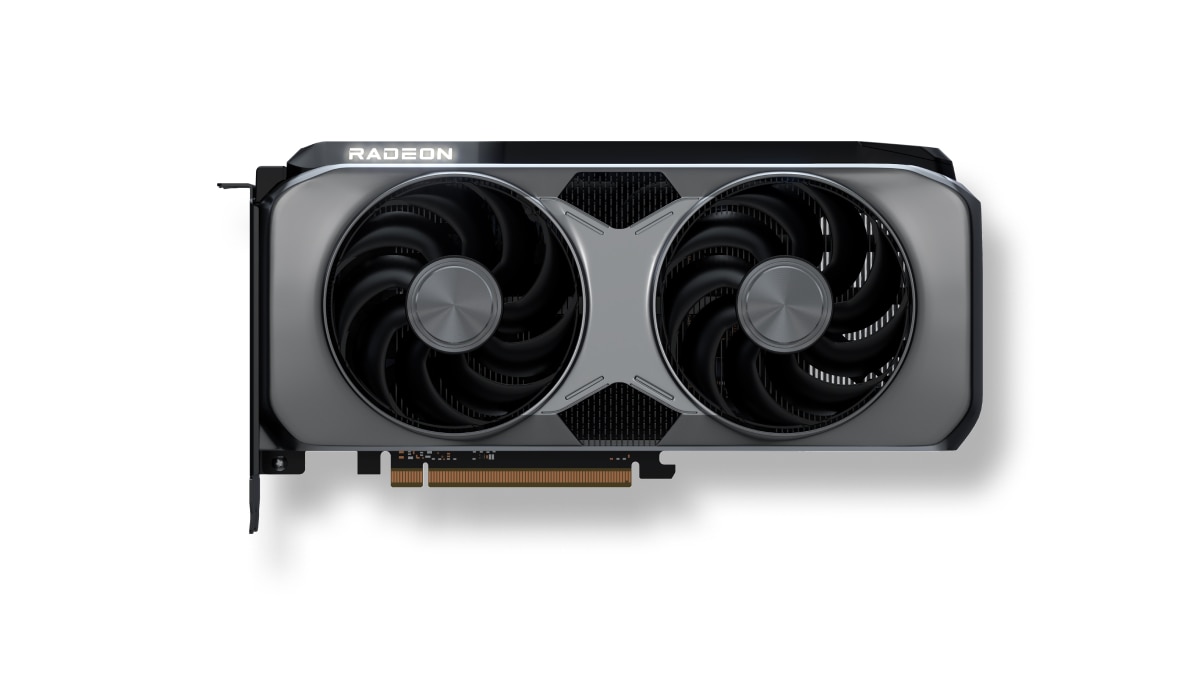
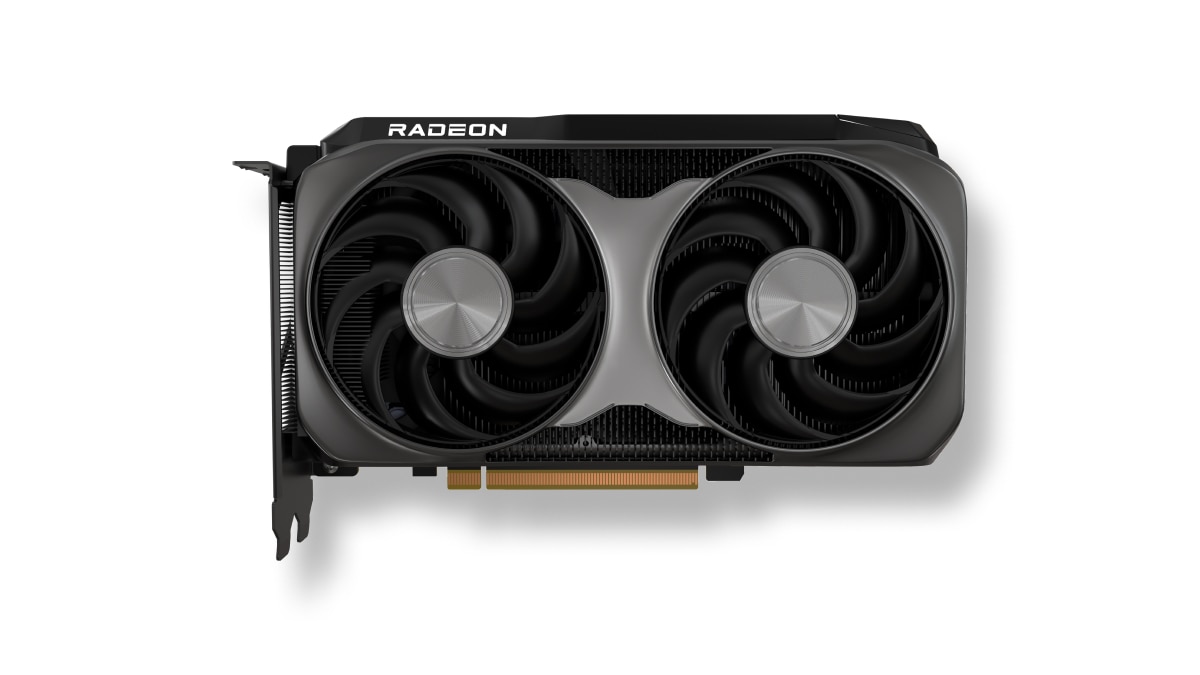
NVIDIA GeForce RTX 4060
Gainward GeForce GTX 1070 Phoenix GLH

NVIDIA GeForce RTX 4060 対 Gainward GeForce GTX 1070 Phoenix GLH. 仕様・性能・テスト

User rating
star star star star star
発売済み
Q3/2023
NVIDIA GeForce RTX 4060
発売済み
Q2/2016
User rating
star star star star star
Gainward GeForce GTX 1070 Phoenix GLH

ベストな選択とは NVIDIA GeForce RTX 4060 または Gainward GeForce GTX 1070 Phoenix GLH? どのグラフィックカードが速い?

最適なグラフィックカードを選ぶために、比較を用意しました。それぞれの仕様やベンチマークを比較してみてください。

NVIDIA GeForce RTX 4060 has a base frequency of 1.83 GHz. メモリサイズ 8 GB. メモリータイプ GDDR6. で発売されました。 Q3/2023.

Gainward GeForce GTX 1070 Phoenix GLH has a base frequency of 1.670 GHz+ 11 %. メモリサイズ 8 GB. メモリータイプ GDDR5. で発売されました。 Q2/2016.

相違点


全ランキングでの順位

共通ポジション NVIDIA GeForce RTX 4060 他機種との比較のため、一般的なベンチマークでGPUを使用。.

  • FP32 Performance (Single-precision TFLOPS)
    832 place
  • 総合ランキングの順位

    (複数のベンチマークに基づく)

    2002 left arrow 場所

全ランキングでの順位

共通ポジション Gainward GeForce GTX 1070 Phoenix GLH 他機種との比較のため、一般的なベンチマークでGPUを使用。.

  • FP32 Performance (Single-precision TFLOPS)
    2016 place
  • 3DMark Benchmark
    2052 place
  • Battlefield 5
    1862 place
  • Shadow of the Tomb Raider
    2032 place
  • Crypto-Mining Ethereum Hashrate (MH/s)
    2173 place
  • Crypto-Mining Ergo Hashrate (MH/s)
    2181 place
  • Crypto-Mining Ravencoin Hashrate (MH/s)
    1984 place
  • Crypto-Mining Vertcoin Hashrate (MH/s)
    1320 place

仕様

技術データ
NVIDIA GeForce RTX 4060 NVIDIA GeForce RTX 4060
Gainward GeForce GTX 1070 Phoenix GLH Gainward GeForce GTX 1070 Phoenix GLH
一般情報

グラフィックスカードの基本技術データの比較 NVIDIA GeForce RTX 4060 と Gainward GeForce GTX 1070 Phoenix GLH, チップ、情報処理装置.

  • 建築
    Ada Lovelace left arrow -
  • に基づいています。
    NVIDIA GeForce RTX 4060 left arrow NVIDIA GeForce GTX 1070
  • CUDA Cores
    3072 left arrow -
  • GPUチップ
    AD107 left arrow GP104-200-A1
  • レンダリング出力単位
    32 left arrow 64
  • RT Cores
    24 left arrow -
  • シェーダー
    3072 left arrow 1920
  • Streaming Multiprocessors
    24 left arrow -
  • テクスチャユニット
    96 left arrow 120
  • Execution Units
    - left arrow 15
メモリ設定

Video memory capacity, type, bus width and bandwidth describe different properties. These values alone do not determine graphics performance.

  • Memory Bandwidth
    272 GB/s left arrow 256 GB/s
  • Memory Bus
    128 bit left arrow 256 bit
  • Memory Clock
    2125 MHz left arrow -
  • Memory Data Rate
    17 Gbps left arrow -
  • メモリサイズ
    8 GB left arrow 8 GB
  • メモリータイプ
    GDDR6 left arrow GDDR5
  • Memory Speed (legacy frequency label)
    - left arrow 2002 MHz
クロック周波数

Published GPU clock frequencies describe different operating modes. Clock speed alone does not determine graphics performance.

  • 基本周波数
    1830 MHz left arrow 1670 MHz + 11%
  • 最大周波数
    2460 MHz left arrow 1873 MHz + 11%
  • Game Clock
    - left arrow -
  • オーバークロッキング
    はい left arrow はい
エネルギー消費量

Graphics card power limits and recommended system power supply describe different specifications.

  • Maximum GPU Temperature
    90 °C left arrow -
  • Maximum Junction Temperature
    90 °C left arrow -
  • System Power Supply
    550 W (System power requirement) left arrow -
  • TDP
    115 W left arrow 150 W
  • TDP (up)
    - left arrow -
  • Total Graphics Power
    115 W left arrow -
クーラー&ファンタイプ

グラフィックスカード冷却システム用クーラーの種類とサイズ NVIDIA GeForce RTX 4060 と Gainward GeForce GTX 1070 Phoenix GLH.

  • クーラータイプ
    Air cooling left arrow Air cooling
  • ファンタイプ
    - left arrow Axial
  • ファン1
    - left arrow 2 x 100 mm
  • ファン2
    - left arrow -
  • Noise (Idle)
    0 dB / Silent left arrow 0 dB / Silent
  • Noise (Load)
    - left arrow -
インターフェイス

コネクティビティと接続.

  • DisplayPort Ports
    3 × DisplayPort left arrow 3 × DisplayPort 1.4
  • DVIポート
    - left arrow 1 × DVI
  • HDCP Version
    2.3 left arrow 2.2
  • HDMI端子
    1 × HDMI 2.1a left arrow 1 × HDMI 2.0b
  • Max. 表示数
    4 left arrow 4
  • Other Display Outputs (unparsed)
    HDMI left arrow -
  • PCIe Interface
    PCIe 4.0 x8 left arrow PCIe 3.0 x16
  • Power Connectors
    1x PCIe 8-pin cables (adapter in box) OR 300 W or greater PCIe Gen 5 cable. Certain manufacturer models may use 1x PCIe 6-pin cable or 1x PCIe 8-pin cable left arrow 1 x 8-Pin
  • USB-C Ports
    - left arrow -
  • VGA Ports
    - left arrow -
技術データ

コンピュータゲームに活かされる技術データ.

  • DirectX
    12_2 (Ultimate) left arrow 12_1
  • DLSS / FSR
    はい left arrow いいえ
  • LED
    No LED lighting left arrow No LED lighting
  • 最大解像度
    7680 × 4320 left arrow 7680 × 4320
  • レイトレーシング
    はい left arrow いいえ
対応するビデオコーデック

動画・画像圧縮規格に対応した内蔵型.

  • AV1
    Decode / Encode left arrow いいえ
  • h264
    Decode / Encode left arrow Decode / Encode
  • h265 / HEVC
    Decode / Encode left arrow Decode / Encode
  • VP8
    Decode left arrow Decode
  • VP9
    Decode left arrow Decode
外形寸法図

比較したデバイスのサイズ、重量、スロットの違い

  • 高さ
    - left arrow 133 mm
  • 長さ
    - left arrow 285 mm
  • Slot Size
    - left arrow 3 PCIe-Slots
  • Weight
    - left arrow -
  • Width
    - left arrow -
詳細はこちら

GPUのインターフェースと発売時期の比較 Gainward GeForce GTX 1070 Phoenix GLH と NVIDIA GeForce RTX 4060.

  • スペック
    data sheet left arrow data sheet
  • Launch Price (historical)
    299 $ left arrow -
  • Manufacturer specification scope
    NVIDIA Founders Edition/reference design. Clock specifications apply to gaming use. AIB shipping specifications and complete-system power needs may differ. left arrow -
  • Part Number
    - left arrow 426018336-3675
  • Process Technology
    4 nm left arrow 16 nm
  • 発売日
    Q3/2023 left arrow Q2/2016

ベンチマーク

性能試験 GPUs
Individual model tests

These results have no shared test of both models with the same version and settings. They are shown separately without a percentage difference.

NVIDIA GeForce RTX 4060

More results: 122

Gainward GeForce GTX 1070 Phoenix GLH

  • Counter-Strike 2 / 1920x1080 / High / Native / RT off 229.4 FPS Base GPU test: Founders Edition Tested board: Founders EditionVRAM: 8 GBTest CPU: AMD Ryzen 9 7900System RAM: 32 GB DDR5-5200CL38OS: Windows 11Rendering: Native (no FSR/DLSS)Driver: 551.23
  • Cyberpunk 2077 / 1920x1080 / High / Native / RT off 35.2 FPS Base GPU test: Founders Edition Tested board: Founders EditionVRAM: 8 GBTest CPU: AMD Ryzen 9 7900System RAM: 32 GB DDR5-5200CL38OS: Windows 11Rendering: Native (no FSR/DLSS)Game build: Phantom Liberty / Patch 2.11Driver: 551.23
  • Diablo IV / 1920x1080 / Medium / Native / RT off 122.6 FPS Base GPU test: Founders Edition Tested board: Founders EditionVRAM: 8 GBTest CPU: AMD Ryzen 9 7900System RAM: 32 GB DDR5-5200CL38OS: Windows 11Rendering: Native (no FSR/DLSS)Driver: 551.23
  • Dota 2 / 1920x1080 / Maximum / Native / RT off 209.7 FPS Base GPU test: Founders Edition Tested board: Founders EditionVRAM: 8 GBTest CPU: AMD Ryzen 9 7900System RAM: 32 GB DDR5-5200CL38OS: Windows 11Graphics API: DirectX 11Rendering: Native (no FSR/DLSS)Driver: 551.23
  • F1 23 / 1920x1080 / High / 16x AF / TAA + FidelityFX Sharpening / Native / RT off 111.9 FPS Base GPU test: Founders Edition Tested board: Founders EditionVRAM: 8 GBTest CPU: AMD Ryzen 9 7900System RAM: 32 GB DDR5-5200CL38OS: Windows 11Rendering: Native (no FSR/DLSS)Driver: 551.23
  • Baldur's Gate 3 / 1920x1080 / Ultra / Native / RT off 52.2 FPS Base GPU test: Founders Edition Tested board: Founders EditionVRAM: 8 GBTest CPU: AMD Ryzen 9 7900System RAM: 32 GB DDR5-5200CL38OS: Windows 11Graphics API: VulkanRendering: Native (no FSR/DLSS)Driver: 551.23
  • Ratchet & Clank / 1920x1080 / High / TAA / Native / RT off 41.2 FPS Base GPU test: Founders Edition Tested board: Founders EditionVRAM: 8 GBTest CPU: AMD Ryzen 9 7900System RAM: 32 GB DDR5-5200CL38OS: Windows 11Rendering: Native (no FSR/DLSS)Driver: 551.23
  • 3DMark Time Spy 5945 points Base GPU test: Founders Edition Tested board: Founders EditionVRAM: 8 GBTest CPU: AMD Ryzen 9 7900System RAM: 32 GB DDR5-5200CL38OS: Windows 11Driver: 551.23Application version unreported
More results: 36

いくつかの一般的なベンチマークの結果に基づき、より正確に、次のような性能差を見積もることができます NVIDIA GeForce RTX 4060 と Gainward GeForce GTX 1070 Phoenix GLH.

合成ベンチマークを比較して、あなたに最適なグラフィックカードを選びましょう

These are saved results from the earlier catalog. Measurement dates and test configurations were not recorded. Models with no comparable results are omitted.

Recent models: test results with identified primary sources — Game frame rates

Archived results. The original measurement method and test conditions have not been verified.

FP32 Performance (Single-precision TFLOPS)
ベンチマークFP32は、3Dゲームに必要なGPUの32ビット浮動小数点演算です.

Higher values are better in this metric.

15.11 TFLOPS
NVIDIA GeForce RTX 4060
7.19 TFLOPS
Gainward GeForce GTX 1070 Phoenix GLH

最新の比較