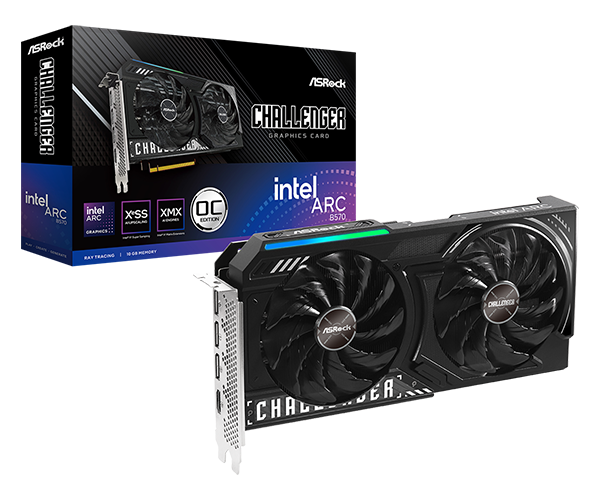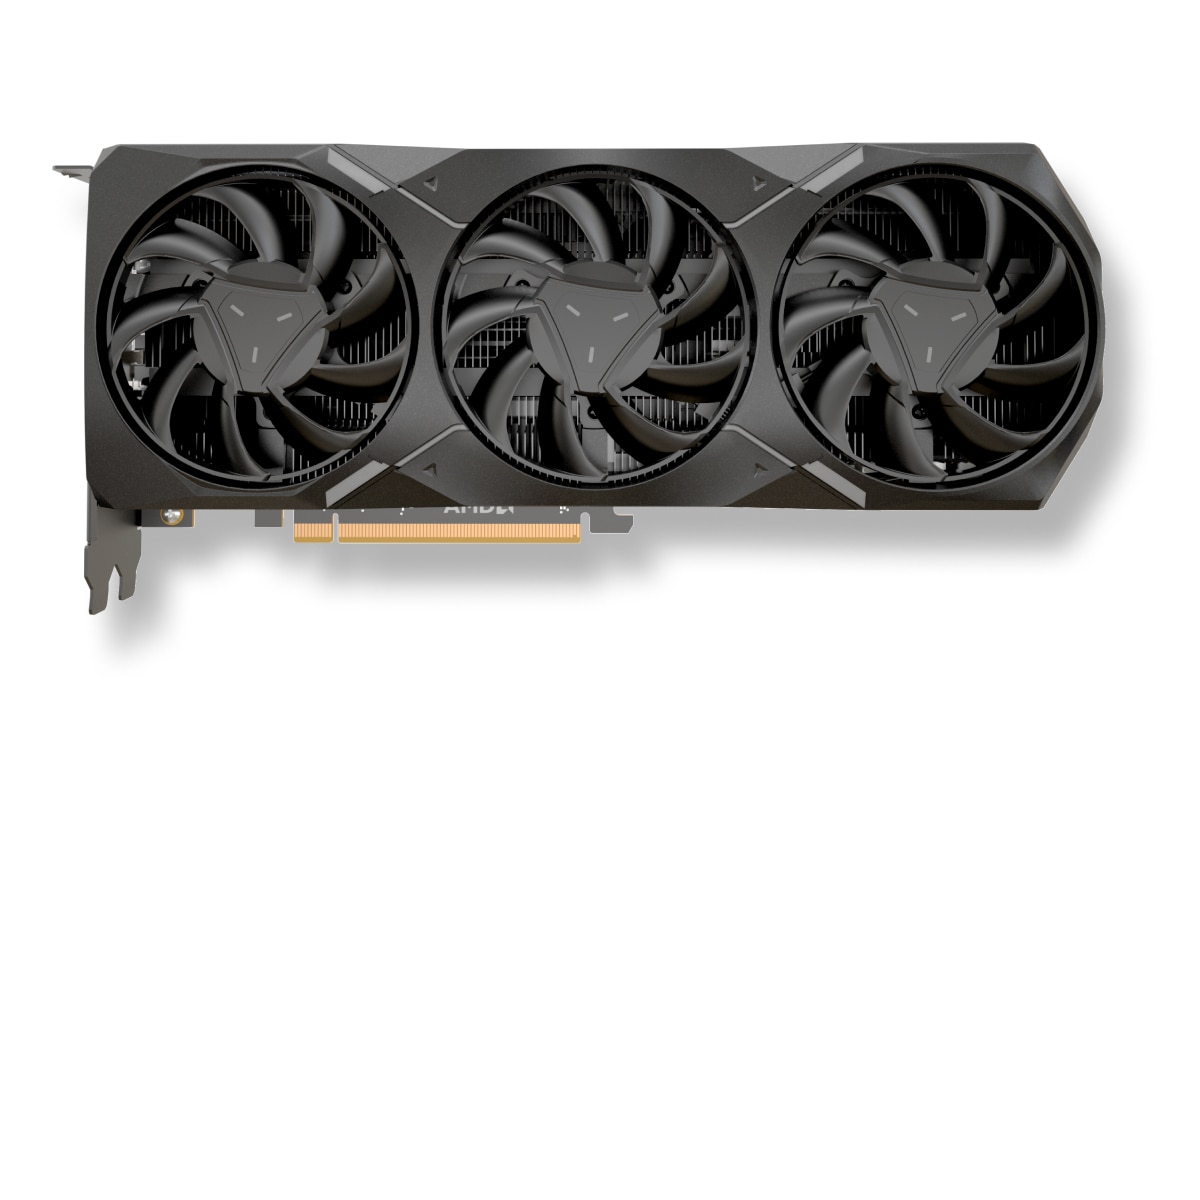
ベストな選択とは Intel Arc A580 Graphics または Intel Arc A580 Graphics? どのグラフィックカードが速い?
最適なグラフィックカードを選ぶために、比較を用意しました。それぞれの仕様やベンチマークを比較してみてください。
Intel Arc A580 Graphics has a base frequency of 1.700 GHz. メモリサイズ 8 GB. メモリータイプ GDDR6. で発売されました。 2022.
Intel Arc A580 Graphics has a base frequency of 1.700 GHz. メモリサイズ 8 GB. メモリータイプ GDDR6. で発売されました。 2022.
考慮すべき理由 共通ポジション Intel Arc A580 Graphics 他機種との比較のため、一般的なベンチマークでGPUを使用。.
考慮すべき理由 共通ポジション Intel Arc A580 Graphics 他機種との比較のため、一般的なベンチマークでGPUを使用。.
Intel Arc A580 Graphics
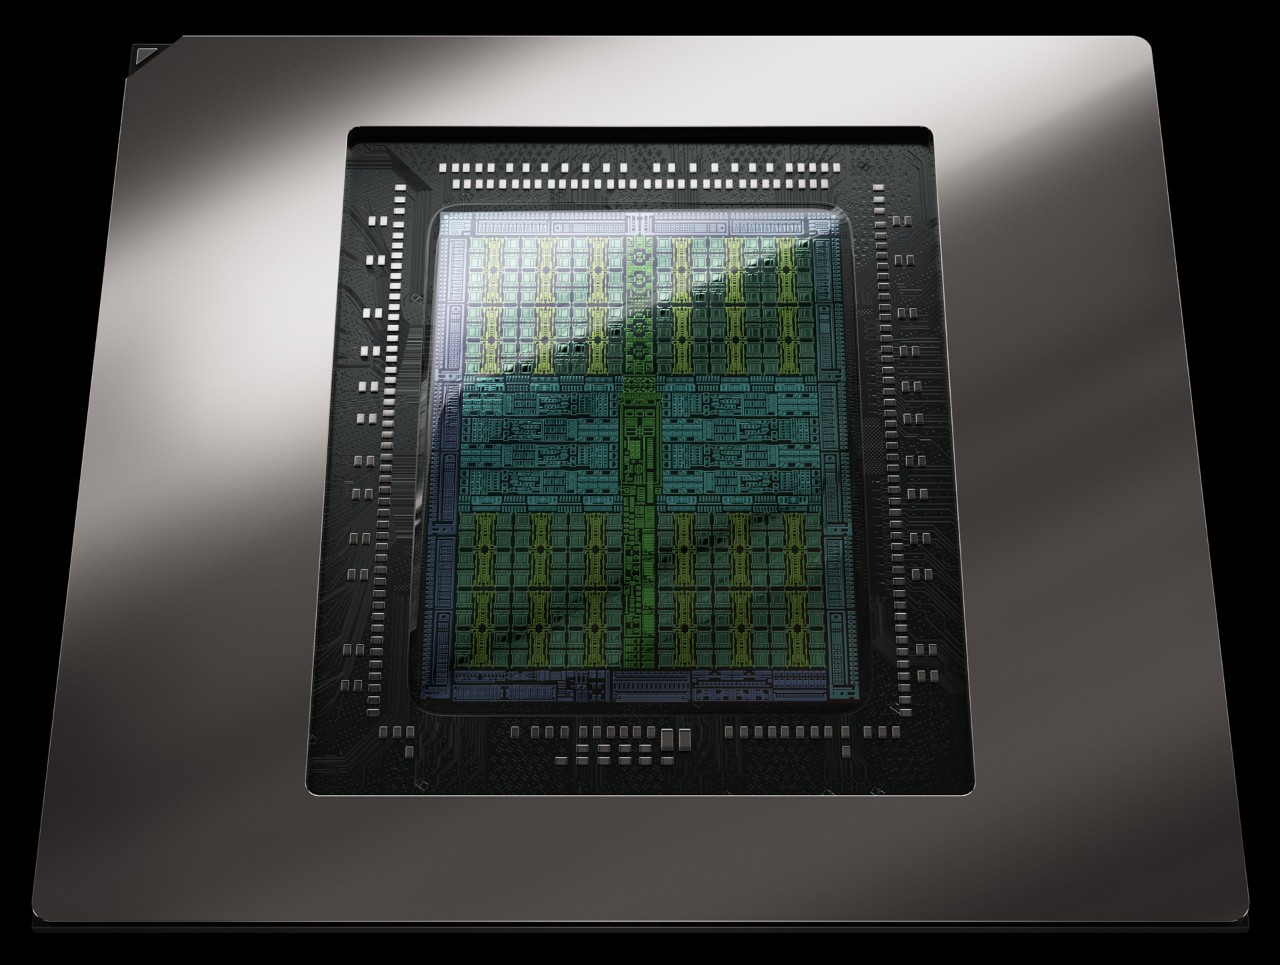
グラフィックスカードの基本技術データの比較 Intel Arc A580 Graphics と Intel Arc A580 Graphics, チップ、情報処理装置.
 Intel Arc A580 Graphics
ACM-G10 (Alchemist)
96
24
3072
384
192
Video memory capacity, type, bus width and bandwidth describe different properties. These values alone do not determine graphics performance.
512 GB/s
256 bit
2000 MHz
16 Gbps
8 GB
GDDR6
Published GPU clock frequencies describe different operating modes. Clock speed alone does not determine graphics performance.
1700 MHz
1700 MHz
-
はい
Graphics card power limits and recommended system power supply describe different specifications.
-
175 W
-
グラフィックスカード冷却システム用クーラーの種類とサイズ Intel Arc A580 Graphics と Intel Arc A580 Graphics.
Air cooling
Axial
-
-
0 dB / Silent
-
コネクティビティと接続.
-
-
2.3
-
4
PCIe 4.0 x16
1 x 8-Pin
-
-
コンピュータゲームに活かされる技術データ.
12_2 (Ultimate)
いいえ
No LED lighting
7680 × 4320
はい
動画・画像圧縮規格に対応した内蔵型.
Decode / Encode
Decode / Encode
Decode / Encode
いいえ
Decode / Encode
比較したデバイスのサイズ、重量、スロットの違い
-
-
-
-
-
GPUのインターフェースと発売時期の比較 Intel Arc A580 Graphics と Intel Arc A580 Graphics.
-
-
-
6 nm
2022
Shared tests with results for both models: 5
Each row uses one Blender version, operating system and compute backend.
| Test and settings | Intel Arc A580 Graphics | Intel Arc A580 Graphics | Result difference¹ |
|---|---|---|---|
| Blender 4.3.0 / ONEAPI / Windows | 1886.132265 samples/min Submissions: 7 | 1886.132265 samples/min Submissions: 7 | 0.0 % |
| Blender 4.2.0 / ONEAPI / Linux | 1792.405687 samples/min Submissions: 5 | 1792.405687 samples/min Submissions: 5 | 0.0 % |
| Blender 4.2.0 / ONEAPI / Windows | 1860.930462 samples/min Submissions: 14 | 1860.930462 samples/min Submissions: 14 | 0.0 % |
| Blender 4.1.0 / ONEAPI / Windows | 2013.484691 samples/min Submissions: 8 | 2013.484691 samples/min Submissions: 8 | 0.0 % |
| Blender 4.0.0 / ONEAPI / Windows | 1919.173854 samples/min Submissions: 23 | 1919.173854 samples/min Submissions: 23 | 0.0 % |
¹ Difference of the second result relative to the first in that row. No percentage is calculated for different upscaling algorithms. This compares published results, not a universal performance index.
いくつかの一般的なベンチマークの結果に基づき、より正確に、次のような性能差を見積もることができます Intel Arc A580 Graphics と Intel Arc A580 Graphics.
合成ベンチマークを比較して、あなたに最適なグラフィックカードを選びましょう
These are saved results from the earlier catalog. Measurement dates and test configurations were not recorded. Models with no comparable results are omitted.
Recent models: test results with identified primary sources — Game frame rates
Archived results. The original measurement method and test conditions have not been verified.
Higher values are better in this metric.
Higher values are better in this metric.


 English
 Russian
 German
 Portuguese
 Italian
 French
 Spanish
 Polish
 Chinese
 Korean