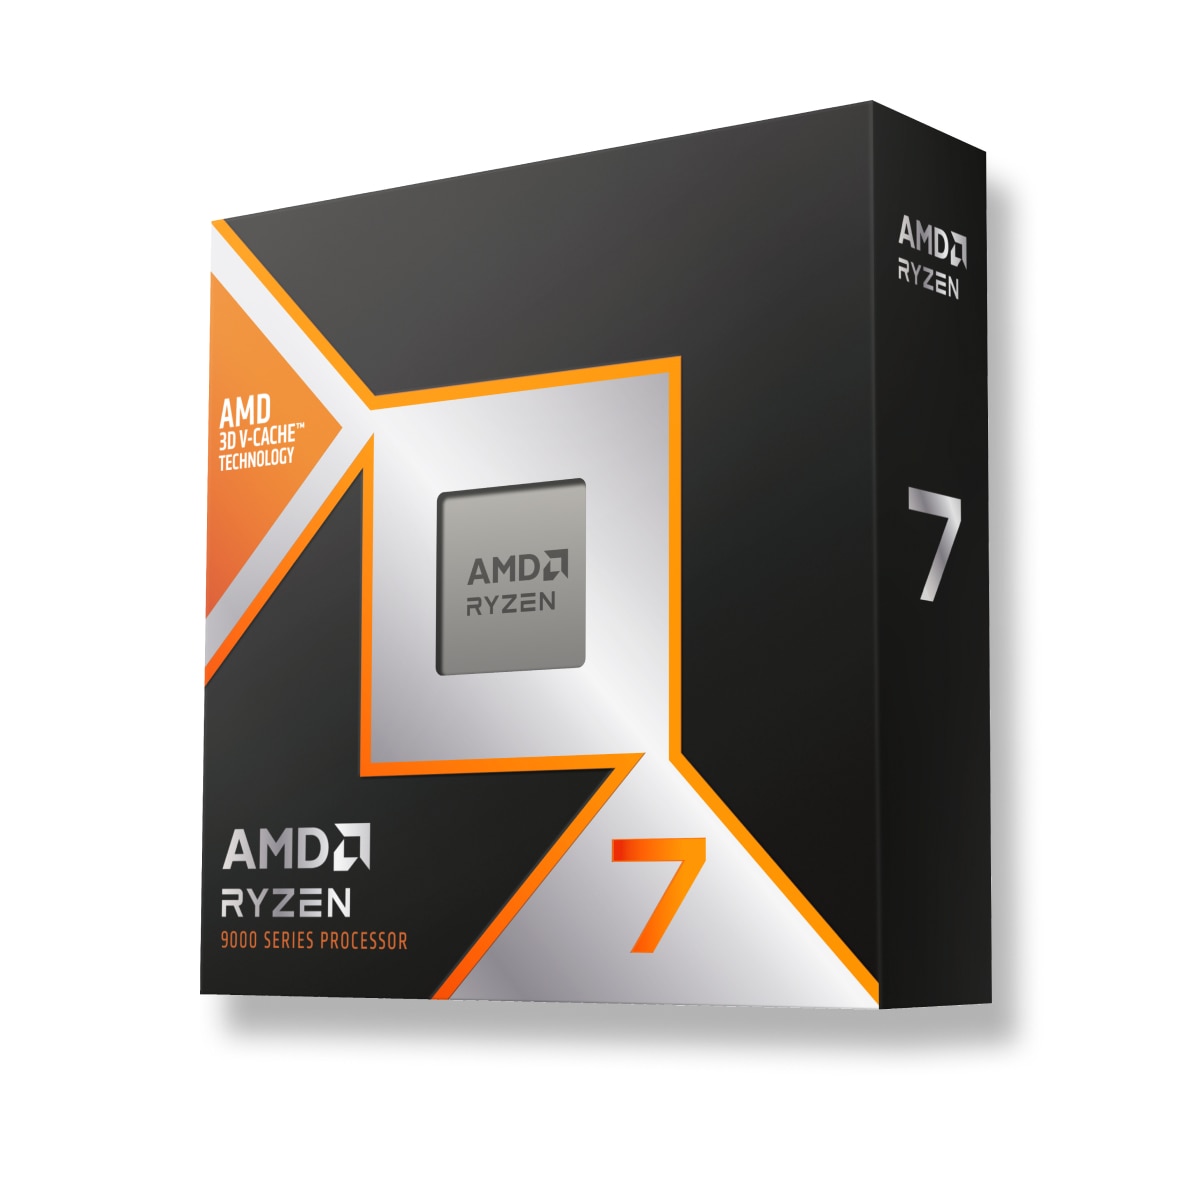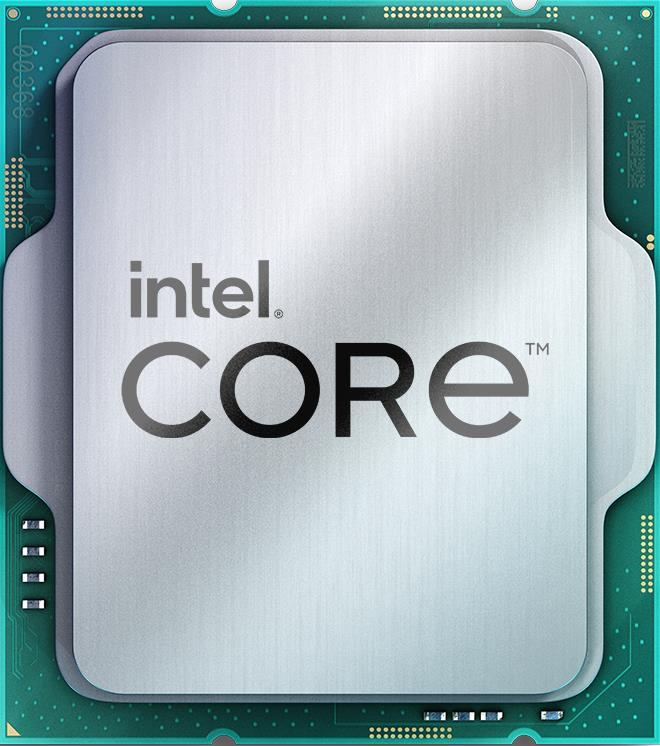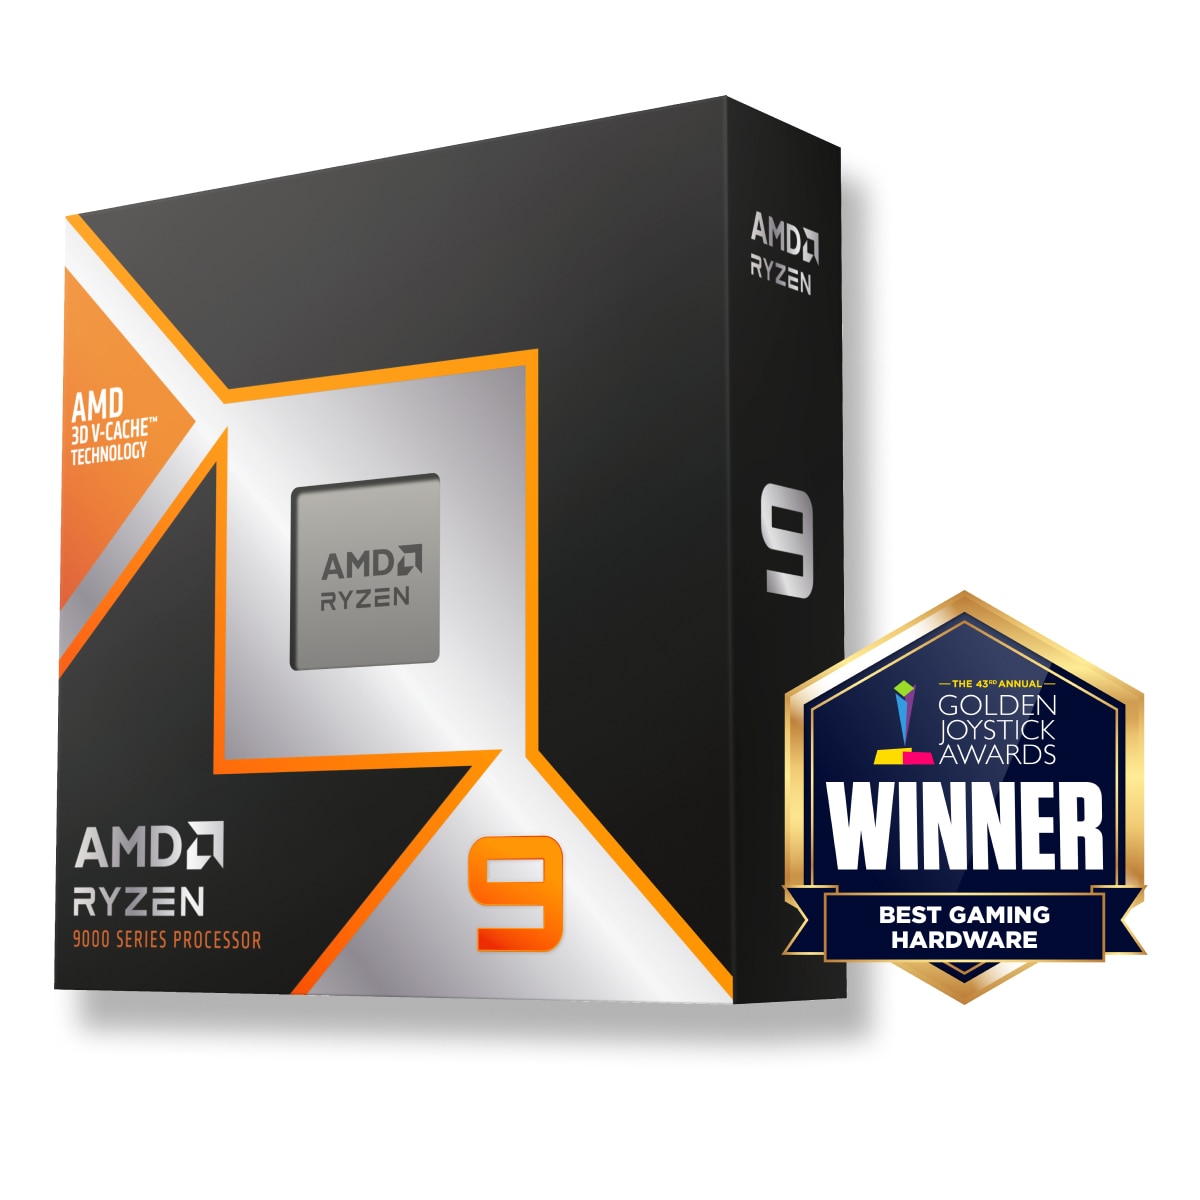

Intel Core i9-13900K
Intel Core i5-10300H
ビデオカード1の選択
ビデオカード2の選択

Intel Core i9-13900K 対 Intel Core i5-10300H. 仕様・性能・テスト

User rating
star star star star star
発売済み
Q4/2022
Intel Core i9-13900K
発売済み
Q2/2020
User rating
star star star star star
Intel Core i5-10300H

ベストな選択とは Intel Core i9-13900K または Intel Core i5-10300H? どちらのプロセッサーが速いか?

最適なプロセッサーを選ぶために、比較を用意しました。それぞれの仕様とベンチマークを比較してみてください。

Intel Core i9-13900K has a base frequency of 3.80 GHz. 24 CPU Cores / Threads. Stated TDP / base power 125 W. で発売されました。 Q4/2022.

Intel Core i5-10300H has a base frequency of 2.50 GHz. 4 CPU Cores / Threads. Stated TDP / base power 45 W. で発売されました。 Q2/2020.

相違点

  • 総合ランキングの順位

    (複数のベンチマークに基づく)

    7 left arrow 場所
  • クロックの高速化

    周辺 52% クロックスピードの向上

    3.80 GHz left arrow 2.50 GHz
  • より多くのコア数

    20 more cores

    24 left arrow 4

全ランキングでの順位

共通ポジション Intel Core i9-13900K 他機種との比較のため、一般的なベンチマークでCPUを比較。.

  • Cinebench R23 (Single-Core)
    2 place
  • Cinebench R23 (Multi-Core)
    11 place
  • Cinebench R20 (Single-Core)
    7 place
  • Cinebench R20 (Multi-Core)
    10 place
  • Geekbench 5, 64bit (Single-Core)
    9 place
  • Geekbench 5, 64bit (Multi-Core)
    15 place
  • iGPU - FP32 Performance (Single-precision GFLOPS)
    446 place
  • Lower stated TDP / base power

    Power limits alone do not measure performance per watt.

    45 W left arrow 125 W

全ランキングでの順位

共通ポジション Intel Core i5-10300H 他機種との比較のため、一般的なベンチマークでCPUを比較。.

  • Cinebench R20 (Single-Core)
    185 place
  • Cinebench R20 (Multi-Core)
    248 place
  • Cinebench R15 (Single-Core)
    146 place
  • Cinebench R15 (Multi-Core)
    340 place
  • Geekbench 5, 64bit (Single-Core)
    253 place
  • Geekbench 5, 64bit (Multi-Core)
    401 place
  • iGPU - FP32 Performance (Single-precision GFLOPS)
    743 place
  • Blender 2.81 (bmw27)
    112 place

仕様

技術データ
Intel Core i9-13900K Intel Core i9-13900K
Intel Core i5-10300H Intel Core i5-10300H
CPUファミリー、グループ

比較するプロセッサの背景情報、シリーズ、世代、市場セグメント。

  • CPUグループ
    Intel Core i 13000 left arrow Intel Core i 10000H
  • シリーズ
    Intel Core i9 left arrow Intel Core i5
  • 世代
    13 left arrow 10
  • 過去のモデル
    Intel Core i9-12900K left arrow -
  • セグメント
    Desktop / Server left arrow Mobile
  • Successor
    いいえ left arrow -
CPU 技術仕様

Core counts, threads, cache and clock modes describe the CPU configuration. Performance depends on the workload and comparable measured results.

  • A-Core
    8x Raptor Cove / 3.80 GHz (5.70 GHz) left arrow -
  • B-Core
    16x Gracemont / 3.00 GHz (4.20 GHz) left arrow -
  • Base Frequency
    3.8 GHz left arrow 2.5 GHz
  • コア・アーキテクチャ
    hybrid left arrow normal
  • CPUコア
    24 left arrow 4
  • CPUスレッド
    32 left arrow 8
  • Hyperthreading / SMT
    はい left arrow はい
  • オーバークロッキング
    いいえ left arrow いいえ
  • Turbo Frequency (1 Core)
    いいえ left arrow 4.5 GHz
  • Turbo Frequency (2 Cores)
    ターボなし left arrow -
  • Turbo Frequency (4 Cores)
    - left arrow 4.2 GHz
IGPU

内蔵グラフィックスは、CPUの性能に影響を与えず、グラフィックスカードがない場合やモバイルデバイスでグラフィックスカードの仕事を実行します。

  • DirectX Version
    12 left arrow 12
  • 実行部隊
    32 left arrow 24
  • 世代
    12 left arrow 9.5
  • GPU Frequency
    400 MHz left arrow 350 MHz
  • GPU名
    Intel Iris Xe Graphics 32 left arrow Intel UHD Graphics 630
  • GPU Turbo
    1450 MHz left arrow 1100 MHz
  • Max. displays
    4 left arrow 3
  • Max. GPU Memory
    16 GB left arrow 64 GB
  • 発売日
    Q4/2022 left arrow Q4/2017
  • シェーダー
    256 left arrow 192
  • ぎじゅつてきなかだい
    10 nm left arrow 14 nm
ハードウェアコーデック対応

コンテンツのエンコード、デコードに使用するコーデックを内蔵。必要な処理を大幅に高速化。

  • AV1
    Decode left arrow いいえ
  • H.264 / AVC
    Decode / Encode left arrow Decode / Encode
  • h265 / HEVC (8 bit)
    Decode / Encode left arrow Decode / Encode
  • h265 / HEVC (10 bit)
    Decode / Encode left arrow Decode / Encode
  • JPEG
    Decode / Encode left arrow Decode / Encode
  • VC-1
    Decode left arrow Decode
  • VP8
    Decode left arrow Decode / Encode
  • VP9
    Decode / Encode left arrow Decode / Encode
メモリスペック&PCI

サポートするRAMの種類、チャンネル数 Intel Core i5-10300H と Intel Core i9-13900K. マザーボードによっては、より高いまたは低いメモリ周波数がサポートされる場合があります。

  • ECC
    はい left arrow いいえ
  • マックス メモリ
    128 GB left arrow 128 GB
  • Memory Bandwidth
    89.6 GB/s left arrow -
  • メモリーチャンネル
    2 left arrow 2
  • メモリータイプ
    DDR5-5600 left arrow DDR4-2933
  • PCIe
    5.0 x 20 left arrow -
  • PCIeレーン
    - left arrow 16
  • PCIe版
    - left arrow 3.0
暗号化
  • AES-NI
    はい left arrow はい
エネルギー消費量

TDPの要求事項を比較する Intel Core i9-13900K と Intel Core i5-10300H Power specifications describe different manufacturer limits. TDP, base power and maximum turbo power are separate values; they do not establish measured system consumption.

  • Maximum Operating Temperature
    100 °C left arrow 100 °C
  • TDP (PL1, legacy label)
    125 W left arrow 45 W
  • TDP (PL2)
    241 W left arrow -
  • TDP down
    いいえ left arrow 35 W
  • TDP up
    いいえ left arrow -
技術・拡張性

アーキテクチャ、インターフェース、サポートされる追加命令 Intel Core i9-13900K と Intel Core i5-10300H, 仮想マシン技術、プロセス技術

  • 建築
    Raptor Lake S left arrow Comet Lake H
  • 命令セット(ISA)
    x86-64 (64 bit) left arrow x86-64 (64 bit)
  • ISAエクステンション
    SSE4.1, SSE4.2, AVX2, AVX2+ left arrow SSE4.1, SSE4.2, AVX2
  • L2-Cache
    32 MB left arrow -
  • L3-Cache
    36 MB left arrow 8 MB
  • 発売日
    Q4/2022 left arrow Q2/2020
  • ソケット
    LGA 1700 left arrow BGA 1440
  • ぎじゅつてきなかだい
    10 nm left arrow 14 nm
  • 仮想化
    VT-x, VT-x EPT, VT-d left arrow VT-x, VT-x EPT, VT-d

ベンチマーク

性能試験 CPUs
Individual model tests

These results have no shared test of both models with the same version and settings. They are shown separately without a percentage difference.

Intel Core i9-13900K

More results: 8

Intel Core i5-10300H

Results with primary test sources

Published measurements are separate from the archived index. Incomplete conditions and unknown run counts do not support ranking positions or calculated performance differences.

Model TestResultReported conditions
Intel Core i9-13900K Cinebench R15 / multi-core 6191 points Graphics card: GeForce RTX 3090
Intel Core i9-13900K Cinebench R15 / single-core 327 points Graphics card: GeForce RTX 3090
Intel Core i9-13900K Cinebench R20 / multi-core 15181 points Graphics card: GeForce RTX 3090
Intel Core i9-13900K Cinebench R20 / single-core 828 points Graphics card: GeForce RTX 3090
Intel Core i9-13900K Cinebench R23 / multi-core 40103 points Graphics card: GeForce RTX 3090
Intel Core i9-13900K Cinebench R23 / single-core 2267 points Graphics card: GeForce RTX 3090

Individual system tests

Results were obtained on the reported systems. Test versions and settings remain separate; incomplete conditions do not support calculated model performance differences.

RandomX / XMRig 6.22.2 / 10M / 32 threads / windows

Model ResultReported conditions
Intel Core i9-13900K 9028.644277 H/s RandomX / XMRig 6.22.2 / 10M / 32 threads / windows
System RAM: 32 GB
OS: Windows NT 10.0
Motherboard: ASRock / B760M-H2/M.2
Duration: 1107.586 s
User-submitted run; tuning and power settings are incomplete.

複数のベンチマークの結果をもとに、より正確に両者の性能差を見積もることができます。 Intel Core i9-13900K と Intel Core i5-10300H.

合成テストの値を比較して、最適なプロセッサを選ぼう!

These are saved results from the earlier catalog. Measurement dates and test configurations were not recorded. Models with no comparable results are omitted.

Recent models: test results with identified primary sources — Cinebench R23 · Cinebench R20 · Cinebench R15 · Cinebench 2026 · RandomX benchmark

Cinebench R20 (Single-Core)
Cinebench R20 SCは、デスクトップPCやノートPCで長時間作業を行うための高負荷CPUテスト、1CPUコアを使用し、ハイパーテーブルは使用しない.

Higher values are better in this metric.

888.000000
Intel Core i9-13900K
456.000000
Intel Core i5-10300H
Cinebench R20 (Multi-Core)
Cinebench R20 MCは、デスクトップPCやノートPCで、マルチコアやハイパースレッディングによる高負荷な長時間タスクのCPUテストです.

Higher values are better in this metric.

14820.000000
Intel Core i9-13900K
2125.000000
Intel Core i5-10300H
Geekbench 5, 64bit (Single-Core)
Geekbench 5 SCは、システム・メモリを集中的に使用するデスクトップまたはモバイル・プロセッサ向けの一般的なクロスプラットフォームの性能テストです.

Higher values are better in this metric.

2147.000000
Intel Core i9-13900K
1201.000000
Intel Core i5-10300H
Geekbench 5, 64bit (Multi-Core)
Geekbench 5 MCは、システム・メモリを集中的に使用するデスクトップまたはモバイル・プロセッサ向けのクロスプラットフォーム性能テストとして人気があります.

Higher values are better in this metric.

23982.000000
Intel Core i9-13900K
4510.000000
Intel Core i5-10300H
iGPU - FP32 Performance (Single-precision GFLOPS)
ゲームにおける内蔵GPU「iGPU」の性能について.

Higher values are better in this metric.

741.000000
Intel Core i9-13900K
422.000000
Intel Core i5-10300H

最新の比較