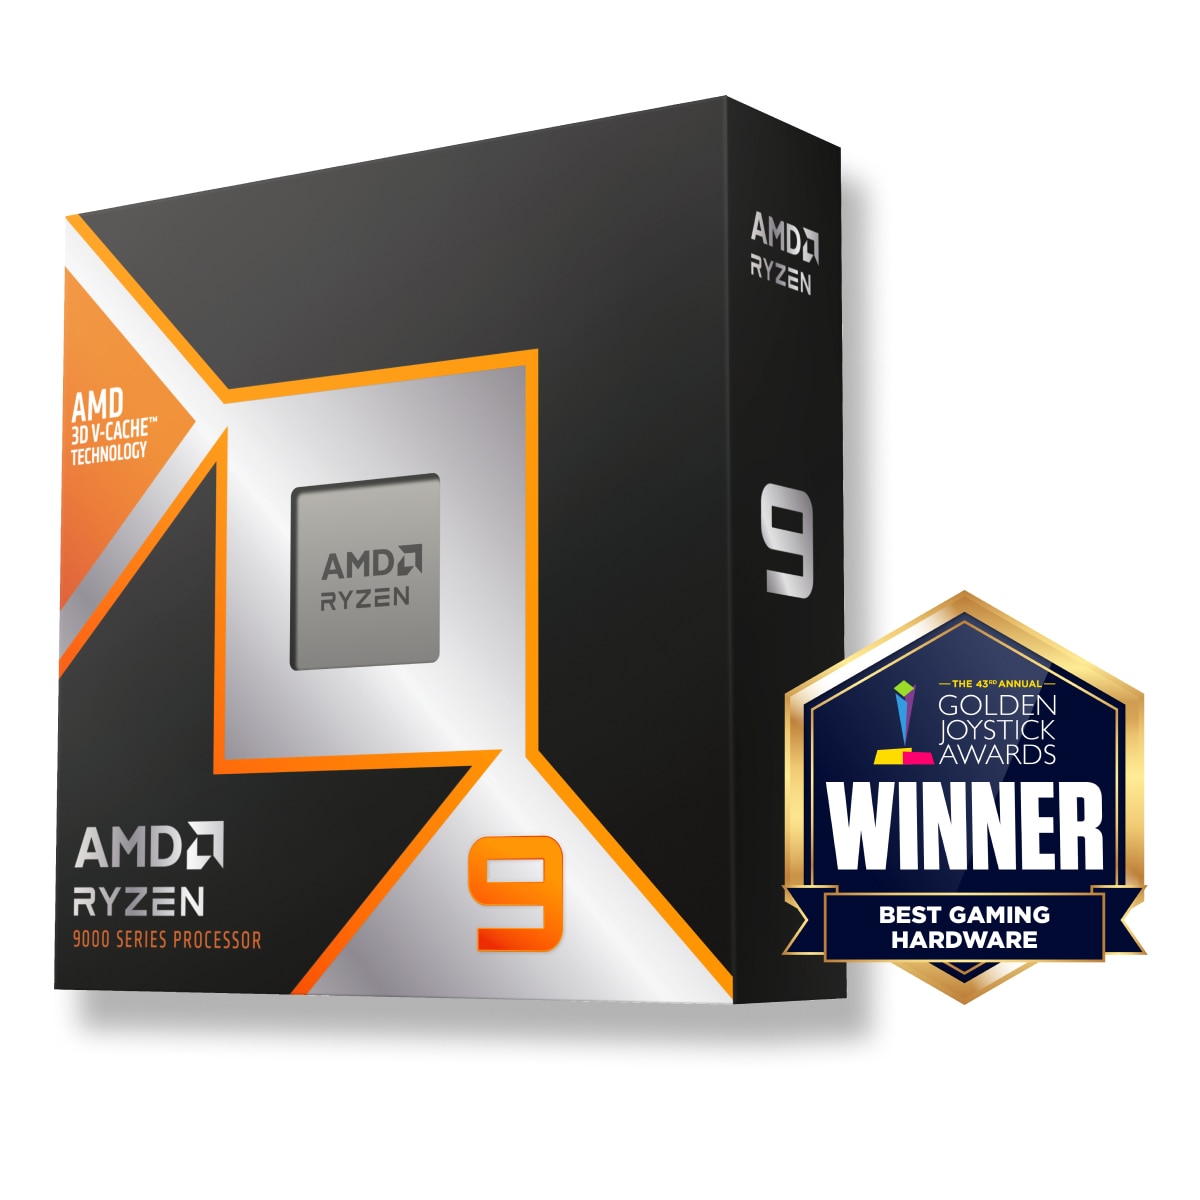

ベストな選択とは Intel Core i9-12900H または AMD Ryzen 7 7700X? どちらのプロセッサーが速いか?
最適なプロセッサーを選ぶために、比較を用意しました。それぞれの仕様とベンチマークを比較してみてください。
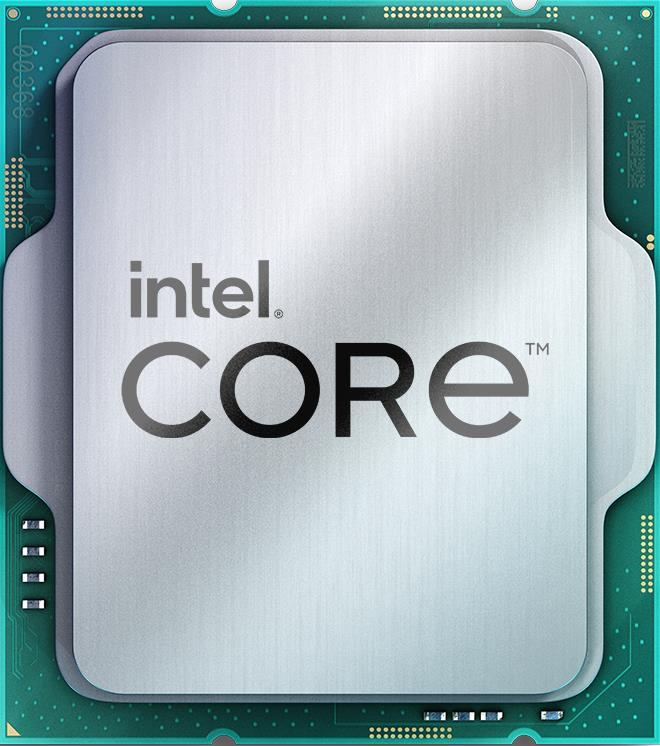
Intel Core i9-12900H has a base frequency of 2.50 GHz. 14 / 20 CPU Cores / Threads. Stated TDP / base power 45 W. で発売されました。 Q1/2022.
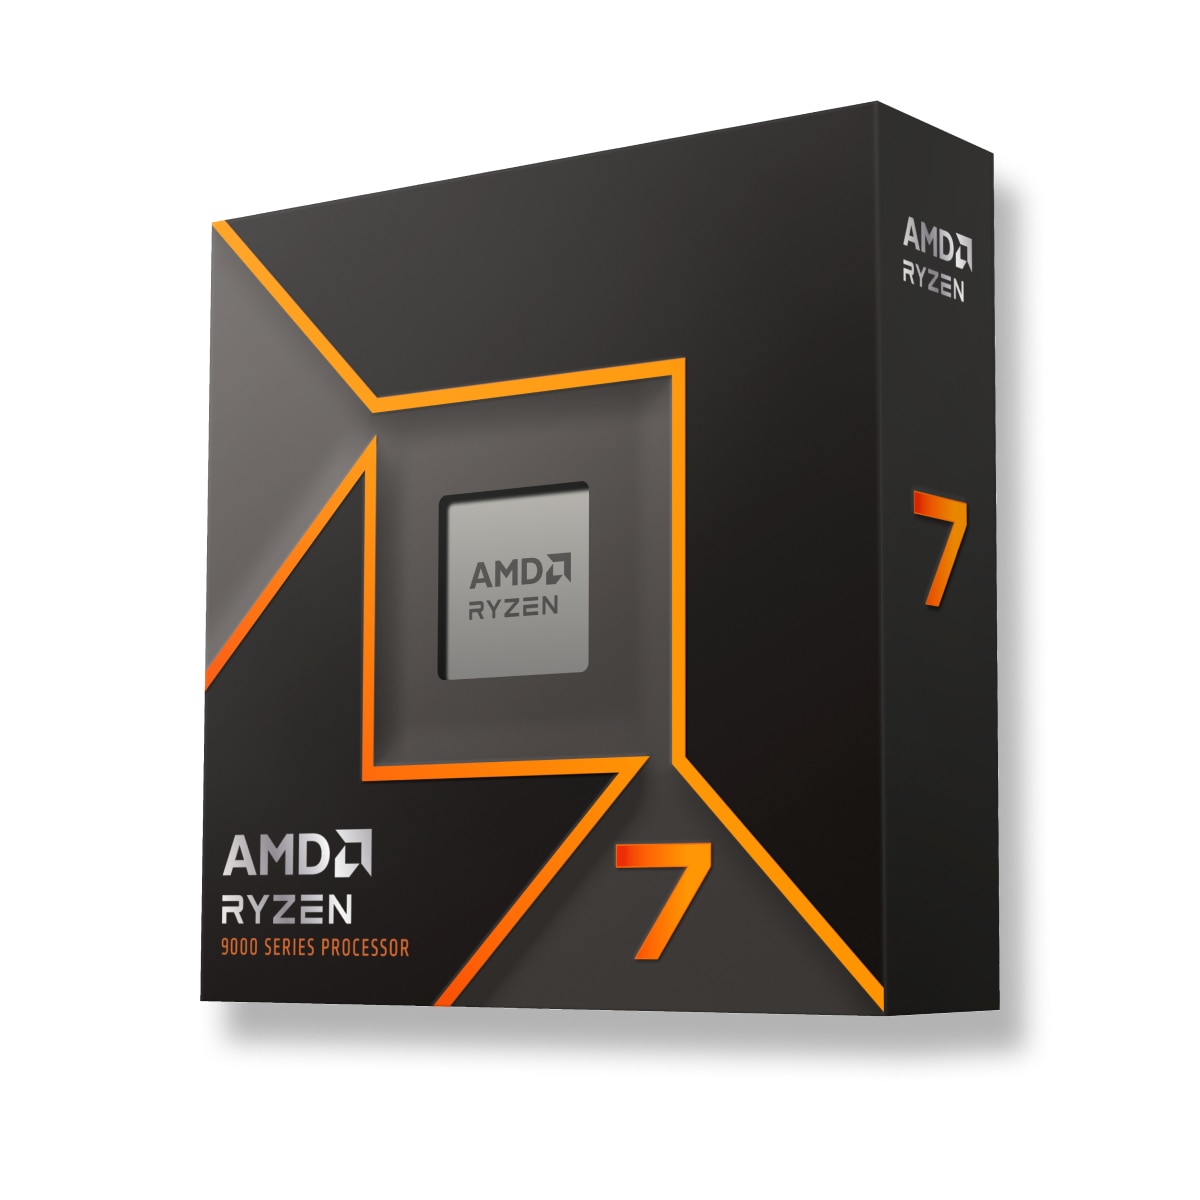
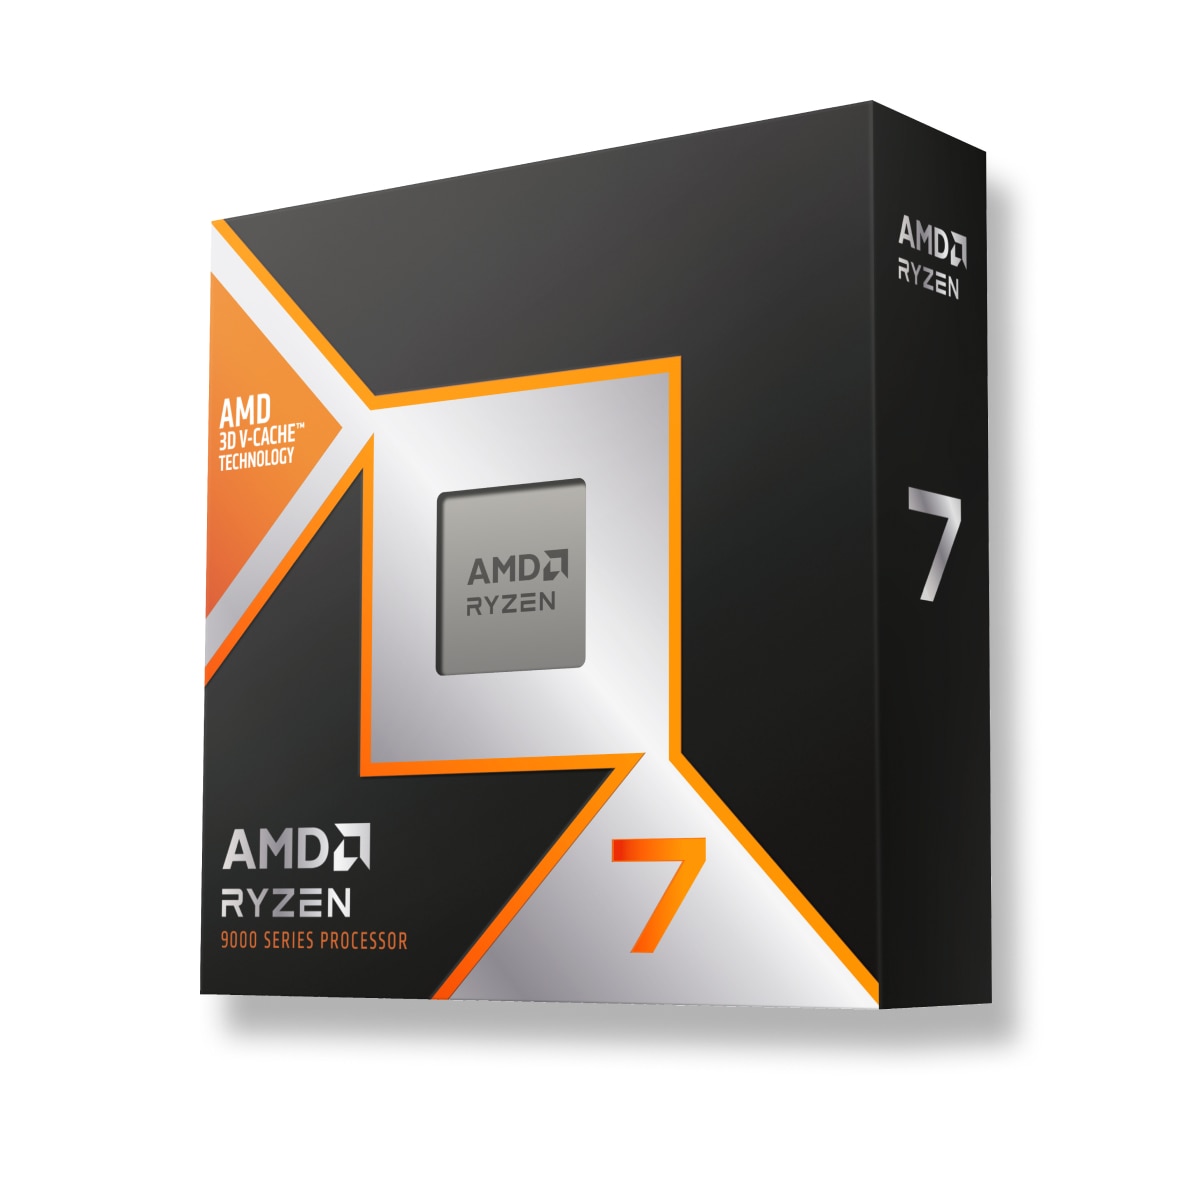
AMD Ryzen 7 7700X has a base frequency of 4.5 GHz. 8 / 16 CPU Cores / Threads. Stated TDP / base power 105 W. で発売されました。 2022-09-27.
考慮すべき理由 総合ランキングの順位
(複数のベンチマークに基づく)
 場所
より多くのコア数
6 more cores
 8
Lower stated TDP / base power
Power limits alone do not measure performance per watt.
105 W
共通ポジション Intel Core i9-12900H 他機種との比較のため、一般的なベンチマークでCPUを比較。.
考慮すべき理由 総合ランキングの順位
(複数のベンチマークに基づく)
場所
クロックの高速化
周辺 80% クロックスピードの向上
2.50 GHz
ターボクロックの高速化
周辺 8 % higher specified turbo frequency
5.00 GHz
共通ポジション AMD Ryzen 7 7700X 他機種との比較のため、一般的なベンチマークでCPUを比較。.
Intel Core i9-12900H
比較するプロセッサの背景情報、シリーズ、世代、市場セグメント。
 AMD Ryzen 7000
Ryzen
6
AMD Ryzen 7 5700X
Desktop
Desktops / Boxed Processor
Ryzen 7000 Series
Core counts, threads, cache and clock modes describe the CPU configuration. Performance depends on the workload and comparable measured results.
-
-
4.5 GHz
normal
8
16
はい
はい
5.4 GHz
-
8x
5.4 GHz
5.2 GHz
内蔵グラフィックスは、CPUの性能に影響を与えず、グラフィックスカードがない場合やモバイルデバイスでグラフィックスカードの仕事を実行します。
12
2
9
2200 MHz
AMD Radeon Graphics
2200 MHz
3
8 GB
Q3/2022
128
5 nm
2
コンテンツのエンコード、デコードに使用するコーデックを内蔵。必要な処理を大幅に高速化。
いいえ
Decode / Encode
Decode / Encode
Decode / Encode
Decode / Encode
Decode
Decode / Encode
Decode / Encode
サポートするRAMの種類、チャンネル数 AMD Ryzen 7 7700X と Intel Core i9-12900H. マザーボードによっては、より高いまたは低いメモリ周波数がサポートされる場合があります。
はい
128 GB
2
DDR5
PCIe 5.0
83.2 GB/s
はい
TDPの要求事項を比較する Intel Core i9-12900H と AMD Ryzen 7 7700X Power specifications describe different manufacturer limits. TDP, base power and maximum turbo power are separate values; they do not establish measured system consumption.
95 °C
105 W
142 W
105 W
アーキテクチャ、インターフェース、サポートされる追加命令 Intel Core i9-12900H と AMD Ryzen 7 7700X, 仮想マシン技術、プロセス技術
Raphael (Zen 4)
x86-64 (64 bit)
SSE4a, SSE4.1, SSE4.2,FMA3, AVX2, AVX512
8 MB
32 MB
100-100000591WOF
2022-09-27
AM5
TSMC 5nm FinFET
AMD-V, SVM
Chiplet
Raphael AM5
Technical data sheet
Windows 10, Windows 11, Linux
399 $
Shared tests with results for both models: 8
Each row uses one Blender version, operating system and compute backend.
| Test and settings | Intel Core i9-12900H | AMD Ryzen 7 7700X | Result difference¹ |
|---|---|---|---|
| Blender 5.2.0 / CPU / Windows | 155.062561 samples/min Submissions: 9 | 284.53745 samples/min Submissions: 16 | +83.5 % |
| Blender 4.5.0 / CPU / Linux | 182.811539 samples/min Submissions: 5 | 318.513923 samples/min Submissions: 43 | +74.2 % |
| Blender 4.5.0 / CPU / Windows | 159.549039 samples/min Submissions: 20 | 271.572418 samples/min Submissions: 91 | +70.2 % |
| Blender 4.4.0 / CPU / Windows | 189.264863 samples/min Submissions: 15 | 266.588919 samples/min Submissions: 80 | +40.9 % |
| Blender 4.3.0 / CPU / Windows | 171.04592 samples/min Submissions: 8 | 262.849915 samples/min Submissions: 98 | +53.7 % |
| Blender 4.2.0 / CPU / Windows | 189.125975 samples/min Submissions: 23 | 261.844041 samples/min Submissions: 155 | +38.4 % |
| Blender 4.1.0 / CPU / Windows | 207.663846 samples/min Submissions: 10 | 269.721074 samples/min Submissions: 47 | +29.9 % |
| Blender 4.0.0 / CPU / Windows | 191.400675 samples/min Submissions: 41 | 276.02687 samples/min Submissions: 146 | +44.2 % |
¹ Difference of the second result relative to the first in that row. No percentage is calculated for different upscaling algorithms. This compares published results, not a universal performance index.
These results have no shared test of both models with the same version and settings. They are shown separately without a percentage difference.
Results were obtained on the reported systems. Test versions and settings remain separate; incomplete conditions do not support calculated model performance differences.
| Model | Result | Reported conditions |
|---|---|---|
| AMD Ryzen 7 7700X | 9545.08142 H/s | RandomX / XMRig 6.26.0 / 1M / 16 threads / windows System RAM: 32 GB OS: Windows NT 10.0 Motherboard: ASUSTeK COMPUTER INC. / ROG STRIX X670E-A GAMING WIFI Duration: 104.766 s User-submitted run; tuning and power settings are incomplete. |
| Model | Result | Reported conditions |
|---|---|---|
| Intel Core i9-12900H | 5800.194887 H/s | RandomX / XMRig 6.26.0 / 1M / 17 threads / windows System RAM: 32 GB OS: Windows NT 10.0 Motherboard: ASUSTeK COMPUTER INC. / GU603ZW Duration: 172.408 s User-submitted run; tuning and power settings are incomplete. |
複数のベンチマークの結果をもとに、より正確に両者の性能差を見積もることができます。 Intel Core i9-12900H と AMD Ryzen 7 7700X.
合成テストの値を比較して、最適なプロセッサを選ぼう!
These are saved results from the earlier catalog. Measurement dates and test configurations were not recorded. Models with no comparable results are omitted.
Recent models: test results with identified primary sources — Cinebench R23 · Cinebench R20 · Cinebench R15 · Cinebench 2026 · RandomX benchmark
Higher values are better in this metric.
Higher values are better in this metric.
Higher values are better in this metric.
Higher values are better in this metric.
Higher values are better in this metric.
Higher values are better in this metric.
Higher values are better in this metric.
Higher values are better in this metric.
Higher values are better in this metric.


 English
 Russian
 German
 Portuguese
 Italian
 French
 Spanish
 Polish
 Chinese
 Korean