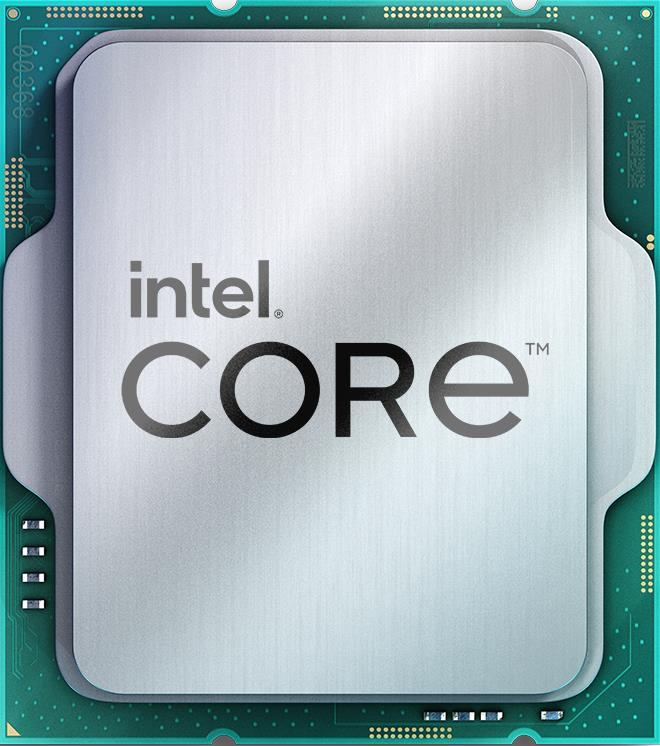

Intel Core i3-8100
AMD Phenom II X6 1065T
ビデオカード1の選択
ビデオカード2の選択

Intel Core i3-8100 対 AMD Phenom II X6 1065T. 仕様・性能・テスト

User rating
star star star star star
発売済み
Q4/2017
Intel Core i3-8100
Intel Core i3-8100
発売済み
Q1/2010
User rating
star star star star star
AMD Phenom II X6 1065T

ベストな選択とは Intel Core i3-8100 または AMD Phenom II X6 1065T? どちらのプロセッサーが速いか?

最適なプロセッサーを選ぶために、比較を用意しました。それぞれの仕様とベンチマークを比較してみてください。

Intel Core i3-8100 has a base frequency of 3.60 GHz. 4 CPU Cores / Threads. Stated TDP / base power 65 W. で発売されました。 Q4/2017.

AMD Phenom II X6 1065T has a base frequency of 2.90 GHz. 6 CPU Cores / Threads. Stated TDP / base power 95 W. で発売されました。 Q1/2010.

相違点

  • クロックの高速化

    周辺 24% クロックスピードの向上

    3.60 GHz left arrow 2.90 GHz
  • Lower stated TDP / base power

    Power limits alone do not measure performance per watt.

    65 W left arrow 95 W

全ランキングでの順位

共通ポジション Intel Core i3-8100 他機種との比較のため、一般的なベンチマークでCPUを比較。.

  • Cinebench R20 (Single-Core)
    354 place
  • Cinebench R20 (Multi-Core)
    328 place
  • Cinebench R15 (Single-Core)
    370 place
  • Cinebench R15 (Multi-Core)
    474 place
  • Geekbench 5, 64bit (Single-Core)
    442 place
  • Geekbench 5, 64bit (Multi-Core)
    567 place
  • iGPU - FP32 Performance (Single-precision GFLOPS)
    743 place
  • Geekbench 3, 64bit (Single-Core)
    220 place
  • Geekbench 3, 64bit (Multi-Core)
    310 place
  • Cinebench R11.5, 64bit (Single-Core)
    106 place
  • Cinebench R11.5, 64bit (Multi-Core)
    299 place
  • Cinebench R11.5, 64bit (iGPU, OpenGL)
    71 place
  • Estimated results for PassMark CPU Mark
    497 place
  • より多くのコア数

    2 more cores

    6 left arrow 4

全ランキングでの順位

共通ポジション AMD Phenom II X6 1065T 他機種との比較のため、一般的なベンチマークでCPUを比較。.

  • Cinebench R15 (Single-Core)
    836 place
  • Cinebench R15 (Multi-Core)
    574 place
  • Geekbench 3, 64bit (Single-Core)
    680 place
  • Geekbench 3, 64bit (Multi-Core)
    407 place
  • Cinebench R11.5, 64bit (Single-Core)
    561 place
  • Cinebench R11.5, 64bit (Multi-Core)
    373 place
  • Estimated results for PassMark CPU Mark
    640 place

仕様

技術データ
Intel Core i3-8100 Intel Core i3-8100
AMD Phenom II X6 1065T AMD Phenom II X6 1065T
CPUファミリー、グループ

比較するプロセッサの背景情報、シリーズ、世代、市場セグメント。

  • CPUグループ
    Intel Core i 8000 left arrow AMD Phenom II - 1000
  • シリーズ
    Intel Core i3 left arrow AMD Phenom II
  • 世代
    8 left arrow 5
  • 過去のモデル
    Intel Core i3-7100 left arrow -
  • セグメント
    Desktop / Server left arrow Desktop / Server
  • Successor
    Intel Core i3-9100 left arrow -
CPU 技術仕様

Core counts, threads, cache and clock modes describe the CPU configuration. Performance depends on the workload and comparable measured results.

  • Base Frequency
    3.6 GHz left arrow 2.9 GHz
  • コア・アーキテクチャ
    normal left arrow normal
  • CPUコア
    4 left arrow 6
  • CPUスレッド
    4 left arrow 6
  • Hyperthreading / SMT
    いいえ left arrow いいえ
  • オーバークロッキング
    いいえ left arrow はい
  • Turbo Frequency (1 Core)
    ターボなし left arrow 3.4 GHz
  • Turbo Frequency (4 Cores)
    ターボなし left arrow -
  • Turbo Frequency (6 Cores)
    - left arrow 3.4 GHz
IGPU

内蔵グラフィックスは、CPUの性能に影響を与えず、グラフィックスカードがない場合やモバイルデバイスでグラフィックスカードの仕事を実行します。

  • DirectX Version
    12 left arrow -
  • 実行部隊
    24 left arrow -
  • 世代
    9.5 left arrow -
  • GPU Frequency
    350 MHz left arrow -
  • GPU名
    Intel UHD Graphics 630 left arrow iGPUなし
  • GPU Turbo
    1100 MHz left arrow ターボなし
  • Max. displays
    3 left arrow -
  • Max. GPU Memory
    64 GB left arrow -
  • 発売日
    Q4/2017 left arrow -
  • シェーダー
    192 left arrow -
  • ぎじゅつてきなかだい
    14 nm left arrow -
ハードウェアコーデック対応

コンテンツのエンコード、デコードに使用するコーデックを内蔵。必要な処理を大幅に高速化。

  • AV1
    いいえ left arrow いいえ
  • H.264 / AVC
    Decode / Encode left arrow いいえ
  • h265 / HEVC (8 bit)
    Decode / Encode left arrow いいえ
  • h265 / HEVC (10 bit)
    Decode / Encode left arrow いいえ
  • JPEG
    Decode / Encode left arrow いいえ
  • VC-1
    Decode left arrow いいえ
  • VP8
    Decode / Encode left arrow いいえ
  • VP9
    Decode / Encode left arrow いいえ
メモリスペック&PCI

サポートするRAMの種類、チャンネル数 AMD Phenom II X6 1065T と Intel Core i3-8100. マザーボードによっては、より高いまたは低いメモリ周波数がサポートされる場合があります。

  • ECC
    はい left arrow いいえ
  • マックス メモリ
    64 GB left arrow -
  • メモリーチャンネル
    2 left arrow 2
  • メモリータイプ
    DDR4-2400 left arrow DDR2-1066
  • PCIeレーン
    16 left arrow -
  • PCIe版
    3.0 left arrow -
暗号化
  • AES-NI
    はい left arrow いいえ
エネルギー消費量

TDPの要求事項を比較する Intel Core i3-8100 と AMD Phenom II X6 1065T Power specifications describe different manufacturer limits. TDP, base power and maximum turbo power are separate values; they do not establish measured system consumption.

  • Maximum Operating Temperature
    100 °C left arrow -
  • TDP (PL1, legacy label)
    65 W left arrow 95 W
技術・拡張性

アーキテクチャ、インターフェース、サポートされる追加命令 Intel Core i3-8100 と AMD Phenom II X6 1065T, 仮想マシン技術、プロセス技術

  • 建築
    Coffee Lake S left arrow Thuban (K10)
  • 命令セット(ISA)
    x86-64 (64 bit) left arrow x86-64 (64 bit)
  • ISAエクステンション
    SSE4.1, SSE4.2, AVX2 left arrow SSE3, SSE4a
  • L3-Cache
    6 MB left arrow 6 MB
  • 発売日
    Q4/2017 left arrow Q1/2010
  • ソケット
    LGA 1151-2 left arrow AM3
  • ぎじゅつてきなかだい
    14 nm left arrow 45 nm
  • 仮想化
    VT-x, VT-x EPT, VT-d left arrow AMD-V

ベンチマーク

性能試験 CPUs

複数のベンチマークの結果をもとに、より正確に両者の性能差を見積もることができます。 Intel Core i3-8100 と AMD Phenom II X6 1065T.

合成テストの値を比較して、最適なプロセッサを選ぼう!

These are saved results from the earlier catalog. Measurement dates and test configurations were not recorded. Models with no comparable results are omitted.

Recent models: test results with identified primary sources — Cinebench R23 · Cinebench R20 · Cinebench R15 · Cinebench 2026 · RandomX benchmark

Cinebench R15 (Single-Core)
シネベンチR15 SCは、デスクトップまたはラップトップコンピュータのコンピューティングモジュールの限界までストレスを与え、ハードウェアの主要な性能パラメータを正確に決定します.

Higher values are better in this metric.

154.000000
Intel Core i3-8100
85.000000
AMD Phenom II X6 1065T
Cinebench R15 (Multi-Core)
Cinebench R15 MCは、デスクトップあるいはラップトップコンピュータのコンピューティングモジュールの限界までストレスを与え、ハードウェアの主要なパフォーマンスパラメータを正確に決定します.

Higher values are better in this metric.

616.000000
Intel Core i3-8100
460.000000
AMD Phenom II X6 1065T
Geekbench 3, 64bit (Single-Core)
Geekbench 3 SC(1CPUコア)、Windows、Mac、Linux、Ansroid、iOSの実際の3Dシナリオをシミュレートするストレステストを含む.

Higher values are better in this metric.

3834.000000
Intel Core i3-8100
1778.000000
AMD Phenom II X6 1065T
Geekbench 3, 64bit (Multi-Core)
マルチコアとハイパースレッディングを使用したGeekbench 3 MCは、Windows、Mac、Linux、Ansroid、iOSの実際の3Dシナリオをシミュレートするストレステストを含みます。.

Higher values are better in this metric.

12193.000000
Intel Core i3-8100
8731.000000
AMD Phenom II X6 1065T
Cinebench R11.5, 64bit (Single-Core)
PCのCPUとGPUのテストでは、CINEMA 4Dをベースにした特定の3Dシーンをシングルコアモードでレンダリングします.

Higher values are better in this metric.

1.910000
Intel Core i3-8100
1.030000
AMD Phenom II X6 1065T
Cinebench R11.5, 64bit (Multi-Core)
The PC CPU and GPU test involves rendering a specific 3D scene in multi-core mode and hyperthreading, based on CINEMA 4D

Higher values are better in this metric.

6.550000
Intel Core i3-8100
5.340000
AMD Phenom II X6 1065T
Estimated results for PassMark CPU Mark
PassMarkは、ファイル圧縮、暗号化、物理関連のタスクにおいて、複雑な数学的計算を行い、CPUの性能を判定するテストスイートです.

Higher values are better in this metric.

8114.000000
Intel Core i3-8100
5392.000000
AMD Phenom II X6 1065T

最新の比較