
ベストな選択とは AMD Ryzen 7 9700X または AMD Ryzen 7 5800X? どちらのプロセッサーが速いか?
Compare the available specifications of these models.
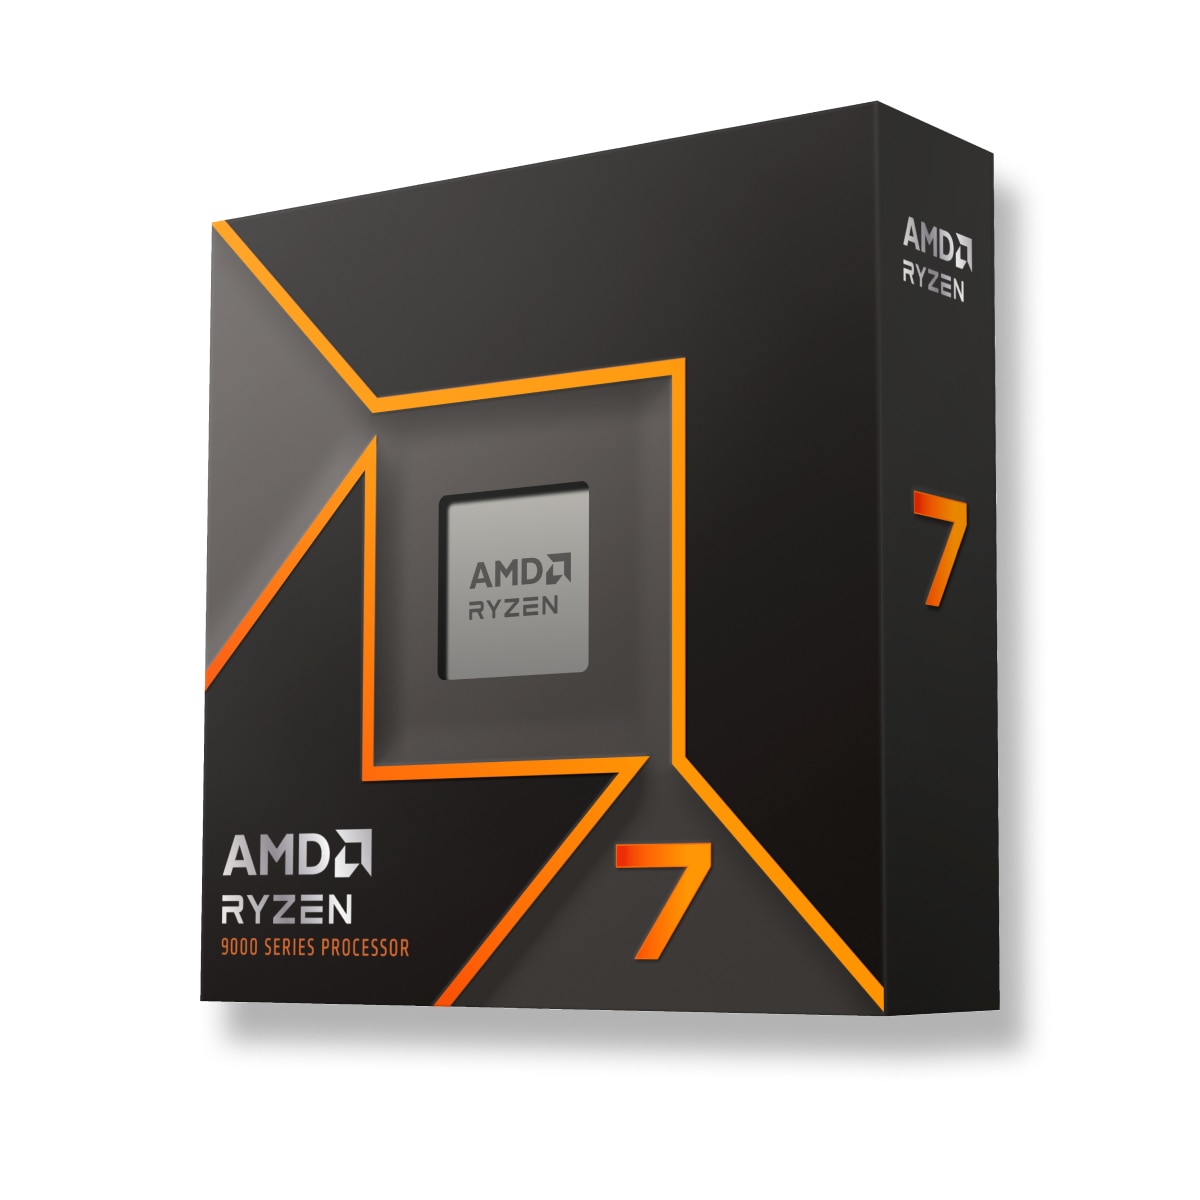
AMD Ryzen 7 9700X has a base frequency of 3.8 GHz. 8 / 16 CPU Cores / Threads. Stated TDP / base power 65 W. で発売されました。 2024-08-08.
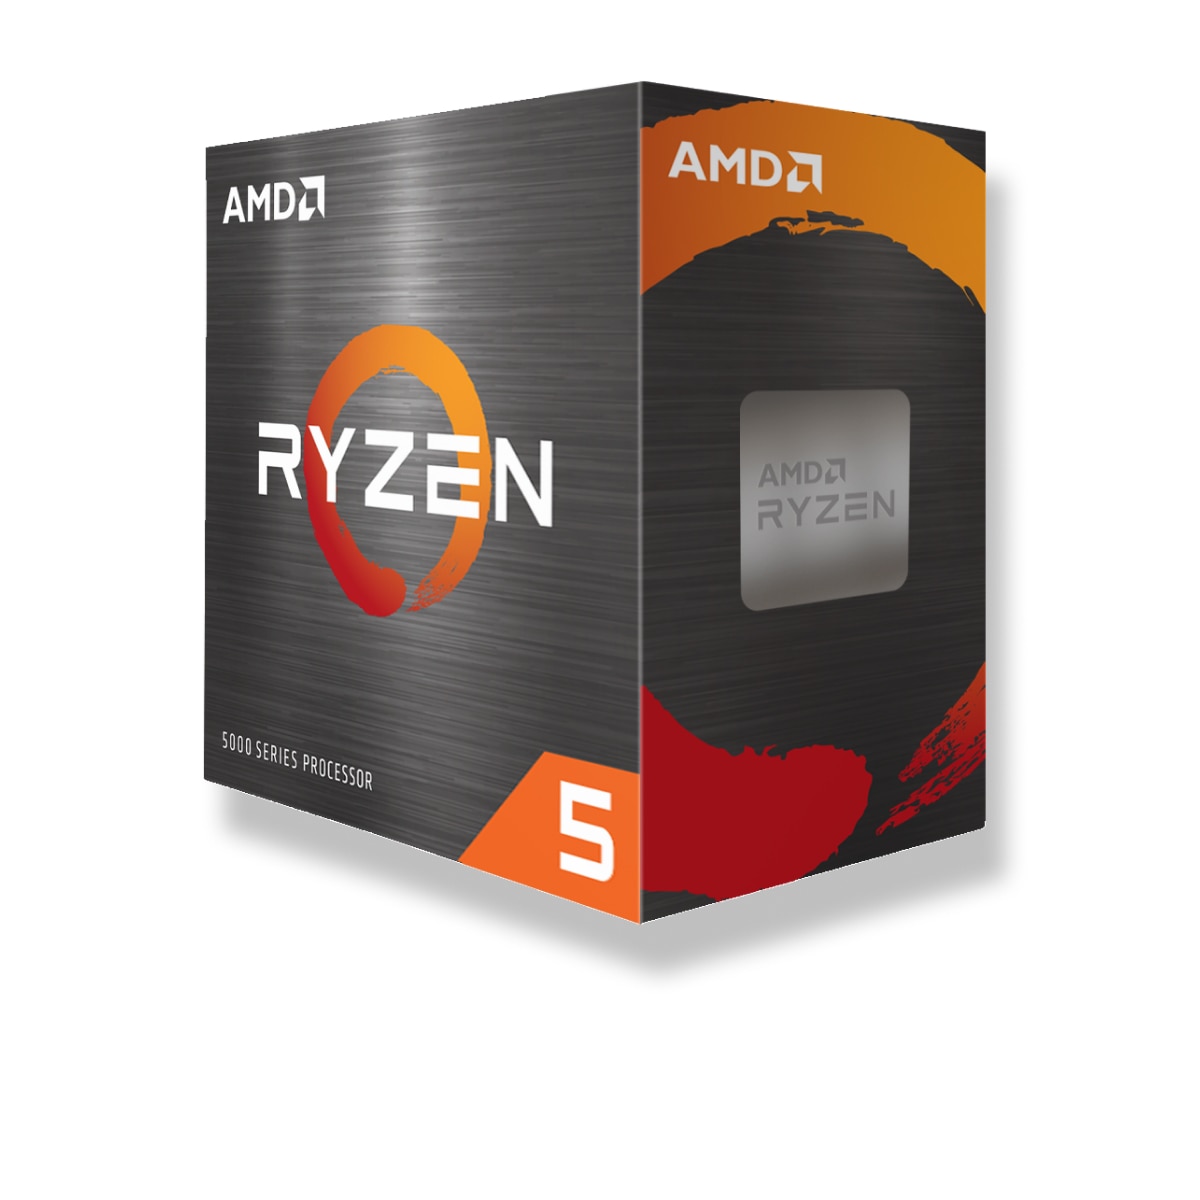
AMD Ryzen 7 5800X has a base frequency of 3.8 GHz. 8 / 16 CPU Cores / Threads. Stated TDP / base power 105 W. で発売されました。 2020-11-05.
考慮すべき理由 ターボクロックの高速化
周辺 17% higher specified turbo frequency
 4.7 GHz
Lower stated TDP / base power
Power limits alone do not measure performance per watt.
105 W
考慮すべき理由 総合ランキングの順位
(複数のベンチマークに基づく)
 場所
共通ポジション AMD Ryzen 7 5800X 他機種との比較のため、一般的なベンチマークでCPUを比較。.
AMD Ryzen 7 9700X
比較するプロセッサの背景情報、シリーズ、世代、市場セグメント。
 Ryzen
Desktops / Boxed Processor
Desktop
Ryzen 5000 Series
AMD Ryzen 5000
4
AMD Ryzen 7 3800X
Core counts, threads, cache and clock modes describe the CPU configuration. Performance depends on the workload and comparable measured results.
3.8 GHz
8
16
4.7 GHz
はい
4.7 GHz
normal
はい
4.4 GHz
内蔵グラフィックスは、CPUの性能に影響を与えず、グラフィックスカードがない場合やモバイルデバイスでグラフィックスカードの仕事を実行します。
-
None
-
コンテンツのエンコード、デコードに使用するコーデックを内蔵。必要な処理を大幅に高速化。
いいえ
いいえ
いいえ
いいえ
いいえ
いいえ
いいえ
いいえ
サポートするRAMの種類、チャンネル数 AMD Ryzen 7 5800X と AMD Ryzen 7 9700X. マザーボードによっては、より高いまたは低いメモリ周波数がサポートされる場合があります。
2
DDR4
PCIe 4.0
はい
128 GB
20
4.0
3200
はい
TDPの要求事項を比較する AMD Ryzen 7 9700X と AMD Ryzen 7 5800X Power specifications describe different manufacturer limits. TDP, base power and maximum turbo power are separate values; they do not establish measured system consumption.
105 W
90 °C
-
105 W
アーキテクチャ、インターフェース、サポートされる追加命令 AMD Ryzen 7 9700X と AMD Ryzen 7 5800X, 仮想マシン技術、プロセス技術
Vermeer (Zen 3)
Vermeer
-
4 MB
32 MB
2020-11-05
AM4
TSMC 7nm FinFET
x86-64 (64 bit)
SSE4a, SSE4.1, SSE4.2, AVX2, FMA3
AMD-V, SVM
Shared tests with results for both models: 15
Each row uses one Blender version, operating system and compute backend.
| Test and settings | AMD Ryzen 7 9700X | AMD Ryzen 7 5800X | Result difference¹ |
|---|---|---|---|
| Blender 5.2.0 / CPU / Linux | 339.305393 samples/min Submissions: 18 | 236.651564 samples/min Submissions: 12 | -30.3 % |
| Blender 5.2.0 / CPU / Windows | 310.396961 samples/min Submissions: 51 | 211.424763 samples/min Submissions: 22 | -31.9 % |
| Blender 5.1.1 / CPU / Linux | 371.865671 samples/min Submissions: 32 | 238.790662 samples/min Submissions: 18 | -35.8 % |
| Blender 5.1.1 / CPU / Windows | 320.473967 samples/min Submissions: 79 | 219.538655 samples/min Submissions: 40 | -31.5 % |
| Blender 5.1.0 / CPU / Linux | 385.224955 samples/min Submissions: 15 | 245.934632 samples/min Submissions: 5 | -36.2 % |
| Blender 5.1.0 / CPU / Windows | 311.067135 samples/min Submissions: 35 | 225.384328 samples/min Submissions: 20 | -27.5 % |
| Blender 4.5.0 / CPU / Linux | 334.163366 samples/min Submissions: 36 | 252.417386 samples/min Submissions: 86 | -24.5 % |
| Blender 4.5.0 / CPU / Windows | 304.57062 samples/min Submissions: 403 | 203.851614 samples/min Submissions: 237 | -33.1 % |
| Blender 4.4.0 / CPU / Linux | 335.639217 samples/min Submissions: 69 | 241.730232 samples/min Submissions: 19 | -28.0 % |
| Blender 4.4.0 / CPU / Windows | 282.660046 samples/min Submissions: 115 | 195.366501 samples/min Submissions: 99 | -30.9 % |
| Blender 4.3.0 / CPU / Linux | 338.906013 samples/min Submissions: 19 | 236.257691 samples/min Submissions: 30 | -30.3 % |
| Blender 4.3.0 / CPU / Windows | 279.963397 samples/min Submissions: 158 | 197.377448 samples/min Submissions: 207 | -29.5 % |
| Test and settings | AMD Ryzen 7 9700X | AMD Ryzen 7 5800X | Result difference¹ |
|---|---|---|---|
| Blender 4.2.0 / CPU / Linux | 403.741965 samples/min Submissions: 27 | 243.986623 samples/min Submissions: 33 | -39.6 % |
| Blender 4.2.0 / CPU / Windows | 286.426028 samples/min Submissions: 109 | 194.110194 samples/min Submissions: 225 | -32.2 % |
| Blender 4.1.0 / CPU / Windows | 306.671773 samples/min Submissions: 5 | 203.822985 samples/min Submissions: 98 | -33.5 % |
¹ Difference of the second result relative to the first in that row. No percentage is calculated for different upscaling algorithms. This compares published results, not a universal performance index.
These results have no shared test of both models with the same version and settings. They are shown separately without a percentage difference.
Published measurements are separate from the archived index. Incomplete conditions and unknown run counts do not support ranking positions or calculated performance differences.
| Model | Test | Result | Reported conditions |
|---|---|---|---|
| AMD Ryzen 7 9700X | Cinebench 2024 / multi-core | 1203 points | Graphics card: GeForce RTX 4090 System RAM: 32 GB |
| AMD Ryzen 7 9700X | Cinebench 2024 / single-core | 136 points | Graphics card: GeForce RTX 4090 System RAM: 32 GB |
| AMD Ryzen 7 9700X | Cinebench R15 / multi-core | 3178 points | Graphics card: GeForce RTX 4090 System RAM: 32 GB |
| AMD Ryzen 7 9700X | Cinebench R15 / single-core | 346 points | Graphics card: GeForce RTX 4090 System RAM: 32 GB |
| AMD Ryzen 7 9700X | Cinebench R20 / multi-core | 7956 points | Graphics card: GeForce RTX 4090 System RAM: 32 GB |
| AMD Ryzen 7 9700X | Cinebench R20 / single-core | 870 points | Graphics card: GeForce RTX 4090 System RAM: 32 GB |
| AMD Ryzen 7 9700X | Cinebench R23 / multi-core | 20485 points | Graphics card: GeForce RTX 4090 System RAM: 32 GB |
| AMD Ryzen 7 9700X | Cinebench R23 / single-core | 2211 points | Graphics card: GeForce RTX 4090 System RAM: 32 GB |
| AMD Ryzen 7 9700X | RandomX / XMRig 6.22.2 / 10M / 16 threads | 14490.17 H/s | System RAM: 64 GB OS: Windows NT 10.0 Motherboard: ASRock / B850I Lightning WiFi Duration: 690.123 s |
Results were obtained on the reported systems. Test versions and settings remain separate; incomplete conditions do not support calculated model performance differences.
| Model | Result | Reported conditions |
|---|---|---|
| AMD Ryzen 7 5800X | 8091.138585 H/s | RandomX / XMRig 6.26.0 / 1M / 16 threads / windows System RAM: 24 GB OS: Windows NT 10.0 Motherboard: Micro-Star International Co., Ltd. / MPG B550 GAMING PLUS (MS-7C56) Duration: 123.592 s User-submitted run; tuning and power settings are incomplete. |
| Model | Result | Reported conditions |
|---|---|---|
| AMD Ryzen 7 9700X | 12730.096494 H/s | RandomX / XMRig 6.26.0 / 1M / 16 threads / windows System RAM: 32 GB OS: Windows NT 10.0 Motherboard: ASUSTeK COMPUTER INC. / ROG STRIX X870E-E GAMING WIFI Duration: 78.554 s User-submitted run; tuning and power settings are incomplete. |


 English
 Russian
 German
 Portuguese
 Italian
 French
 Spanish
 Polish
 Chinese
 Korean