
Cuál es la mejor opción Intel Core i9-13900K o AMD Ryzen 5 5500U? ¿Qué procesador es más rápido?
Hemos preparado una comparación para ayudarte a elegir el mejor procesador. Compara sus especificaciones y puntos de referencia.
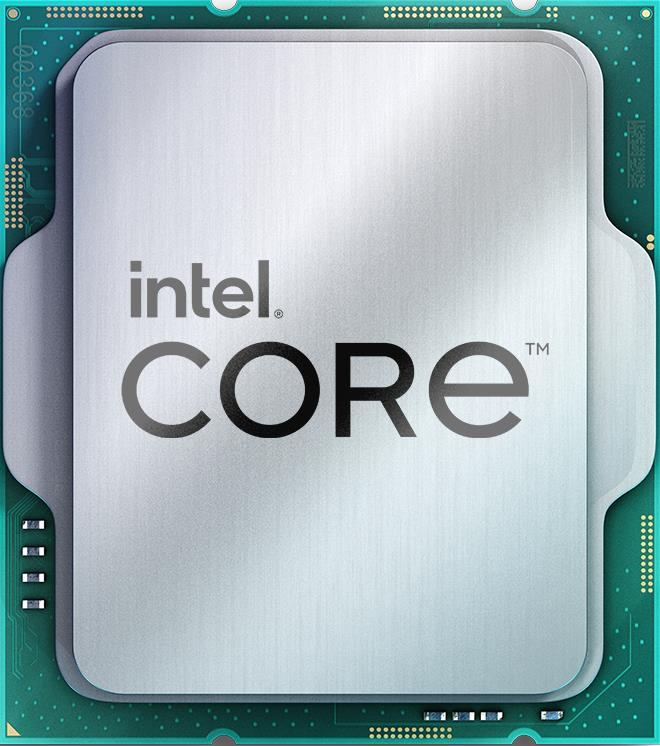
Intel Core i9-13900K has a base frequency of 3.80 GHz. 24 CPU Cores / Threads. Stated TDP / base power 125 W. Publicado en Q4/2022.
AMD Ryzen 5 5500U has a base frequency of 2.1 GHz. 6 / 12 CPU Cores / Threads. Stated TDP / base power 15 W. Publicado en 2021-01-12.
Razones a tener en cuenta Lugar en la clasificación general
(basado en varios puntos de referencia)
 lugar
Mayor velocidad de reloj
En 81% mejor velocidad de reloj
 2.1 GHz
Más número de núcleos
18 more cores
6
Posiciones comunes Intel Core i9-13900K CPU en pruebas de referencia populares, para comparar con otros modelos.
Razones a tener en cuenta Lugar en la clasificación general
(basado en varios puntos de referencia)
lugar
Lower stated TDP / base power
Power limits alone do not measure performance per watt.
125 W
Posiciones comunes AMD Ryzen 5 5500U CPU en pruebas de referencia populares, para comparar con otros modelos.
Intel Core i9-13900K
Información sobre los procesadores que se comparan, serie, generación y segmento de mercado.
 AMD Ryzen 5000U
Ryzen
4
-
Mobile
-
Laptops / Desktops
Ryzen 5000 Series
Core counts, threads, cache and clock modes describe the CPU configuration. Performance depends on the workload and comparable measured results.
-
-
2.1 GHz
normal
6
12
Sí
No
4 GHz
-
4 GHz
3.4 GHz
La gráfica interna no afecta al rendimiento de la CPU, realiza el trabajo de la tarjeta gráfica en su ausencia o en dispositivos móviles.
12
7
9
1800 MHz
AMD Radeon Graphics
sin turbo
3
2 GB
Q1/2020
448
7 nm
7
Códecs incorporados para codificar y descodificar contenidos. Acelera significativamente las operaciones necesarias.
No
Decode / Encode
Decode / Encode
Decode / Encode
Decode / Encode
Decode
Decode / Encode
Decode / Encode
Tipos, cantidad de canales de RAM soportados por AMD Ryzen 5 5500U y Intel Core i9-13900K. Dependiendo de las placas base, pueden admitirse frecuencias de memoria más altas o más bajas.
Sí
32 GB
-
2
DDR4 - Up to 3200 / LPDDR4 - Up to 4266
PCIe 3.0
12
3.0
Sí
Compara los requisitos del TDP Intel Core i9-13900K y AMD Ryzen 5 5500U Power specifications describe different manufacturer limits. TDP, base power and maximum turbo power are separate values; they do not establish measured system consumption.
105 °C
15 W
-
10 W
25 W
10-25 W
15 W
Arquitectura, interfaces, instrucciones adicionales soportadas por Intel Core i9-13900K y AMD Ryzen 5 5500U, tecnologías de máquinas virtuales y tecnología de procesos.
Lucienne (Zen 2)
x86-64 (64 bit)
SSE4a, SSE4.1, SSE4.2, AVX2, FMA3
3 MB
8 MB
2021-01-12
FP6
TSMC 7nm FinFET
AMD-V, SVM
Lucienne
100-000000375
Windows 11 - 64-Bit Edition / Windows 10 - 64-Bit Edition / RHEL x86 64-Bit / Ubuntu x86 64-Bit
Shared tests with results for both models: 2
Each row uses one Blender version, operating system and compute backend.
| Test and settings | Intel Core i9-13900K | AMD Ryzen 5 5500U | Result difference¹ |
|---|---|---|---|
| Blender 5.2.0 / CPU / Windows | 509.194389 samples/min Submissions: 18 | 75.681711 samples/min Submissions: 9 | -85.1 % |
| Blender 5.1.1 / CPU / Windows | 521.395074 samples/min Submissions: 10 | 66.442048 samples/min Submissions: 5 | -87.3 % |
¹ Difference of the second result relative to the first in that row. No percentage is calculated for different upscaling algorithms. This compares published results, not a universal performance index.
These results have no shared test of both models with the same version and settings. They are shown separately without a percentage difference.
Published measurements are separate from the archived index. Incomplete conditions and unknown run counts do not support ranking positions or calculated performance differences.
| Model | Test | Result | Reported conditions |
|---|---|---|---|
| Intel Core i9-13900K | Cinebench R15 / multi-core | 6191 points | Graphics card: GeForce RTX 3090 |
| Intel Core i9-13900K | Cinebench R15 / single-core | 327 points | Graphics card: GeForce RTX 3090 |
| Intel Core i9-13900K | Cinebench R20 / multi-core | 15181 points | Graphics card: GeForce RTX 3090 |
| Intel Core i9-13900K | Cinebench R20 / single-core | 828 points | Graphics card: GeForce RTX 3090 |
| Intel Core i9-13900K | Cinebench R23 / multi-core | 40103 points | Graphics card: GeForce RTX 3090 |
| Intel Core i9-13900K | Cinebench R23 / single-core | 2267 points | Graphics card: GeForce RTX 3090 |
Results were obtained on the reported systems. Test versions and settings remain separate; incomplete conditions do not support calculated model performance differences.
| Model | Result | Reported conditions |
|---|---|---|
| Intel Core i9-13900K | 9028.644277 H/s | RandomX / XMRig 6.22.2 / 10M / 32 threads / windows System RAM: 32 GB OS: Windows NT 10.0 Motherboard: ASRock / B760M-H2/M.2 Duration: 1107.586 s User-submitted run; tuning and power settings are incomplete. |
| Model | Result | Reported conditions |
|---|---|---|
| AMD Ryzen 5 5500U | 2648.56461 H/s | RandomX / XMRig 6.22.0 / 1M / 5 threads / windows System RAM: 24 GB OS: Windows NT 10.0 Motherboard: LENOVO / LNVNB161216 Duration: 377.563 s User-submitted run; tuning and power settings are incomplete. |
Basándose en los resultados de varias pruebas comparativas, puede estimar con mayor precisión la diferencia de rendimiento entre Intel Core i9-13900K y AMD Ryzen 5 5500U.
Compare los valores de las pruebas sintéticas y elija el mejor procesador.
These are saved results from the earlier catalog. Measurement dates and test configurations were not recorded. Models with no comparable results are omitted.
Recent models: test results with identified primary sources — Cinebench R23 · Cinebench R20 · Cinebench R15 · Cinebench 2026 · RandomX benchmark
Higher values are better in this metric.
Higher values are better in this metric.
Higher values are better in this metric.
Higher values are better in this metric.
Higher values are better in this metric.
Higher values are better in this metric.
Higher values are better in this metric.


 English
 Russian
 German
 Portuguese
 Italian
 French
 Japan
 Polish
 Chinese
 Korean