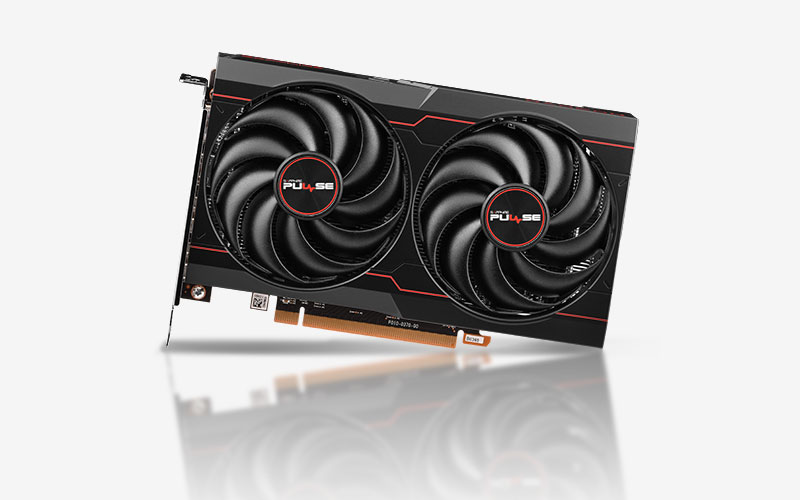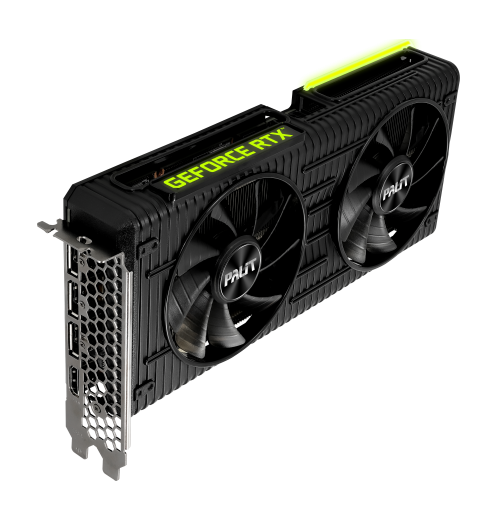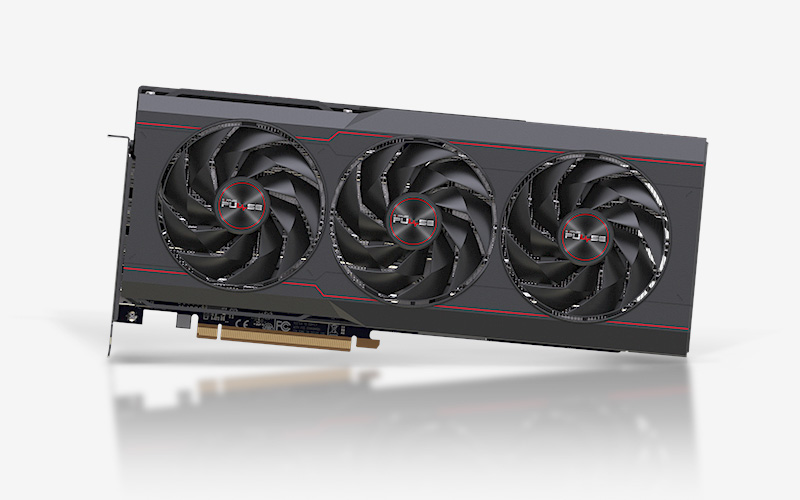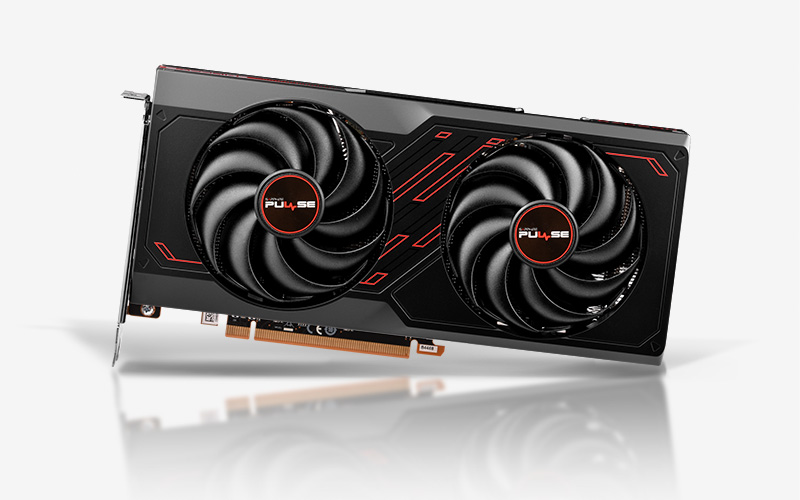

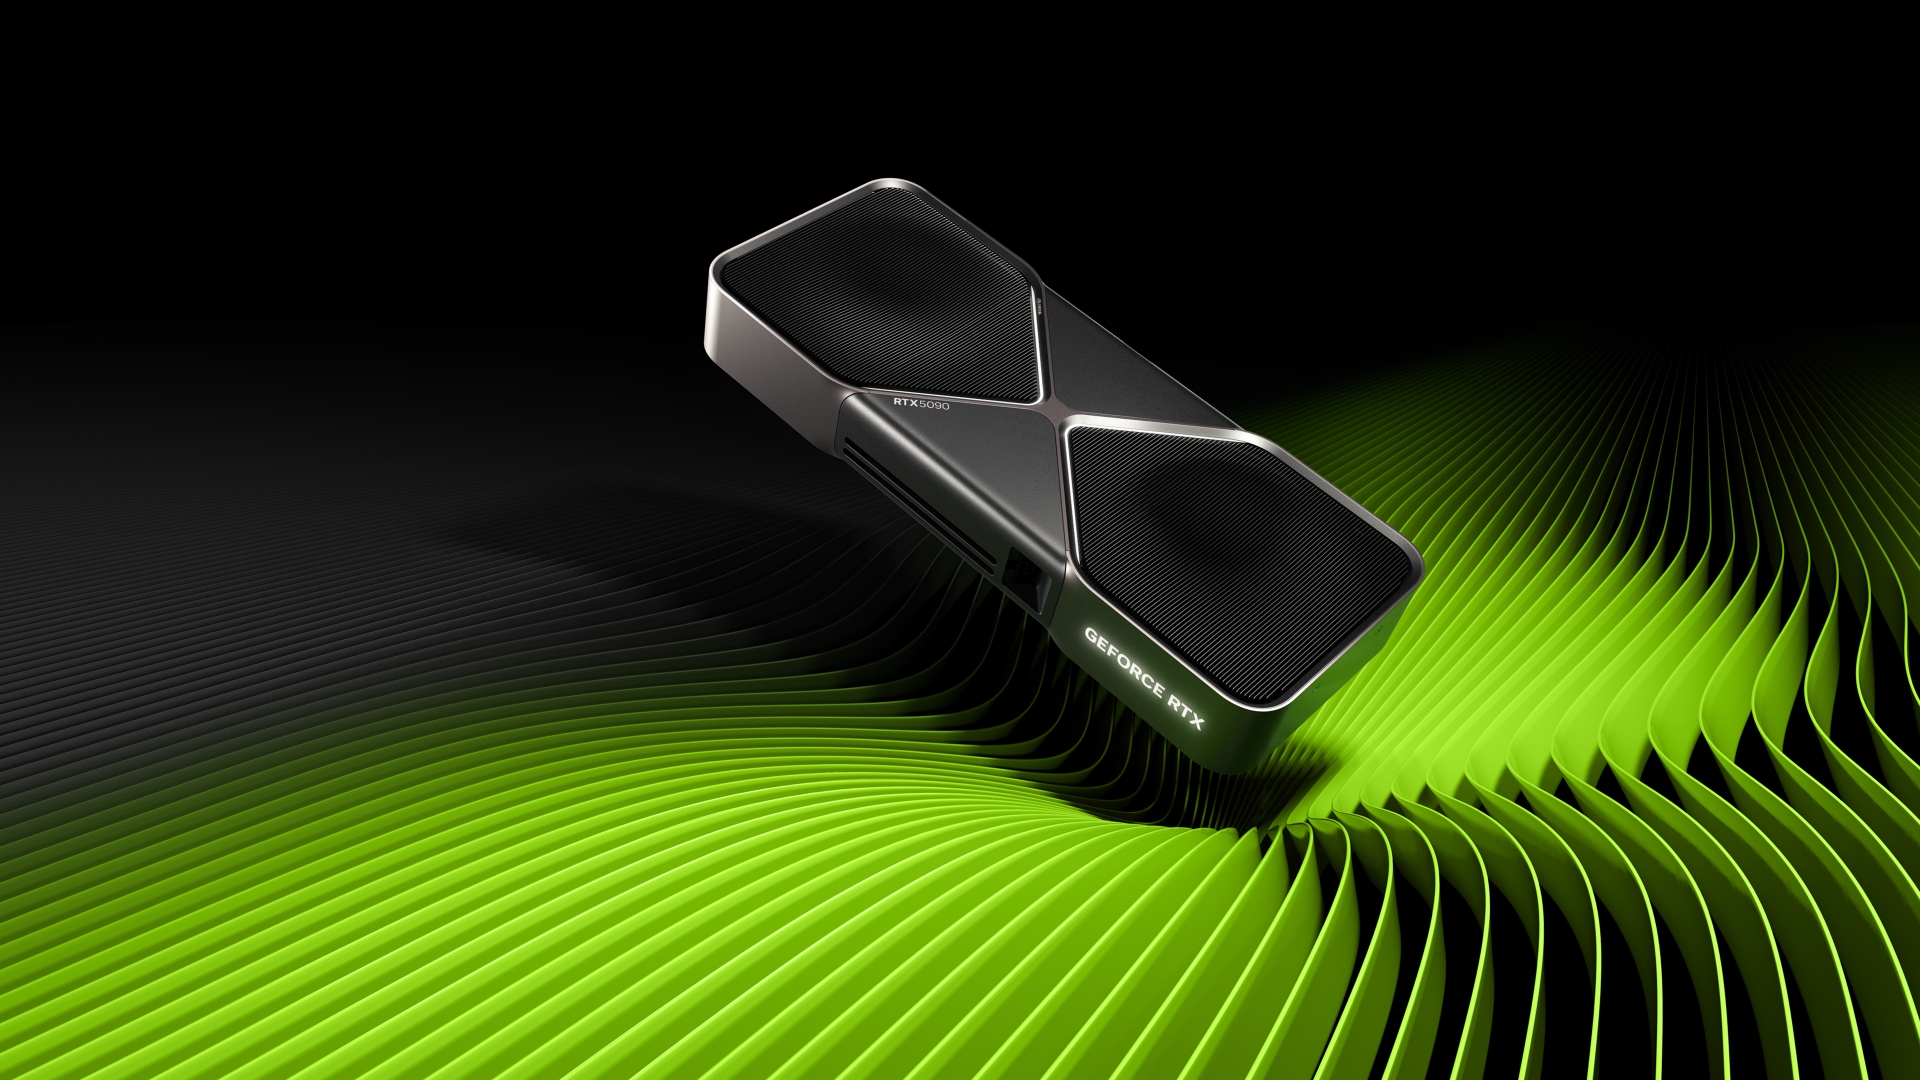
최선의 선택은 무엇인가요? SAPPHIRE PULSE Radeon RX 7600 8GB 또는 NVIDIA GeForce RTX 5090? 어떤 그래픽 카드가 더 빠르나요?
Compare the available specifications of these models.
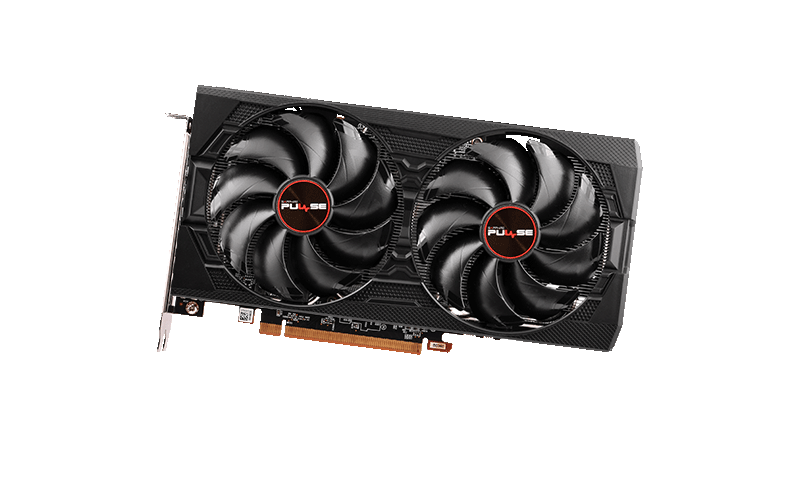
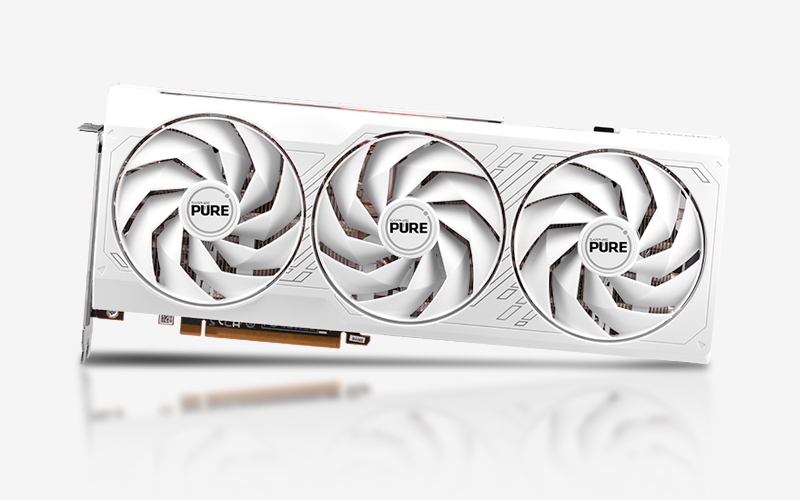
SAPPHIRE PULSE Radeon RX 7600 8GB 메모리 크기 8 GB. 메모리 유형 GDDR6.
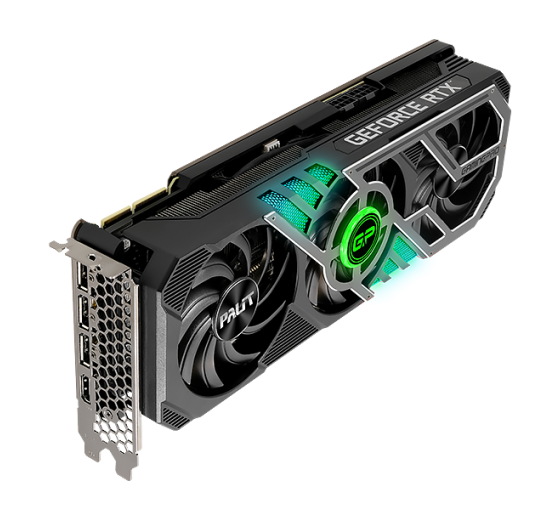
NVIDIA GeForce RTX 5090 has a base frequency of 2.01 GHz. 메모리 크기 32 GB. 메모리 유형 GDDR7. 에 출시 2025-01-30.
고려해야 하는 이유
고려해야 하는 이유 더 많은 메모리
300메모리 % 증가
 8 GB
SAPPHIRE PULSE Radeon RX 7600 8GB
8 GB
SAPPHIRE PULSE Radeon RX 7600 8GB
그래픽 카드의 기본 기술 데이터 비교 SAPPHIRE PULSE Radeon RX 7600 8GB 그리고 NVIDIA GeForce RTX 5090, 칩, 정보 처리 장치.
 NVIDIA GeForce RTX 5090
-
-
-
-
-
Blackwell
21760
21760
NVIDIA GeForce RTX 5090
-
-
-
-
-
Blackwell
21760
21760
Video memory capacity, type, bus width and bandwidth describe different properties. These values alone do not determine graphics performance.
512 bit
-
32 GB
GDDR7
1792 GB/s
Published GPU clock frequencies describe different operating modes. Clock speed alone does not determine graphics performance.
2410 MHz
-
2010 MHz
Graphics card power limits and recommended system power supply describe different specifications.
1000 W (System power requirement)
-
90 °C
575 W
연결 및 연결.
-
-
5.0
비디오 및 이미지 압축 표준 기본 지원.
Decode / Encode
비교 장치의 크기, 무게 및 슬롯 차이
-
Shared tests with results for both models: 8
Each row uses one game, resolution, test suite and graphics mode.
| Test and settings | SAPPHIRE PULSE Radeon RX 7600 8GB | NVIDIA GeForce RTX 5090 | Result difference¹ |
|---|---|---|---|
| ComputerBase GPU suite 2026 / Alan Wake 2 / 2560x1440 / Maximale Grafikdetails / DLSS/FSR Quality / RT off | 36.2 FPS Base GPU test: AMD Radeon RX 7600 Rendering: FSR 2 QualityDriver: 26.3.1 | 138 FPS Rendering: DLSS 4.0 QualityDriver: 596.21 | Complete test conditions unreported |
| ComputerBase GPU suite 2026 / Alan Wake 2 / 2560x1440 / Maximale Grafikdetails / DLSS/FSR Quality / RT on | 16.9 FPS Base GPU test: AMD Radeon RX 7600 Rendering: FSR 2 QualityDriver: 26.3.1 | 122.1 FPS Rendering: DLSS 4.0 QualityDriver: 596.21 | Complete test conditions unreported |
| ComputerBase GPU suite 2026 / Anno 117 / 2560x1440 / Ultra-Hoch-Preset / DLSS/FSR Quality / RT off | 34.2 FPS Base GPU test: AMD Radeon RX 7600 Rendering: FSR 3.1 QualityDriver: 26.3.1 | 150.7 FPS Rendering: DLSS 4.0 QualityDriver: 596.21 | Complete test conditions unreported |
| ComputerBase GPU suite 2026 / Anno 117 / 2560x1440 / Ultra-Hoch-Preset / DLSS/FSR Quality / RT on | 24.4 FPS Base GPU test: AMD Radeon RX 7600 Rendering: FSR 3.1 QualityDriver: 26.3.1 | 126.5 FPS Rendering: DLSS 4.0 QualityDriver: 596.21 | Complete test conditions unreported |
| ComputerBase GPU suite 2026 / ARC Raiders / 2560x1440 / Episch-Preset / DLSS/FSR Native / RT off | 44.7 FPS Base GPU test: AMD Radeon RX 7600 Rendering: FSR 3.1 NativeDriver: 26.3.1 | 194.8 FPS Rendering: DLSS 4.0 NativeDriver: 596.21 | Complete test conditions unreported |
| ComputerBase GPU suite 2026 / ARC Raiders / 2560x1440 / Episch-Preset / DLSS/FSR Native / RT on | 36.1 FPS Base GPU test: AMD Radeon RX 7600 Rendering: FSR 3.1 NativeDriver: 26.3.1 | 169.9 FPS Rendering: DLSS 4.0 NativeDriver: 596.21 | Complete test conditions unreported |
| ComputerBase GPU suite 2026 / Assassin's Creed Shadows / 2560x1440 / Extrem-Hoch-Preset / DLSS/FSR Quality / RT off | 24.9 FPS Base GPU test: AMD Radeon RX 7600 Rendering: FSR 3.1 QualityDriver: 26.3.1 | 101.9 FPS Rendering: DLSS 4.0 QualityDriver: 596.21 | Complete test conditions unreported |
| ComputerBase GPU suite 2026 / Assassin's Creed Shadows / 2560x1440 / Extrem-Hoch-Preset / DLSS/FSR Quality / RT on | 15.4 FPS Base GPU test: AMD Radeon RX 7600 Rendering: FSR 3.1 QualityDriver: 26.3.1 | 78 FPS Rendering: DLSS 4.0 QualityDriver: 596.21 | Complete test conditions unreported |
¹ Difference of the second result relative to the first in that row. No percentage is calculated for different upscaling algorithms. This compares published results, not a universal performance index.
A base GPU test is a reference for cards using that GPU and the same memory capacity. Board overclocking, cooling and power limits can change the result.
These results have no shared test of both models with the same version and settings. They are shown separately without a percentage difference.
Published measurements are separate from the archived index. Incomplete conditions and unknown run counts do not support ranking positions or calculated performance differences.
| Model | Test | Result | Reported conditions |
|---|---|---|---|
| NVIDIA GeForce RTX 5090 | The Witcher 3: Wild Hunt - Remastered / 1440p / Ultra / Native | 173 FPS | Test CPU: AMD Ryzen 7 9800X3D System RAM: 32 GB DDR5-6000 Specific partner board and exact game build unreported. |
| NVIDIA GeForce RTX 5090 | The Witcher 3: Wild Hunt - Remastered / 4K / Ultra / Native | 107 FPS | Test CPU: AMD Ryzen 7 9800X3D System RAM: 32 GB DDR5-6000 Specific partner board and exact game build unreported. |
Results were obtained on the reported systems. Test versions and settings remain separate; incomplete conditions do not support calculated model performance differences.
| Model | Result | Reported conditions |
|---|---|---|
| NVIDIA GeForce RTX 5090 | 162871 points | System: 9800X3D, RTX 5090, 64 GB Graphics: 9800X3D, RTX 5090, 64 GB Source minimum runtime: 0 minutes. Exact test build and complete conditions are unreported; no ranking position. |


 English
 Russian
 German
 Portuguese
 Italian
 French
 Japan
Japan Spanish
 Polish
 Chinese