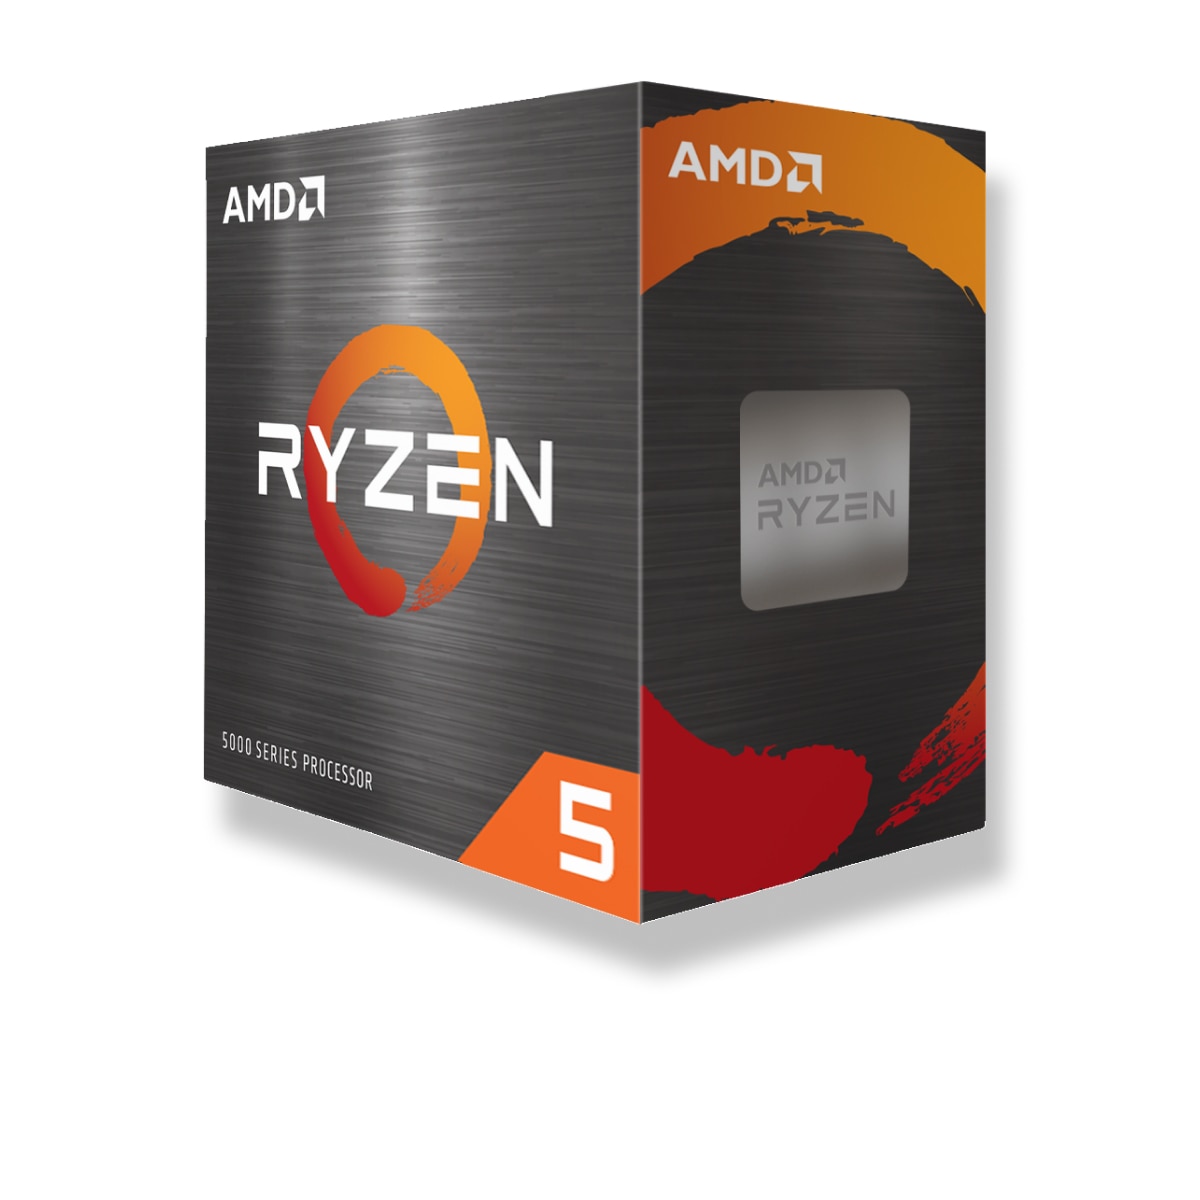
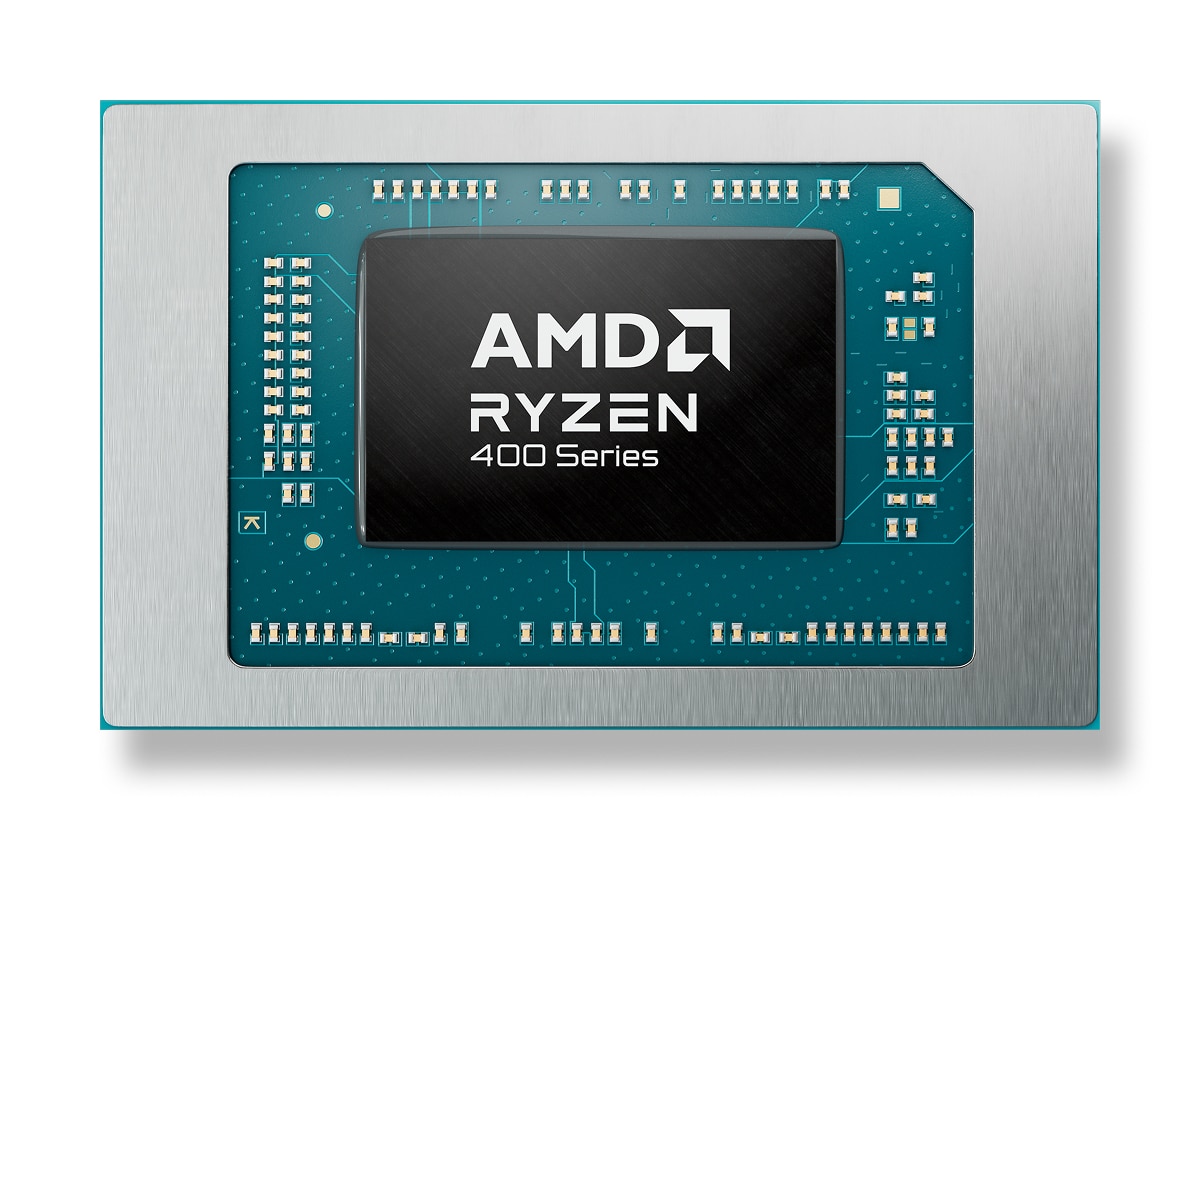
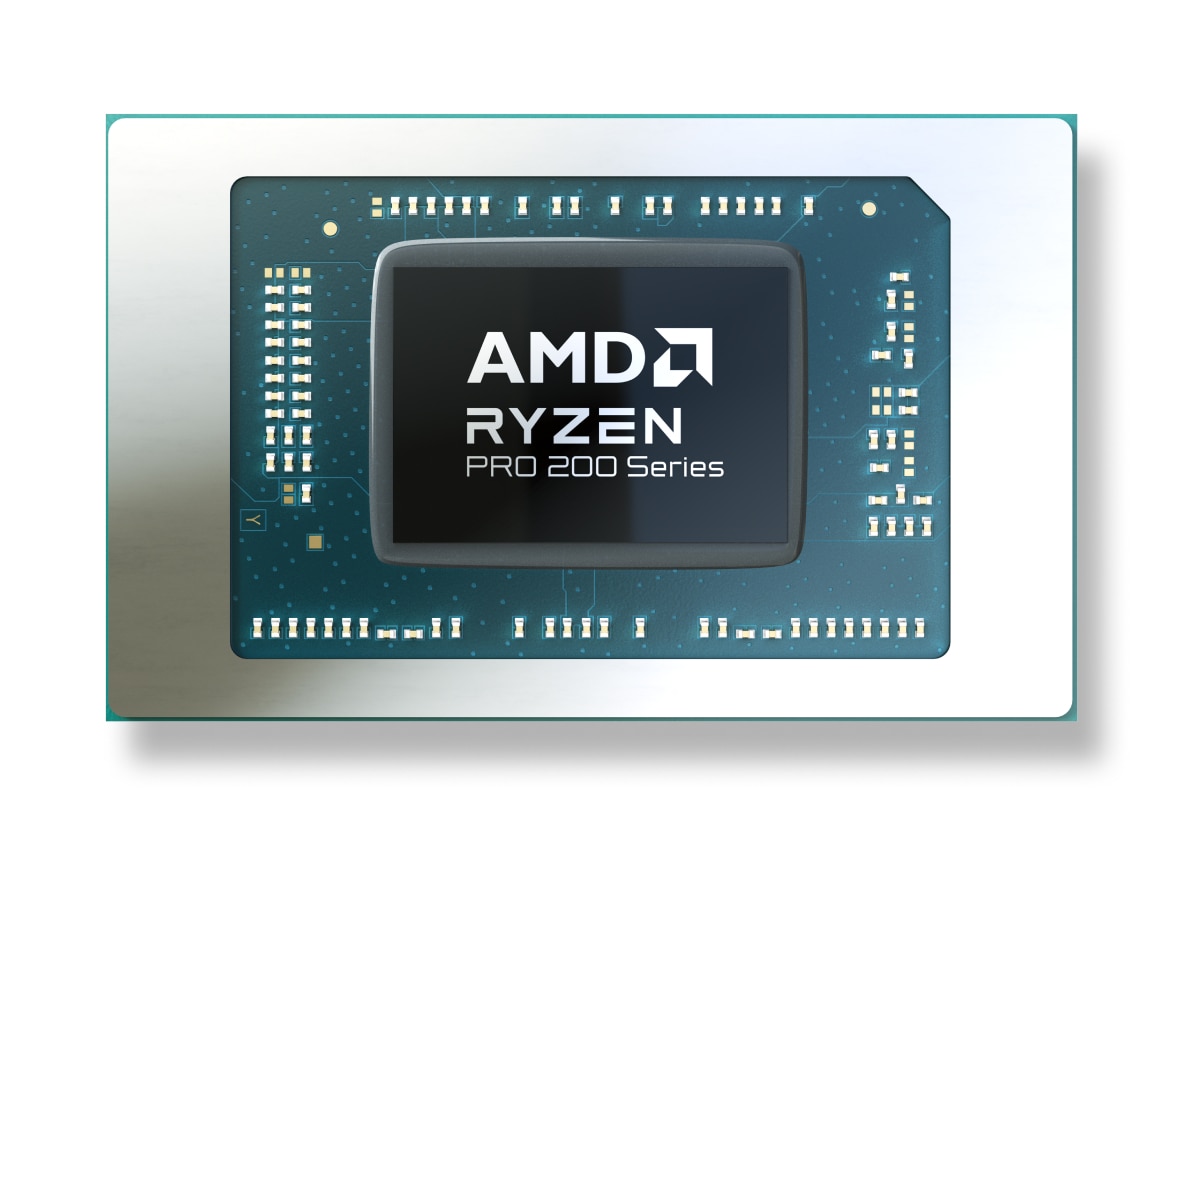
제품군 예시 이미지.
공통 위치 AMD Ryzen 9 9900X 다른 모델과의 비교를 위한 인기 벤치마크의 CPU.
No dataPublished results: 16
Each row uses one Blender version, operating system and compute backend.
| Test and settings | AMD Ryzen 9 9900X |
|---|---|
| Blender 4.0.0 / CPU / Windows | 474.884064 samples/min Submissions: 10 |
| Blender 4.2.0 / CPU / Linux | 560.145179 samples/min Submissions: 22 |
| Blender 4.2.0 / CPU / Windows | 449.21394 samples/min Submissions: 118 |
| Blender 4.3.0 / CPU / Linux | 544.869662 samples/min Submissions: 50 |
| Blender 4.3.0 / CPU / Windows | 445.232418 samples/min Submissions: 186 |
| Blender 4.4.0 / CPU / Linux | 531.87189 samples/min Submissions: 44 |
| Blender 4.4.0 / CPU / Windows | 472.919829 samples/min Submissions: 326 |
| Blender 4.5.0 / CPU / Linux | 537.68167 samples/min Submissions: 83 |
| Blender 4.5.0 / CPU / Windows | 477.295327 samples/min Submissions: 300 |
| Blender 5.0.0 / CPU / Windows | 452.299043 samples/min Submissions: 10 |
| Blender 5.1.0 / CPU / Linux | 556.900449 samples/min Submissions: 16 |
| Blender 5.1.0 / CPU / Windows | 530.322214 samples/min Submissions: 26 |
| Test and settings | AMD Ryzen 9 9900X |
|---|---|
| Blender 5.1.1 / CPU / Linux | 526.696556 samples/min Submissions: 26 |
| Blender 5.1.1 / CPU / Windows | 515.39885 samples/min Submissions: 63 |
| Blender 5.2.0 / CPU / Linux | 542.151365 samples/min Submissions: 18 |
| Blender 5.2.0 / CPU / Windows | 495.186443 samples/min Submissions: 34 |
Published measurements are separate from the archived index. Incomplete conditions and unknown run counts do not support ranking positions or calculated performance differences.
| Test | Result | Reported conditions |
|---|---|---|
| Cinebench 2024 / multi-core | 1818 points | Graphics card: GeForce RTX 4090 |
| Cinebench 2024 / single-core | 138 points | Graphics card: GeForce RTX 4090 |
| Cinebench R15 / multi-core | 5008 points | Graphics card: GeForce RTX 4090 |
| Cinebench R15 / single-core | 353 points | Graphics card: GeForce RTX 4090 |
| Cinebench R20 / multi-core | 12551 points | Graphics card: GeForce RTX 4090 |
| Cinebench R20 / single-core | 885 points | Graphics card: GeForce RTX 4090 |
| Cinebench R23 / multi-core | 32172 points | Graphics card: GeForce RTX 4090 |
| Cinebench R23 / single-core | 2253 points | Graphics card: GeForce RTX 4090 |
Results were obtained on the reported systems. Test versions and settings remain separate; incomplete conditions do not support calculated model performance differences.
| Result | Reported conditions |
|---|---|
| 17043.32413 H/s | RandomX / XMRig 6.26.0 / 1M / 24 threads / windows System RAM: 32 GB OS: Windows NT 10.0 Motherboard: Micro-Star International Co., Ltd. / B650M GAMING PLUS WIFI (MS-7E24) Duration: 58.674 s User-submitted run; tuning and power settings are incomplete. |
Comparable benchmark results are required to suggest performance alternatives.
*
PL1 is the sustained processor power limit; PL2 is the short-term turbo power limit. They are not measured performance or efficiency.
이 값은 최적의 냉각 시스템과 전원 공급 장치를 선택하는 데 사용됩니다.


 English
 Russian
 German
 Portuguese
 Italian
 French
 Japan
 Spanish
 Polish
 Chinese