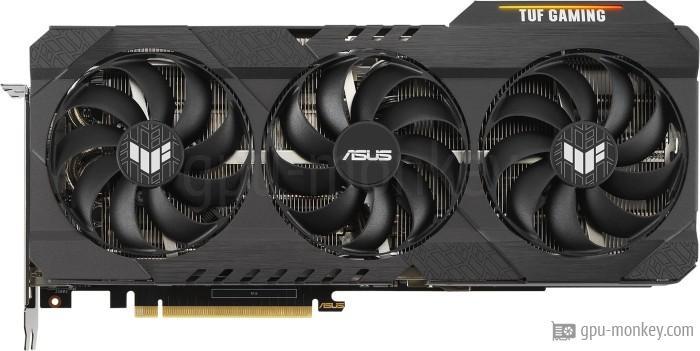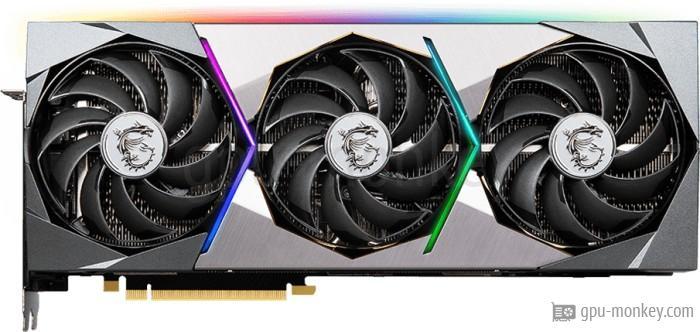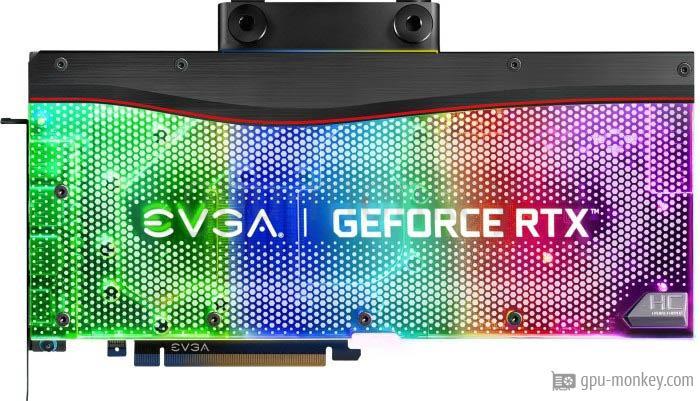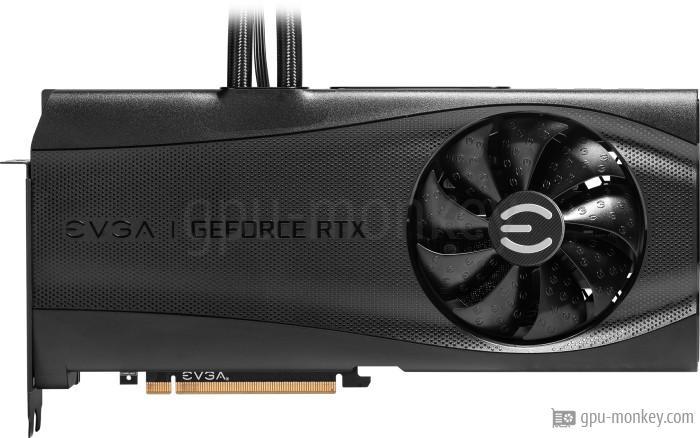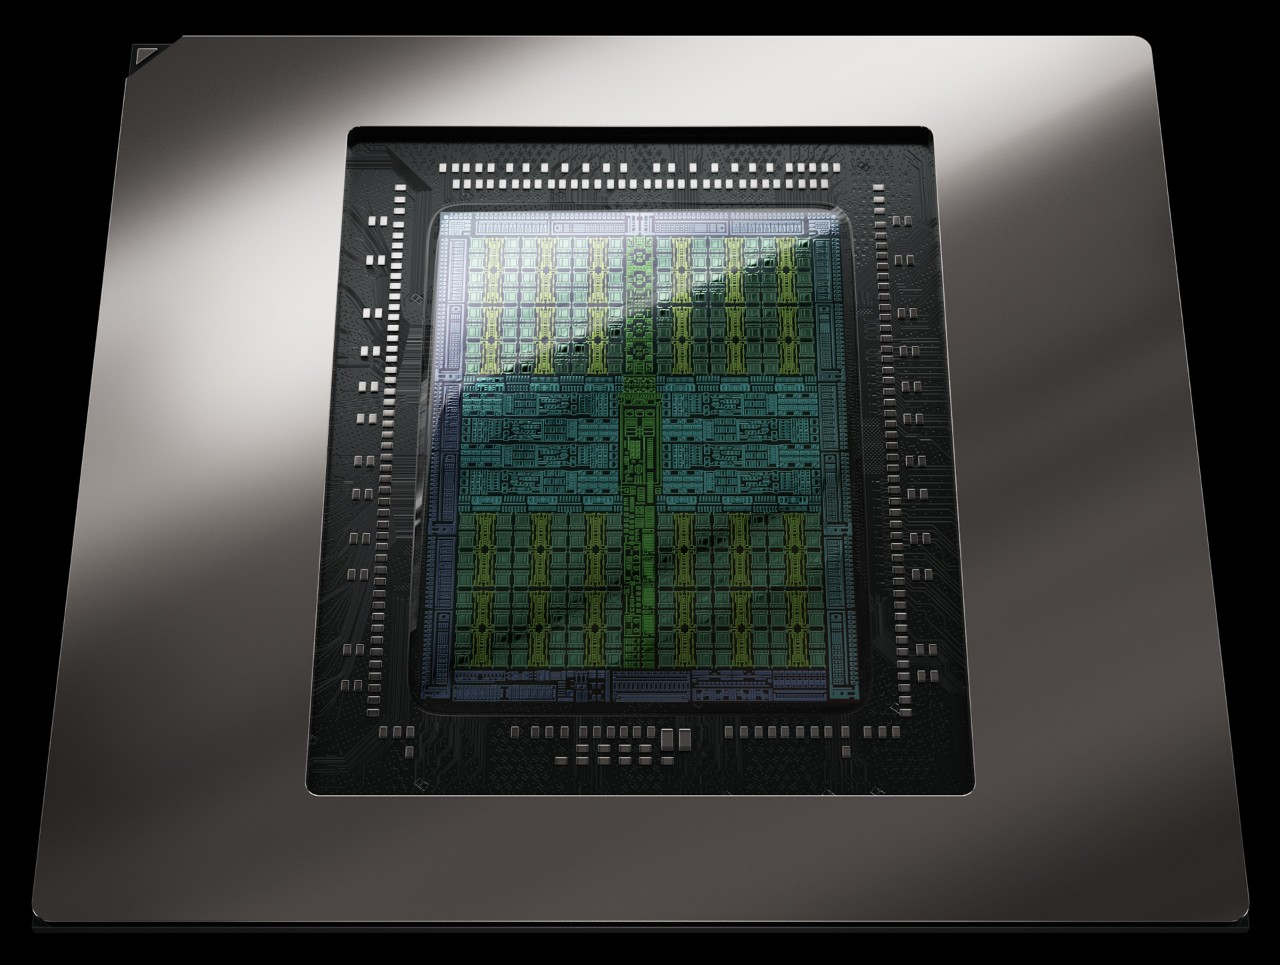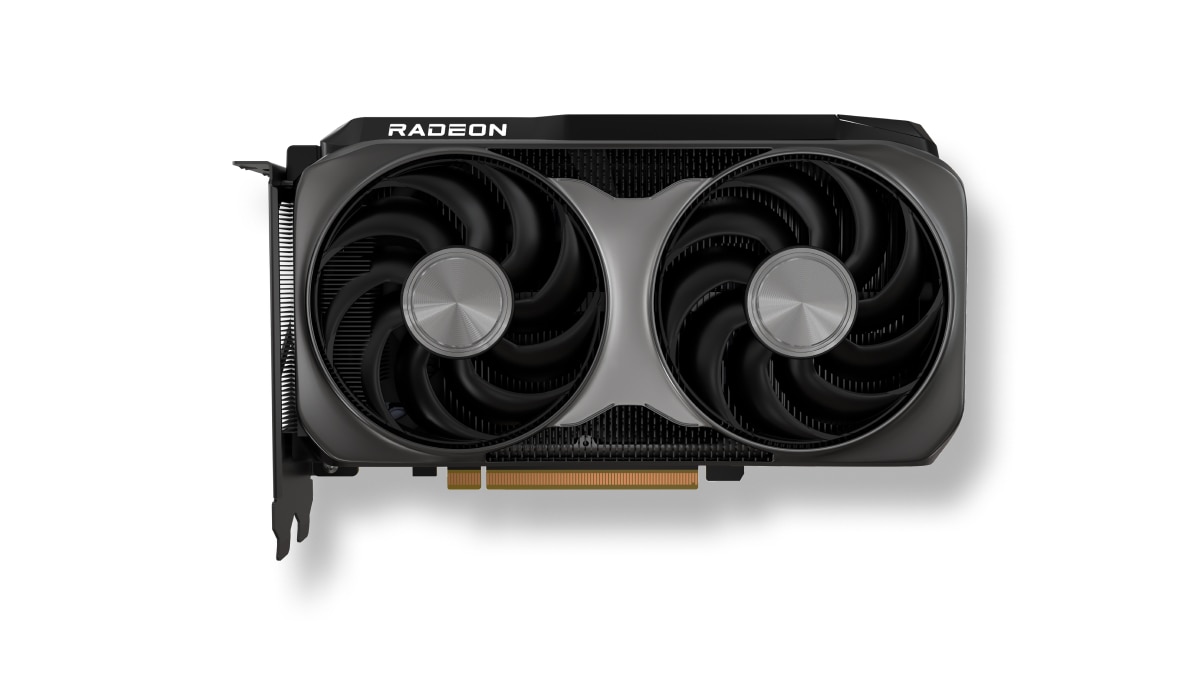
Positions communes KFA2 GeForce RTX 3080 Ti HOF Premium GPU dans des benchmarks populaires, pour comparaison avec d'autres modèles.
Board specifications and benchmark results are specific to each version.
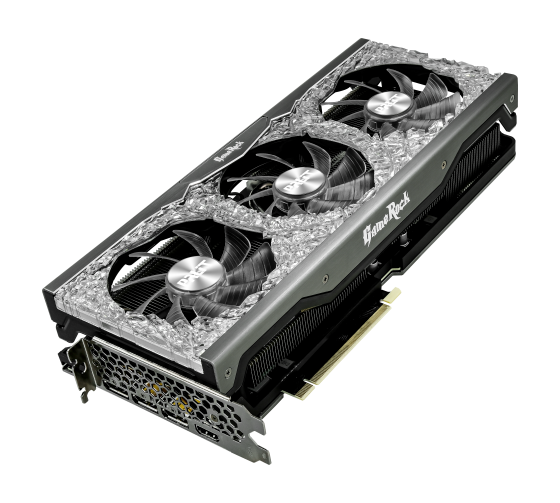 Palit GeForce RTX 3080 Ti GameRock 12GB
Palit · 12 GB
Palit GeForce RTX 3080 Ti GameRock OC 12GBPalit · 12 GB
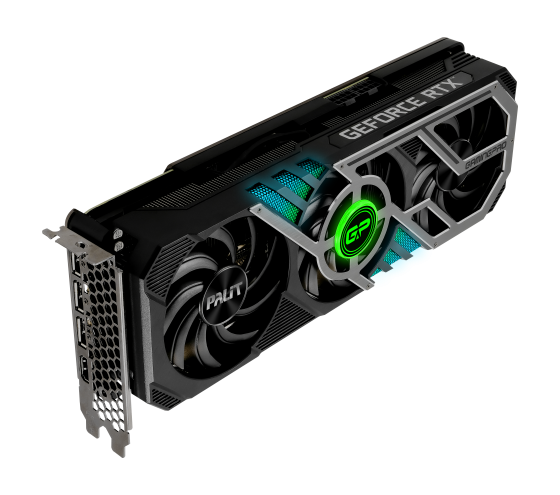 Palit GeForce RTX 3080 Ti GamingPro 12GB
Palit · 12 GB
Published results: 184
Each row is a separate graphics subtest. Scores are not game FPS.
| Test and settings | KFA2 GeForce RTX 3080 Ti HOF Premium |
|---|---|
| 3DMark – Time Spy — Graphics Score / DirectX 12 | 19698 points Base GPU test: Nvidia GeForce RTX 3080 Ti VRAM: 12 GBTest CPU: AMD Ryzen 9 7950X3DOS: Windows 11Graphics API: DirectX 12HVCI: enabledApplication version unreported |
| 3DMark – Steel Nomad — Steel Nomad Score / DirectX 12 | 5033 points Base GPU test: Nvidia GeForce RTX 3080 Ti VRAM: 12 GBOS: Windows 11Graphics API: DirectX 12HVCI: enabledApplication version unreported |
Each row uses one game, resolution, test suite and graphics mode.
| Test and settings | KFA2 GeForce RTX 3080 Ti HOF Premium |
|---|---|
| Gaming suite 2022 / Assassin's Creed Valhalla / 1920x1080 / Extrem-hoch-Preset / Rendering unreported | 114 FPS Base GPU test: Nvidia GeForce RTX 3080 Ti VRAM: 12 GBTest CPU: Intel Core i9-12900KSystem RAM: 32 GB DDR5-5400OS: Windows 11 21H2Graphics API: DirectX 12Driver: 497.09 |
| Gaming suite 2022 / Battlefield 2042 / 1920x1080 / Ultra-Preset, HBAO „Voll“ / Rendering unreported | 139 FPS Base GPU test: Nvidia GeForce RTX 3080 Ti VRAM: 12 GBTest CPU: Intel Core i9-12900KSystem RAM: 32 GB DDR5-5400OS: Windows 11 21H2Graphics API: DirectX 12Driver: 497.09 |
| Gaming suite 2022 / Battlefield 2042 / 1920x1080 / Ultra-Preset, HBAO „Voll“; RT AO „Ein“ / Rendering unreported | 117.7 FPS Base GPU test: Nvidia GeForce RTX 3080 Ti VRAM: 12 GBTest CPU: Intel Core i9-12900KSystem RAM: 32 GB DDR5-5400OS: Windows 11 21H2Graphics API: DirectX 12Driver: 497.09 |
| Gaming suite 2022 / Call of Duty Vanguard / 1920x1080 / Ultra-Preset, Tessellation „Maximum“ / Rendering unreported | 160.9 FPS Base GPU test: Nvidia GeForce RTX 3080 Ti VRAM: 12 GBTest CPU: Intel Core i9-12900KSystem RAM: 32 GB DDR5-5400OS: Windows 11 21H2Graphics API: DirectX 12Driver: 497.09 |
| Gaming suite 2022 / Cyberpunk 2077 / 1920x1080 / Ultra-Preset / Rendering unreported | 104.3 FPS Base GPU test: Nvidia GeForce RTX 3080 Ti VRAM: 12 GBTest CPU: Intel Core i9-12900KSystem RAM: 32 GB DDR5-5400OS: Windows 11 21H2Graphics API: DirectX 12Driver: 497.09 |
| Gaming suite 2022 / Deathloop / 1920x1080 / Ultra-Preset / Rendering unreported | 140.9 FPS Base GPU test: Nvidia GeForce RTX 3080 Ti VRAM: 12 GBTest CPU: Intel Core i9-12900KSystem RAM: 32 GB DDR5-5400OS: Windows 11 21H2Graphics API: DirectX 12Driver: 497.09 |
| Gaming suite 2022 / Deathloop / 1920x1080 / Ultra-Preset; RT AO „Qualität“, RT-Sonnenschatten / Rendering unreported | 138.5 FPS Base GPU test: Nvidia GeForce RTX 3080 Ti VRAM: 12 GBTest CPU: Intel Core i9-12900KSystem RAM: 32 GB DDR5-5400OS: Windows 11 21H2Graphics API: DirectX 12Driver: 497.09 |
| Gaming suite 2022 / Diablo II: Resurrected / 1920x1080 / Sehr-Hoch-Preset, Transparenzqualität und VFX-Lichtqualität „Ultra“ / Rendering unreported | 224.1 FPS Base GPU test: Nvidia GeForce RTX 3080 Ti VRAM: 12 GBTest CPU: Intel Core i9-12900KSystem RAM: 32 GB DDR5-5400OS: Windows 11 21H2Graphics API: DirectX 12Driver: 497.09 |
| Gaming suite 2022 / Doom Eternal / 1920x1080 / Ultra-Albtraum-Preset / Rendering unreported | 341 FPS Base GPU test: Nvidia GeForce RTX 3080 Ti VRAM: 12 GBTest CPU: Intel Core i9-12900KSystem RAM: 32 GB DDR5-5400OS: Windows 11 21H2Graphics API: VulkanDriver: 497.09 |
| Gaming suite 2022 / Doom Eternal / 1920x1080 / Ultra-Albtraum-Preset; RT „Ein“ / Rendering unreported | 233.2 FPS Base GPU test: Nvidia GeForce RTX 3080 Ti VRAM: 12 GBTest CPU: Intel Core i9-12900KSystem RAM: 32 GB DDR5-5400OS: Windows 11 21H2Graphics API: VulkanDriver: 497.09 |
| Gaming suite 2022 / F1 2021 / 1920x1080 / Ultrahoch-Preset, AO CACAO / Rendering unreported | 247.3 FPS Base GPU test: Nvidia GeForce RTX 3080 Ti VRAM: 12 GBTest CPU: Intel Core i9-12900KSystem RAM: 32 GB DDR5-5400OS: Windows 11 21H2Graphics API: DirectX 12Driver: 497.09 |
| Gaming suite 2022 / F1 2021 / 1920x1080 / Ultrahoch-Preset, AO CACAO; RT-Schatten und Reflexionen „Mittel“ / Rendering unreported | 173.1 FPS Base GPU test: Nvidia GeForce RTX 3080 Ti VRAM: 12 GBTest CPU: Intel Core i9-12900KSystem RAM: 32 GB DDR5-5400OS: Windows 11 21H2Graphics API: DirectX 12Driver: 497.09 |
| Test and settings | KFA2 GeForce RTX 3080 Ti HOF Premium |
|---|---|
| Gaming suite 2022 / Far Cry 6 / 1920x1080 / Ultra-Preset, HD-Texturen / Rendering unreported | 135.7 FPS Base GPU test: Nvidia GeForce RTX 3080 Ti VRAM: 12 GBTest CPU: Intel Core i9-12900KSystem RAM: 32 GB DDR5-5400OS: Windows 11 21H2Graphics API: DirectX 12Driver: 497.09 |
| Gaming suite 2022 / Far Cry 6 / 1920x1080 / Ultra-Preset, HD-Texturen; RT-Schatten und Reflexionen „Ein“ / Rendering unreported | 109 FPS Base GPU test: Nvidia GeForce RTX 3080 Ti VRAM: 12 GBTest CPU: Intel Core i9-12900KSystem RAM: 32 GB DDR5-5400OS: Windows 11 21H2Graphics API: DirectX 12Driver: 497.09 |
| Gaming suite 2022 / Forza Horizon 5 / 1920x1080 / Extrem-Preset, 4-faches MSAA, FXAA „Ein“, SSAO „Ultra“, Reflexionen/SSR Extrem / Rendering unreported | 117 FPS Base GPU test: Nvidia GeForce RTX 3080 Ti VRAM: 12 GBTest CPU: Intel Core i9-12900KSystem RAM: 32 GB DDR5-5400OS: Windows 11 21H2Graphics API: DirectX 12Driver: 497.09 |
| Gaming suite 2022 / God of War / 1920x1080 / Ultra-Preset + Reflexionen „Ultra+“ / Rendering unreported | 107.2 FPS Base GPU test: Nvidia GeForce RTX 3080 Ti VRAM: 12 GBTest CPU: Intel Core i9-12900KSystem RAM: 32 GB DDR5-5400OS: Windows 11 21H2Graphics API: DirectX 11Driver: 511.23 |
| Gaming suite 2022 / Marvel's Guardians of the Galaxy / 1920x1080 / Ultra-Preset / Rendering unreported | 182.5 FPS Base GPU test: Nvidia GeForce RTX 3080 Ti VRAM: 12 GBTest CPU: Intel Core i9-12900KSystem RAM: 32 GB DDR5-5400OS: Windows 11 21H2Graphics API: DirectX 12Driver: 497.09 |
| Gaming suite 2022 / Marvel's Guardians of the Galaxy / 1920x1080 / Ultra-Preset; RT-Reflexionen „Hoch“, Transparente RT-Reflexionen „Ein“ / Rendering unreported | 150 FPS Base GPU test: Nvidia GeForce RTX 3080 Ti VRAM: 12 GBTest CPU: Intel Core i9-12900KSystem RAM: 32 GB DDR5-5400OS: Windows 11 21H2Graphics API: DirectX 12Driver: 497.09 |
| Gaming suite 2022 / Halo Infinite / 1920x1080 / Ultra-Preset / Rendering unreported | 104.4 FPS Base GPU test: Nvidia GeForce RTX 3080 Ti VRAM: 12 GBTest CPU: Intel Core i9-12900KSystem RAM: 32 GB DDR5-5400OS: Windows 11 21H2Graphics API: DirectX 12Driver: 497.09 |
| Gaming suite 2022 / Hellblade: Senua's Sacrifice / 1920x1080 / Sehr-hoch-Preset / Rendering unreported | 167.6 FPS Base GPU test: Nvidia GeForce RTX 3080 Ti VRAM: 12 GBTest CPU: Intel Core i9-12900KSystem RAM: 32 GB DDR5-5400OS: Windows 11 21H2Graphics API: DirectX 12Driver: 497.09 |
| Gaming suite 2022 / Hellblade: Senua's Sacrifice / 1920x1080 / Sehr-hoch-Preset; RT „Niedrig“ / Rendering unreported | 135.2 FPS Base GPU test: Nvidia GeForce RTX 3080 Ti VRAM: 12 GBTest CPU: Intel Core i9-12900KSystem RAM: 32 GB DDR5-5400OS: Windows 11 21H2Graphics API: DirectX 12Driver: 497.09 |
| Gaming suite 2022 / Jurassic World Evolution 2 / 1920x1080 / Sehr-hoch-Preset, 16-faches AF, Atmosphäre „Hoch“, AO/Geometrie „Sehr hoch“ / Rendering unreported | 100.9 FPS Base GPU test: Nvidia GeForce RTX 3080 Ti VRAM: 12 GBTest CPU: Intel Core i9-12900KSystem RAM: 32 GB DDR5-5400OS: Windows 11 21H2Graphics API: DirectX 12Driver: 497.09 |
| Gaming suite 2022 / Kena: Bridge of Spirits / 1920x1080 / Maximale Grafikdetails / Rendering unreported | 153.9 FPS Base GPU test: Nvidia GeForce RTX 3080 Ti VRAM: 12 GBTest CPU: Intel Core i9-12900KSystem RAM: 32 GB DDR5-5400OS: Windows 11 21H2Graphics API: DirectX 12Driver: 497.09 |
| Gaming suite 2022 / Life is Strange: True Colors / 1920x1080 / Videosequenzen-Preset / Rendering unreported | 194.9 FPS Base GPU test: Nvidia GeForce RTX 3080 Ti VRAM: 12 GBTest CPU: Intel Core i9-12900KSystem RAM: 32 GB DDR5-5400OS: Windows 11 21H2Graphics API: DirectX 12Driver: 497.09 |
| Gaming suite 2022 / Metro Exodus PC Enhanced Edition / 1920x1080 / Extrem-Qualität, Kein HairWorks/PhysX; RT „Hoch“, RT Reflexionen „Ein“ / Rendering unreported | 90.5 FPS Base GPU test: Nvidia GeForce RTX 3080 Ti VRAM: 12 GBTest CPU: Intel Core i9-12900KSystem RAM: 32 GB DDR5-5400OS: Windows 11 21H2Graphics API: DirectX 12Driver: 497.09 |
| Gaming suite 2022 / Resident Evil Village / 1920x1080 / Maximum-Preset / Rendering unreported | 282.5 FPS Base GPU test: Nvidia GeForce RTX 3080 Ti VRAM: 12 GBTest CPU: Intel Core i9-12900KSystem RAM: 32 GB DDR5-5400OS: Windows 11 21H2Graphics API: DirectX 12Driver: 497.09 |
| Gaming suite 2022 / Resident Evil Village / 1920x1080 / Maximum-Preset; RT-Schatten und Global Illumination „Hoch“ / Rendering unreported | 164.5 FPS Base GPU test: Nvidia GeForce RTX 3080 Ti VRAM: 12 GBTest CPU: Intel Core i9-12900KSystem RAM: 32 GB DDR5-5400OS: Windows 11 21H2Graphics API: DirectX 12Driver: 497.09 |
| Gaming suite 2022 / The Riftbreaker / 1920x1080 / Maximale Grafikdetails / Rendering unreported | 259.1 FPS Base GPU test: Nvidia GeForce RTX 3080 Ti VRAM: 12 GBTest CPU: Intel Core i9-12900KSystem RAM: 32 GB DDR5-5400OS: Windows 11 21H2Graphics API: DirectX 12Driver: 497.09 |
| Gaming suite 2022 / The Riftbreaker / 1920x1080 / Maximale Grafikdetails; RT-Schatten „Hoch“, RT AO „Ein“ / Rendering unreported | 204.5 FPS Base GPU test: Nvidia GeForce RTX 3080 Ti VRAM: 12 GBTest CPU: Intel Core i9-12900KSystem RAM: 32 GB DDR5-5400OS: Windows 11 21H2Graphics API: DirectX 12Driver: 497.09 |
| Gaming suite 2022 / Assassin's Creed Valhalla / 2560x1440 / Extrem-hoch-Preset / Rendering unreported | 94.7 FPS Base GPU test: Nvidia GeForce RTX 3080 Ti VRAM: 12 GBTest CPU: Intel Core i9-12900KSystem RAM: 32 GB DDR5-5400OS: Windows 11 21H2Graphics API: DirectX 12Driver: 497.09 |
| Gaming suite 2022 / Battlefield 2042 / 2560x1440 / Ultra-Preset, HBAO „Voll“ / Rendering unreported | 111.5 FPS Base GPU test: Nvidia GeForce RTX 3080 Ti VRAM: 12 GBTest CPU: Intel Core i9-12900KSystem RAM: 32 GB DDR5-5400OS: Windows 11 21H2Graphics API: DirectX 12Driver: 497.09 |
| Gaming suite 2022 / Battlefield 2042 / 2560x1440 / Ultra-Preset, HBAO „Voll“; RT AO „Ein“ / Rendering unreported | 95.3 FPS Base GPU test: Nvidia GeForce RTX 3080 Ti VRAM: 12 GBTest CPU: Intel Core i9-12900KSystem RAM: 32 GB DDR5-5400OS: Windows 11 21H2Graphics API: DirectX 12Driver: 497.09 |
| Gaming suite 2022 / Call of Duty Vanguard / 2560x1440 / Ultra-Preset, Tessellation „Maximum“ / Rendering unreported | 115.1 FPS Base GPU test: Nvidia GeForce RTX 3080 Ti VRAM: 12 GBTest CPU: Intel Core i9-12900KSystem RAM: 32 GB DDR5-5400OS: Windows 11 21H2Graphics API: DirectX 12Driver: 497.09 |
| Gaming suite 2022 / Cyberpunk 2077 / 2560x1440 / Ultra-Preset / Rendering unreported | 72.5 FPS Base GPU test: Nvidia GeForce RTX 3080 Ti VRAM: 12 GBTest CPU: Intel Core i9-12900KSystem RAM: 32 GB DDR5-5400OS: Windows 11 21H2Graphics API: DirectX 12Driver: 497.09 |
| Gaming suite 2022 / Deathloop / 2560x1440 / Ultra-Preset / Rendering unreported | 108.7 FPS Base GPU test: Nvidia GeForce RTX 3080 Ti VRAM: 12 GBTest CPU: Intel Core i9-12900KSystem RAM: 32 GB DDR5-5400OS: Windows 11 21H2Graphics API: DirectX 12Driver: 497.09 |
| Gaming suite 2022 / Deathloop / 2560x1440 / Ultra-Preset; RT AO „Qualität“, RT-Sonnenschatten / Rendering unreported | 98 FPS Base GPU test: Nvidia GeForce RTX 3080 Ti VRAM: 12 GBTest CPU: Intel Core i9-12900KSystem RAM: 32 GB DDR5-5400OS: Windows 11 21H2Graphics API: DirectX 12Driver: 497.09 |
| Gaming suite 2022 / Diablo II: Resurrected / 2560x1440 / Sehr-Hoch-Preset, Transparenzqualität und VFX-Lichtqualität „Ultra“ / Rendering unreported | 173 FPS Base GPU test: Nvidia GeForce RTX 3080 Ti VRAM: 12 GBTest CPU: Intel Core i9-12900KSystem RAM: 32 GB DDR5-5400OS: Windows 11 21H2Graphics API: DirectX 12Driver: 497.09 |
| Gaming suite 2022 / Doom Eternal / 2560x1440 / Ultra-Albtraum-Preset / Rendering unreported | 279.4 FPS Base GPU test: Nvidia GeForce RTX 3080 Ti VRAM: 12 GBTest CPU: Intel Core i9-12900KSystem RAM: 32 GB DDR5-5400OS: Windows 11 21H2Graphics API: VulkanDriver: 497.09 |
| Gaming suite 2022 / Doom Eternal / 2560x1440 / Ultra-Albtraum-Preset; RT „Ein“ / Rendering unreported | 180.1 FPS Base GPU test: Nvidia GeForce RTX 3080 Ti VRAM: 12 GBTest CPU: Intel Core i9-12900KSystem RAM: 32 GB DDR5-5400OS: Windows 11 21H2Graphics API: VulkanDriver: 497.09 |
| Gaming suite 2022 / F1 2021 / 2560x1440 / Ultrahoch-Preset, AO CACAO / Rendering unreported | 190.8 FPS Base GPU test: Nvidia GeForce RTX 3080 Ti VRAM: 12 GBTest CPU: Intel Core i9-12900KSystem RAM: 32 GB DDR5-5400OS: Windows 11 21H2Graphics API: DirectX 12Driver: 497.09 |
| Gaming suite 2022 / F1 2021 / 2560x1440 / Ultrahoch-Preset, AO CACAO; RT-Schatten und Reflexionen „Mittel“ / Rendering unreported | 133.1 FPS Base GPU test: Nvidia GeForce RTX 3080 Ti VRAM: 12 GBTest CPU: Intel Core i9-12900KSystem RAM: 32 GB DDR5-5400OS: Windows 11 21H2Graphics API: DirectX 12Driver: 497.09 |
| Gaming suite 2022 / Far Cry 6 / 2560x1440 / Ultra-Preset, HD-Texturen / Rendering unreported | 113.5 FPS Base GPU test: Nvidia GeForce RTX 3080 Ti VRAM: 12 GBTest CPU: Intel Core i9-12900KSystem RAM: 32 GB DDR5-5400OS: Windows 11 21H2Graphics API: DirectX 12Driver: 497.09 |
| Gaming suite 2022 / Far Cry 6 / 2560x1440 / Ultra-Preset, HD-Texturen; RT-Schatten und Reflexionen „Ein“ / Rendering unreported | 95.4 FPS Base GPU test: Nvidia GeForce RTX 3080 Ti VRAM: 12 GBTest CPU: Intel Core i9-12900KSystem RAM: 32 GB DDR5-5400OS: Windows 11 21H2Graphics API: DirectX 12Driver: 497.09 |
| Gaming suite 2022 / Forza Horizon 5 / 2560x1440 / Extrem-Preset, 4-faches MSAA, FXAA „Ein“, SSAO „Ultra“, Reflexionen/SSR Extrem / Rendering unreported | 95.9 FPS Base GPU test: Nvidia GeForce RTX 3080 Ti VRAM: 12 GBTest CPU: Intel Core i9-12900KSystem RAM: 32 GB DDR5-5400OS: Windows 11 21H2Graphics API: DirectX 12Driver: 497.09 |
| Gaming suite 2022 / God of War / 2560x1440 / Ultra-Preset + Reflexionen „Ultra+“ / Rendering unreported | 90.2 FPS Base GPU test: Nvidia GeForce RTX 3080 Ti VRAM: 12 GBTest CPU: Intel Core i9-12900KSystem RAM: 32 GB DDR5-5400OS: Windows 11 21H2Graphics API: DirectX 11Driver: 511.23 |
| Gaming suite 2022 / Marvel's Guardians of the Galaxy / 2560x1440 / Ultra-Preset / Rendering unreported | 137.6 FPS Base GPU test: Nvidia GeForce RTX 3080 Ti VRAM: 12 GBTest CPU: Intel Core i9-12900KSystem RAM: 32 GB DDR5-5400OS: Windows 11 21H2Graphics API: DirectX 12Driver: 497.09 |
| Gaming suite 2022 / Marvel's Guardians of the Galaxy / 2560x1440 / Ultra-Preset; RT-Reflexionen „Hoch“, Transparente RT-Reflexionen „Ein“ / Rendering unreported | 110.5 FPS Base GPU test: Nvidia GeForce RTX 3080 Ti VRAM: 12 GBTest CPU: Intel Core i9-12900KSystem RAM: 32 GB DDR5-5400OS: Windows 11 21H2Graphics API: DirectX 12Driver: 497.09 |
| Gaming suite 2022 / Halo Infinite / 2560x1440 / Ultra-Preset / Rendering unreported | 82.9 FPS Base GPU test: Nvidia GeForce RTX 3080 Ti VRAM: 12 GBTest CPU: Intel Core i9-12900KSystem RAM: 32 GB DDR5-5400OS: Windows 11 21H2Graphics API: DirectX 12Driver: 497.09 |
| Gaming suite 2022 / Hellblade: Senua's Sacrifice / 2560x1440 / Sehr-hoch-Preset / Rendering unreported | 120.2 FPS Base GPU test: Nvidia GeForce RTX 3080 Ti VRAM: 12 GBTest CPU: Intel Core i9-12900KSystem RAM: 32 GB DDR5-5400OS: Windows 11 21H2Graphics API: DirectX 12Driver: 497.09 |
| Gaming suite 2022 / Hellblade: Senua's Sacrifice / 2560x1440 / Sehr-hoch-Preset; RT „Niedrig“ / Rendering unreported | 93.8 FPS Base GPU test: Nvidia GeForce RTX 3080 Ti VRAM: 12 GBTest CPU: Intel Core i9-12900KSystem RAM: 32 GB DDR5-5400OS: Windows 11 21H2Graphics API: DirectX 12Driver: 497.09 |
| Gaming suite 2022 / Jurassic World Evolution 2 / 2560x1440 / Sehr-hoch-Preset, 16-faches AF, Atmosphäre „Hoch“, AO/Geometrie „Sehr hoch“ / Rendering unreported | 84.4 FPS Base GPU test: Nvidia GeForce RTX 3080 Ti VRAM: 12 GBTest CPU: Intel Core i9-12900KSystem RAM: 32 GB DDR5-5400OS: Windows 11 21H2Graphics API: DirectX 12Driver: 497.09 |
| Gaming suite 2022 / Kena: Bridge of Spirits / 2560x1440 / Maximale Grafikdetails / Rendering unreported | 113.5 FPS Base GPU test: Nvidia GeForce RTX 3080 Ti VRAM: 12 GBTest CPU: Intel Core i9-12900KSystem RAM: 32 GB DDR5-5400OS: Windows 11 21H2Graphics API: DirectX 12Driver: 497.09 |
| Gaming suite 2022 / Life is Strange: True Colors / 2560x1440 / Videosequenzen-Preset / Rendering unreported | 124.3 FPS Base GPU test: Nvidia GeForce RTX 3080 Ti VRAM: 12 GBTest CPU: Intel Core i9-12900KSystem RAM: 32 GB DDR5-5400OS: Windows 11 21H2Graphics API: DirectX 12Driver: 497.09 |
| Gaming suite 2022 / Metro Exodus PC Enhanced Edition / 2560x1440 / Extrem-Qualität, Kein HairWorks/PhysX; RT „Hoch“, RT Reflexionen „Ein“ / Rendering unreported | 70.7 FPS Base GPU test: Nvidia GeForce RTX 3080 Ti VRAM: 12 GBTest CPU: Intel Core i9-12900KSystem RAM: 32 GB DDR5-5400OS: Windows 11 21H2Graphics API: DirectX 12Driver: 497.09 |
| Gaming suite 2022 / Resident Evil Village / 2560x1440 / Maximum-Preset / Rendering unreported | 195.8 FPS Base GPU test: Nvidia GeForce RTX 3080 Ti VRAM: 12 GBTest CPU: Intel Core i9-12900KSystem RAM: 32 GB DDR5-5400OS: Windows 11 21H2Graphics API: DirectX 12Driver: 497.09 |
| Gaming suite 2022 / Resident Evil Village / 2560x1440 / Maximum-Preset; RT-Schatten und Global Illumination „Hoch“ / Rendering unreported | 134.9 FPS Base GPU test: Nvidia GeForce RTX 3080 Ti VRAM: 12 GBTest CPU: Intel Core i9-12900KSystem RAM: 32 GB DDR5-5400OS: Windows 11 21H2Graphics API: DirectX 12Driver: 497.09 |
| Gaming suite 2022 / The Riftbreaker / 2560x1440 / Maximale Grafikdetails / Rendering unreported | 198.6 FPS Base GPU test: Nvidia GeForce RTX 3080 Ti VRAM: 12 GBTest CPU: Intel Core i9-12900KSystem RAM: 32 GB DDR5-5400OS: Windows 11 21H2Graphics API: DirectX 12Driver: 497.09 |
| Gaming suite 2022 / The Riftbreaker / 2560x1440 / Maximale Grafikdetails; RT-Schatten „Hoch“, RT AO „Ein“ / Rendering unreported | 139.2 FPS Base GPU test: Nvidia GeForce RTX 3080 Ti VRAM: 12 GBTest CPU: Intel Core i9-12900KSystem RAM: 32 GB DDR5-5400OS: Windows 11 21H2Graphics API: DirectX 12Driver: 497.09 |
| Gaming suite 2022 / Assassin's Creed Valhalla / 3840x2160 / Extrem-hoch-Preset / Rendering unreported | 62.2 FPS Base GPU test: Nvidia GeForce RTX 3080 Ti VRAM: 12 GBTest CPU: Intel Core i9-12900KSystem RAM: 32 GB DDR5-5400OS: Windows 11 21H2Graphics API: DirectX 12Driver: 497.09 |
| Gaming suite 2022 / Battlefield 2042 / 3840x2160 / Ultra-Preset, HBAO „Voll“ / Rendering unreported | 71.7 FPS Base GPU test: Nvidia GeForce RTX 3080 Ti VRAM: 12 GBTest CPU: Intel Core i9-12900KSystem RAM: 32 GB DDR5-5400OS: Windows 11 21H2Graphics API: DirectX 12Driver: 497.09 |
| Gaming suite 2022 / Battlefield 2042 / 3840x2160 / Ultra-Preset, HBAO „Voll“; RT AO „Ein“ / Rendering unreported | 60.6 FPS Base GPU test: Nvidia GeForce RTX 3080 Ti VRAM: 12 GBTest CPU: Intel Core i9-12900KSystem RAM: 32 GB DDR5-5400OS: Windows 11 21H2Graphics API: DirectX 12Driver: 497.09 |
| Gaming suite 2022 / Call of Duty Vanguard / 3840x2160 / Ultra-Preset, Tessellation „Maximum“ / Rendering unreported | 63.3 FPS Base GPU test: Nvidia GeForce RTX 3080 Ti VRAM: 12 GBTest CPU: Intel Core i9-12900KSystem RAM: 32 GB DDR5-5400OS: Windows 11 21H2Graphics API: DirectX 12Driver: 497.09 |
| Gaming suite 2022 / Cyberpunk 2077 / 3840x2160 / Mittel-Preset / Rendering unreported | 59.1 FPS Base GPU test: Nvidia GeForce RTX 3080 Ti VRAM: 12 GBTest CPU: Intel Core i9-12900KSystem RAM: 32 GB DDR5-5400OS: Windows 11 21H2Graphics API: DirectX 12Driver: 497.09 |
| Gaming suite 2022 / Deathloop / 3840x2160 / Ultra-Preset / Rendering unreported | 65 FPS Base GPU test: Nvidia GeForce RTX 3080 Ti VRAM: 12 GBTest CPU: Intel Core i9-12900KSystem RAM: 32 GB DDR5-5400OS: Windows 11 21H2Graphics API: DirectX 12Driver: 497.09 |
| Gaming suite 2022 / Deathloop / 3840x2160 / Ultra-Preset; RT AO „Qualität“, RT-Sonnenschatten / Rendering unreported | 52.3 FPS Base GPU test: Nvidia GeForce RTX 3080 Ti VRAM: 12 GBTest CPU: Intel Core i9-12900KSystem RAM: 32 GB DDR5-5400OS: Windows 11 21H2Graphics API: DirectX 12Driver: 497.09 |
| Gaming suite 2022 / Diablo II: Resurrected / 3840x2160 / Sehr-Hoch-Preset, Transparenzqualität und VFX-Lichtqualität „Ultra“ / Rendering unreported | 101.2 FPS Base GPU test: Nvidia GeForce RTX 3080 Ti VRAM: 12 GBTest CPU: Intel Core i9-12900KSystem RAM: 32 GB DDR5-5400OS: Windows 11 21H2Graphics API: DirectX 12Driver: 497.09 |
| Gaming suite 2022 / Doom Eternal / 3840x2160 / Ultra-Albtraum-Preset / Rendering unreported | 168.3 FPS Base GPU test: Nvidia GeForce RTX 3080 Ti VRAM: 12 GBTest CPU: Intel Core i9-12900KSystem RAM: 32 GB DDR5-5400OS: Windows 11 21H2Graphics API: VulkanDriver: 497.09 |
| Gaming suite 2022 / Doom Eternal / 3840x2160 / Ultra-Albtraum-Preset; RT „Ein“ / Rendering unreported | 106.4 FPS Base GPU test: Nvidia GeForce RTX 3080 Ti VRAM: 12 GBTest CPU: Intel Core i9-12900KSystem RAM: 32 GB DDR5-5400OS: Windows 11 21H2Graphics API: VulkanDriver: 497.09 |
| Gaming suite 2022 / F1 2021 / 3840x2160 / Ultrahoch-Preset, AO CACAO / Rendering unreported | 115.1 FPS Base GPU test: Nvidia GeForce RTX 3080 Ti VRAM: 12 GBTest CPU: Intel Core i9-12900KSystem RAM: 32 GB DDR5-5400OS: Windows 11 21H2Graphics API: DirectX 12Driver: 497.09 |
| Gaming suite 2022 / F1 2021 / 3840x2160 / Ultrahoch-Preset, AO CACAO; RT-Schatten und Reflexionen „Mittel“ / Rendering unreported | 76.4 FPS Base GPU test: Nvidia GeForce RTX 3080 Ti VRAM: 12 GBTest CPU: Intel Core i9-12900KSystem RAM: 32 GB DDR5-5400OS: Windows 11 21H2Graphics API: DirectX 12Driver: 497.09 |
| Gaming suite 2022 / Far Cry 6 / 3840x2160 / Ultra-Preset, HD-Texturen / Rendering unreported | 70.8 FPS Base GPU test: Nvidia GeForce RTX 3080 Ti VRAM: 12 GBTest CPU: Intel Core i9-12900KSystem RAM: 32 GB DDR5-5400OS: Windows 11 21H2Graphics API: DirectX 12Driver: 497.09 |
| Gaming suite 2022 / Far Cry 6 / 3840x2160 / Ultra-Preset, HD-Texturen; RT-Schatten und Reflexionen „Ein“ / Rendering unreported | 60.8 FPS Base GPU test: Nvidia GeForce RTX 3080 Ti VRAM: 12 GBTest CPU: Intel Core i9-12900KSystem RAM: 32 GB DDR5-5400OS: Windows 11 21H2Graphics API: DirectX 12Driver: 497.09 |
| Gaming suite 2022 / Forza Horizon 5 / 3840x2160 / Extrem-Preset, 4-faches MSAA, FXAA „Ein“, SSAO „Ultra“, Reflexionen/SSR „Extrem“ / Rendering unreported | 64.2 FPS Base GPU test: Nvidia GeForce RTX 3080 Ti VRAM: 12 GBTest CPU: Intel Core i9-12900KSystem RAM: 32 GB DDR5-5400OS: Windows 11 21H2Graphics API: DirectX 12Driver: 497.09 |
| Gaming suite 2022 / God of War / 3840x2160 / Ultra-Preset + Reflexionen „Ultra+“ / Rendering unreported | 71.1 FPS Base GPU test: Nvidia GeForce RTX 3080 Ti VRAM: 12 GBTest CPU: Intel Core i9-12900KSystem RAM: 32 GB DDR5-5400OS: Windows 11 21H2Graphics API: DirectX 11Driver: 511.23 |
| Gaming suite 2022 / Marvel's Guardians of the Galaxy / 3840x2160 / Ultra-Preset / Rendering unreported | 84.3 FPS Base GPU test: Nvidia GeForce RTX 3080 Ti VRAM: 12 GBTest CPU: Intel Core i9-12900KSystem RAM: 32 GB DDR5-5400OS: Windows 11 21H2Graphics API: DirectX 12Driver: 497.09 |
| Gaming suite 2022 / Marvel's Guardians of the Galaxy / 3840x2160 / Ultra-Preset; RT-Reflexionen „Hoch“, Transparente RT-Reflexionen „Ein“ / Rendering unreported | 66.5 FPS Base GPU test: Nvidia GeForce RTX 3080 Ti VRAM: 12 GBTest CPU: Intel Core i9-12900KSystem RAM: 32 GB DDR5-5400OS: Windows 11 21H2Graphics API: DirectX 12Driver: 497.09 |
| Gaming suite 2022 / Halo Infinite / 3840x2160 / Ultra-Preset / Rendering unreported | 58.4 FPS Base GPU test: Nvidia GeForce RTX 3080 Ti VRAM: 12 GBTest CPU: Intel Core i9-12900KSystem RAM: 32 GB DDR5-5400OS: Windows 11 21H2Graphics API: DirectX 12Driver: 497.09 |
| Gaming suite 2022 / Hellblade: Senua's Sacrifice / 3840x2160 / Sehr-hoch-Preset / Rendering unreported | 65.8 FPS Base GPU test: Nvidia GeForce RTX 3080 Ti VRAM: 12 GBTest CPU: Intel Core i9-12900KSystem RAM: 32 GB DDR5-5400OS: Windows 11 21H2Graphics API: DirectX 12Driver: 497.09 |
| Gaming suite 2022 / Hellblade: Senua's Sacrifice / 3840x2160 / Sehr-hoch-Preset; RT „Niedrig“ / Rendering unreported | 52.7 FPS Base GPU test: Nvidia GeForce RTX 3080 Ti VRAM: 12 GBTest CPU: Intel Core i9-12900KSystem RAM: 32 GB DDR5-5400OS: Windows 11 21H2Graphics API: DirectX 12Driver: 497.09 |
| Gaming suite 2022 / Jurassic World Evolution 2 / 3840x2160 / Sehr-hoch-Preset, 16-faches AF, Atmosphäre „Hoch“, AO/Geometrie „Sehr hoch“ / Rendering unreported | 58.1 FPS Base GPU test: Nvidia GeForce RTX 3080 Ti VRAM: 12 GBTest CPU: Intel Core i9-12900KSystem RAM: 32 GB DDR5-5400OS: Windows 11 21H2Graphics API: DirectX 12Driver: 497.09 |
| Gaming suite 2022 / Kena: Bridge of Spirits / 3840x2160 / Maximale Grafikdetails / Rendering unreported | 65.9 FPS Base GPU test: Nvidia GeForce RTX 3080 Ti VRAM: 12 GBTest CPU: Intel Core i9-12900KSystem RAM: 32 GB DDR5-5400OS: Windows 11 21H2Graphics API: DirectX 12Driver: 497.09 |
| Gaming suite 2022 / Life is Strange: True Colors / 3840x2160 / Videosequenzen-Preset / Rendering unreported | 66.9 FPS Base GPU test: Nvidia GeForce RTX 3080 Ti VRAM: 12 GBTest CPU: Intel Core i9-12900KSystem RAM: 32 GB DDR5-5400OS: Windows 11 21H2Graphics API: DirectX 12Driver: 497.09 |
| Gaming suite 2022 / Metro Exodus PC Enhanced Edition / 3840x2160 / Hoch-Qualität, Kein HairWorks/PhysX; RT „Hoch“, RT Reflexionen „Ein“ / Rendering unreported | 67.1 FPS Base GPU test: Nvidia GeForce RTX 3080 Ti VRAM: 12 GBTest CPU: Intel Core i9-12900KSystem RAM: 32 GB DDR5-5400OS: Windows 11 21H2Graphics API: DirectX 12Driver: 497.09 |
| Gaming suite 2022 / Resident Evil Village / 3840x2160 / Maximum-Preset / Rendering unreported | 107.1 FPS Base GPU test: Nvidia GeForce RTX 3080 Ti VRAM: 12 GBTest CPU: Intel Core i9-12900KSystem RAM: 32 GB DDR5-5400OS: Windows 11 21H2Graphics API: DirectX 12Driver: 497.09 |
| Gaming suite 2022 / Resident Evil Village / 3840x2160 / Maximum-Preset; RT-Schatten und Global Illumination „Hoch“ / Rendering unreported | 92.2 FPS Base GPU test: Nvidia GeForce RTX 3080 Ti VRAM: 12 GBTest CPU: Intel Core i9-12900KSystem RAM: 32 GB DDR5-5400OS: Windows 11 21H2Graphics API: DirectX 12Driver: 497.09 |
| Gaming suite 2022 / The Riftbreaker / 3840x2160 / Maximale Grafikdetails / Rendering unreported | 122.2 FPS Base GPU test: Nvidia GeForce RTX 3080 Ti VRAM: 12 GBTest CPU: Intel Core i9-12900KSystem RAM: 32 GB DDR5-5400OS: Windows 11 21H2Graphics API: DirectX 12Driver: 497.09 |
| Gaming suite 2022 / The Riftbreaker / 3840x2160 / Maximale Grafikdetails; RT-Schatten „Hoch“, RT AO „Ein“ / Rendering unreported | 73.5 FPS Base GPU test: Nvidia GeForce RTX 3080 Ti VRAM: 12 GBTest CPU: Intel Core i9-12900KSystem RAM: 32 GB DDR5-5400OS: Windows 11 21H2Graphics API: DirectX 12Driver: 497.09 |
| Gaming suite 2023 / A Plague Tale: Requiem / 1920x1080 / Ultra / Ultra Quality / RT off | 138.3 FPS Base GPU test: Nvidia GeForce RTX 3080 Ti Settings: Ultra-Preset, Auflösungsoptimierung „Ultra-Quality“VRAM: 12 GBTest CPU: AMD Ryzen 9 7950X3DSystem RAM: 32 GB DDR5-6000 30-38-38-96OS: Windows 11 22H2Driver: 531.41Resizable BAR: enabledHVCI: enabled |
| Gaming suite 2023 / Atomic Heart / 1920x1080 / Atomic / Rendering unreported / RT off | 117.1 FPS Base GPU test: Nvidia GeForce RTX 3080 Ti Settings: Atomic-PresetVRAM: 12 GBTest CPU: AMD Ryzen 9 7950X3DSystem RAM: 32 GB DDR5-6000 30-38-38-96OS: Windows 11 22H2Driver: 531.41Resizable BAR: enabledHVCI: enabled |
| Gaming suite 2023 / Call of Duty: Modern Warfare 2 / 1920x1080 / Ultra / Rendering unreported / RT off | 127.9 FPS Base GPU test: Nvidia GeForce RTX 3080 Ti Settings: Ultra-Preset, Tessellation „Alle“, Shadow-Maps „Extra“, Wetter „Ultra“VRAM: 12 GBTest CPU: AMD Ryzen 9 7950X3DSystem RAM: 32 GB DDR5-6000 30-38-38-96OS: Windows 11 22H2Driver: 531.41Resizable BAR: enabledHVCI: enabled |
| Gaming suite 2023 / Company of Heroes 3 / 1920x1080 / Maximum / Rendering unreported / RT off | 142 FPS Base GPU test: Nvidia GeForce RTX 3080 Ti Settings: Maximale GrafikdetailsVRAM: 12 GBTest CPU: AMD Ryzen 9 7950X3DSystem RAM: 32 GB DDR5-6000 30-38-38-96OS: Windows 11 22H2Driver: 531.41Resizable BAR: enabledHVCI: enabled |
| Gaming suite 2023 / Cyberpunk 2077 / 1920x1080 / Ultra / Rendering unreported / RT off | 116.9 FPS Base GPU test: Nvidia GeForce RTX 3080 Ti Settings: Ultra-PresetVRAM: 12 GBTest CPU: AMD Ryzen 9 7950X3DSystem RAM: 32 GB DDR5-6000 30-38-38-96OS: Windows 11 22H2Driver: 531.41Resizable BAR: enabledHVCI: enabled |
| Gaming suite 2023 / Cyberpunk 2077 / 1920x1080 / Ultra / Rendering unreported / RT on | 66.7 FPS Base GPU test: Nvidia GeForce RTX 3080 Ti Settings: Ultra-Preset; RT: GI „Mittel“, Schatten „Ein“VRAM: 12 GBTest CPU: AMD Ryzen 9 7950X3DSystem RAM: 32 GB DDR5-6000 30-38-38-96OS: Windows 11 22H2Driver: 531.41Resizable BAR: enabledHVCI: enabled |
| Gaming suite 2023 / Dead Space / 1920x1080 / Ultra / Rendering unreported / RT off | 135.1 FPS Base GPU test: Nvidia GeForce RTX 3080 Ti Settings: Ultra-PresetVRAM: 12 GBTest CPU: AMD Ryzen 9 7950X3DSystem RAM: 32 GB DDR5-6000 30-38-38-96OS: Windows 11 22H2Driver: 531.41Resizable BAR: enabledHVCI: enabled |
| Gaming suite 2023 / Dead Space / 1920x1080 / Ultra / Rendering unreported / RT on | 117.4 FPS Base GPU test: Nvidia GeForce RTX 3080 Ti Settings: Ultra-Preset; RT: AO „Ein“VRAM: 12 GBTest CPU: AMD Ryzen 9 7950X3DSystem RAM: 32 GB DDR5-6000 30-38-38-96OS: Windows 11 22H2Driver: 531.41Resizable BAR: enabledHVCI: enabled |
| Gaming suite 2023 / Dying Light 2 / 1920x1080 / High / Rendering unreported / RT off | 164.5 FPS Base GPU test: Nvidia GeForce RTX 3080 Ti Settings: Hohe-Qualität-PresetVRAM: 12 GBTest CPU: AMD Ryzen 9 7950X3DSystem RAM: 32 GB DDR5-6000 30-38-38-96OS: Windows 11 22H2Driver: 531.41Resizable BAR: enabledHVCI: enabled |
| Gaming suite 2023 / Dying Light 2 / 1920x1080 / High / Rendering unreported / RT on | 112.2 FPS Base GPU test: Nvidia GeForce RTX 3080 Ti Settings: Hohe-Qualität-Preset; RT: GI + AO „Ein“VRAM: 12 GBTest CPU: AMD Ryzen 9 7950X3DSystem RAM: 32 GB DDR5-6000 30-38-38-96OS: Windows 11 22H2Driver: 531.41Resizable BAR: enabledHVCI: enabled |
| Gaming suite 2023 / F1 22 / 1920x1080 / Ultra high / Rendering unreported / RT off | 270.8 FPS Base GPU test: Nvidia GeForce RTX 3080 Ti Settings: Ultrahoch-PresetVRAM: 12 GBTest CPU: AMD Ryzen 9 7950X3DSystem RAM: 32 GB DDR5-6000 30-38-38-96OS: Windows 11 22H2Driver: 531.41Resizable BAR: enabledHVCI: enabled |
| Gaming suite 2023 / F1 22 / 1920x1080 / Ultra high / Rendering unreported / RT on | 173.2 FPS Base GPU test: Nvidia GeForce RTX 3080 Ti Settings: Ultrahoch-Preset; RT: Reflexionen (Voll) + Schatten + AO „Mittel“VRAM: 12 GBTest CPU: AMD Ryzen 9 7950X3DSystem RAM: 32 GB DDR5-6000 30-38-38-96OS: Windows 11 22H2Driver: 531.41Resizable BAR: enabledHVCI: enabled |
| Gaming suite 2023 / Forspoken / 1920x1080 / Ultra / Rendering unreported / RT off | 77.6 FPS Base GPU test: Nvidia GeForce RTX 3080 Ti Settings: Ultra-Preset, AO FidelityFXVRAM: 12 GBTest CPU: AMD Ryzen 9 7950X3DSystem RAM: 32 GB DDR5-6000 30-38-38-96OS: Windows 11 22H2Driver: 531.41Resizable BAR: enabledHVCI: enabled |
| Gaming suite 2023 / Forspoken / 1920x1080 / Ultra / Rendering unreported / RT on | 63.4 FPS Base GPU test: Nvidia GeForce RTX 3080 Ti Settings: Ultra-Preset, AO FidelityFX; RT: Schatten + AO „Ein“VRAM: 12 GBTest CPU: AMD Ryzen 9 7950X3DSystem RAM: 32 GB DDR5-6000 30-38-38-96OS: Windows 11 22H2Driver: 531.41Resizable BAR: enabledHVCI: enabled |
| Gaming suite 2023 / Hogwarts Legacy / 1920x1080 / Ultra / Rendering unreported / RT off | 90.8 FPS Base GPU test: Nvidia GeForce RTX 3080 Ti Settings: Ultra-PresetVRAM: 12 GBTest CPU: AMD Ryzen 9 7950X3DSystem RAM: 32 GB DDR5-6000 30-38-38-96OS: Windows 11 22H2Driver: 531.41Resizable BAR: enabledHVCI: enabled |
| Gaming suite 2023 / Hogwarts Legacy / 1920x1080 / Ultra / Rendering unreported / RT on | 78.8 FPS Base GPU test: Nvidia GeForce RTX 3080 Ti Settings: Ultra-Preset; RT: Reflexionen „Ultra“VRAM: 12 GBTest CPU: AMD Ryzen 9 7950X3DSystem RAM: 32 GB DDR5-6000 30-38-38-96OS: Windows 11 22H2Driver: 531.41Resizable BAR: enabledHVCI: enabled |
| Gaming suite 2023 / Metro Exodus PC Enhanced Edition / 1920x1080 / Extreme / Rendering unreported / RT on | 95.4 FPS Base GPU test: Nvidia GeForce RTX 3080 Ti Settings: Extrem-Qualität, kein HW, kein PhysX; RT: „Hoch“ + ReflexionenVRAM: 12 GBTest CPU: AMD Ryzen 9 7950X3DSystem RAM: 32 GB DDR5-6000 30-38-38-96OS: Windows 11 22H2Driver: 531.41Resizable BAR: enabledHVCI: enabled |
| Gaming suite 2023 / Resident Evil 4 / 1920x1080 / Maximum / Rendering unreported / RT off | 150 FPS Base GPU test: Nvidia GeForce RTX 3080 Ti Settings: Maximum-PresetVRAM: 12 GBTest CPU: AMD Ryzen 9 7950X3DSystem RAM: 32 GB DDR5-6000 30-38-38-96OS: Windows 11 22H2Driver: 531.41Resizable BAR: enabledHVCI: enabled |
| Gaming suite 2023 / Resident Evil 4 / 1920x1080 / Maximum / Rendering unreported / RT on | 129 FPS Base GPU test: Nvidia GeForce RTX 3080 Ti Settings: Maximum-Preset; RT: Reflexionen „Hoch“VRAM: 12 GBTest CPU: AMD Ryzen 9 7950X3DSystem RAM: 32 GB DDR5-6000 30-38-38-96OS: Windows 11 22H2Driver: 531.41Resizable BAR: enabledHVCI: enabled |
| Gaming suite 2023 / Returnal / 1920x1080 / Epic / Rendering unreported / RT off | 166.7 FPS Base GPU test: Nvidia GeForce RTX 3080 Ti Settings: Episch-PresetVRAM: 12 GBTest CPU: AMD Ryzen 9 7950X3DSystem RAM: 32 GB DDR5-6000 30-38-38-96OS: Windows 11 22H2Driver: 531.41Resizable BAR: enabledHVCI: enabled |
| Gaming suite 2023 / Returnal / 1920x1080 / Epic / Rendering unreported / RT on | 141.8 FPS Base GPU test: Nvidia GeForce RTX 3080 Ti Settings: Episch-Preset; RT: Reflexionen „Episch“, Schatten „Mittel“VRAM: 12 GBTest CPU: AMD Ryzen 9 7950X3DSystem RAM: 32 GB DDR5-6000 30-38-38-96OS: Windows 11 22H2Driver: 531.41Resizable BAR: enabledHVCI: enabled |
| Gaming suite 2023 / Spider-Man: Miles Morales / 1920x1080 / Very high / Rendering unreported / RT off | 130.6 FPS Base GPU test: Nvidia GeForce RTX 3080 Ti Settings: Sehr-hoch-Preset, 16-faches AF, Schatten „Sehr hoch“, Detailstufe „Sehr hoch“VRAM: 12 GBTest CPU: AMD Ryzen 9 7950X3DSystem RAM: 32 GB DDR5-6000 30-38-38-96OS: Windows 11 22H2Driver: 531.41Resizable BAR: enabledHVCI: enabled |
| Gaming suite 2023 / Spider-Man: Miles Morales / 1920x1080 / Very high / Rendering unreported / RT on | 98.9 FPS Base GPU test: Nvidia GeForce RTX 3080 Ti Settings: Sehr-hoch-Preset, 16-faches AF, Schatten „Sehr hoch“, Detailstufe „Sehr hoch“; RT: Reflexionen Auflösung „Hoch“, Geometrie „Sehr hoch“, Sichtweite 10, Schatten „Mittel“VRAM: 12 GBTest CPU: AMD Ryzen 9 7950X3DSystem RAM: 32 GB DDR5-6000 30-38-38-96OS: Windows 11 22H2Driver: 531.41Resizable BAR: enabledHVCI: enabled |
| Gaming suite 2023 / The Callisto Protocol / 1920x1080 / Ultra / Rendering unreported / RT off | 171.3 FPS Base GPU test: Nvidia GeForce RTX 3080 Ti Settings: Ultra-PresetVRAM: 12 GBTest CPU: AMD Ryzen 9 7950X3DSystem RAM: 32 GB DDR5-6000 30-38-38-96OS: Windows 11 22H2Driver: 531.41Resizable BAR: enabledHVCI: enabled |
| Gaming suite 2023 / The Callisto Protocol / 1920x1080 / Ultra / Rendering unreported / RT on | 102.3 FPS Base GPU test: Nvidia GeForce RTX 3080 Ti Settings: Ultra-Preset; RT: Reflexionen „Mittel“, Schatten „Ein“, Übertragung „Ein“VRAM: 12 GBTest CPU: AMD Ryzen 9 7950X3DSystem RAM: 32 GB DDR5-6000 30-38-38-96OS: Windows 11 22H2Driver: 531.41Resizable BAR: enabledHVCI: enabled |
| Gaming suite 2023 / The Last of Us Part I / 1920x1080 / Ultra / Rendering unreported / RT off | 92.1 FPS Base GPU test: Nvidia GeForce RTX 3080 Ti Settings: Ultra-PresetVRAM: 12 GBTest CPU: AMD Ryzen 9 7950X3DSystem RAM: 32 GB DDR5-6000 30-38-38-96OS: Windows 11 22H2Driver: 531.41Resizable BAR: enabledHVCI: enabled |
| Gaming suite 2023 / The Witcher 3 / 1920x1080 / Highest / Rendering unreported / RT off | 152 FPS Base GPU test: Nvidia GeForce RTX 3080 Ti Settings: Höchste-Preset, Höchste+-Details, kein HWVRAM: 12 GBTest CPU: AMD Ryzen 9 7950X3DSystem RAM: 32 GB DDR5-6000 30-38-38-96OS: Windows 11 22H2Driver: 531.41Resizable BAR: enabledHVCI: enabled |
| Gaming suite 2023 / The Witcher 3 / 1920x1080 / Highest / Rendering unreported / RT on | 84 FPS Base GPU test: Nvidia GeForce RTX 3080 Ti Settings: Höchste-Preset, Höchste+-Details, kein HW; RT: GI „Performance“, Reflexionen „Ein“VRAM: 12 GBTest CPU: AMD Ryzen 9 7950X3DSystem RAM: 32 GB DDR5-6000 30-38-38-96OS: Windows 11 22H2Driver: 531.41Resizable BAR: enabledHVCI: enabled |
| Gaming suite 2023 / Uncharted / 1920x1080 / Ultra / Rendering unreported / RT off | 112.7 FPS Base GPU test: Nvidia GeForce RTX 3080 Ti Settings: Ultra-PresetVRAM: 12 GBTest CPU: AMD Ryzen 9 7950X3DSystem RAM: 32 GB DDR5-6000 30-38-38-96OS: Windows 11 22H2Driver: 531.41Resizable BAR: enabledHVCI: enabled |
| Gaming suite 2023 / A Plague Tale: Requiem / 2560x1440 / Ultra / Ultra Quality / RT off | 99.2 FPS Base GPU test: Nvidia GeForce RTX 3080 Ti Settings: Ultra-Preset, Auflösungsoptimierung „Ultra-Quality“VRAM: 12 GBTest CPU: AMD Ryzen 9 7950X3DSystem RAM: 32 GB DDR5-6000 30-38-38-96OS: Windows 11 22H2Driver: 531.41Resizable BAR: enabledHVCI: enabled |
| Gaming suite 2023 / Atomic Heart / 2560x1440 / Atomic / Rendering unreported / RT off | 93.8 FPS Base GPU test: Nvidia GeForce RTX 3080 Ti Settings: Atomic-PresetVRAM: 12 GBTest CPU: AMD Ryzen 9 7950X3DSystem RAM: 32 GB DDR5-6000 30-38-38-96OS: Windows 11 22H2Driver: 531.41Resizable BAR: enabledHVCI: enabled |
| Gaming suite 2023 / Call of Duty: Modern Warfare 2 / 2560x1440 / Ultra / Rendering unreported / RT off | 93 FPS Base GPU test: Nvidia GeForce RTX 3080 Ti Settings: Ultra-Preset, Tessellation „Alle“, Shadow-Maps „Extra“, Wetter „Ultra“VRAM: 12 GBTest CPU: AMD Ryzen 9 7950X3DSystem RAM: 32 GB DDR5-6000 30-38-38-96OS: Windows 11 22H2Driver: 531.41Resizable BAR: enabledHVCI: enabled |
| Gaming suite 2023 / Company of Heroes 3 / 2560x1440 / Maximum / Rendering unreported / RT off | 113.5 FPS Base GPU test: Nvidia GeForce RTX 3080 Ti Settings: Maximale GrafikdetailsVRAM: 12 GBTest CPU: AMD Ryzen 9 7950X3DSystem RAM: 32 GB DDR5-6000 30-38-38-96OS: Windows 11 22H2Driver: 531.41Resizable BAR: enabledHVCI: enabled |
| Gaming suite 2023 / Cyberpunk 2077 / 2560x1440 / Ultra / Rendering unreported / RT off | 80.8 FPS Base GPU test: Nvidia GeForce RTX 3080 Ti Settings: Ultra-PresetVRAM: 12 GBTest CPU: AMD Ryzen 9 7950X3DSystem RAM: 32 GB DDR5-6000 30-38-38-96OS: Windows 11 22H2Driver: 531.41Resizable BAR: enabledHVCI: enabled |
| Gaming suite 2023 / Cyberpunk 2077 / 2560x1440 / Ultra / Rendering unreported / RT on | 46 FPS Base GPU test: Nvidia GeForce RTX 3080 Ti Settings: Ultra-Preset; RT: GI „Mittel“, Schatten „Ein“VRAM: 12 GBTest CPU: AMD Ryzen 9 7950X3DSystem RAM: 32 GB DDR5-6000 30-38-38-96OS: Windows 11 22H2Driver: 531.41Resizable BAR: enabledHVCI: enabled |
| Gaming suite 2023 / Dead Space / 2560x1440 / Ultra / Rendering unreported / RT off | 94.5 FPS Base GPU test: Nvidia GeForce RTX 3080 Ti Settings: Ultra-PresetVRAM: 12 GBTest CPU: AMD Ryzen 9 7950X3DSystem RAM: 32 GB DDR5-6000 30-38-38-96OS: Windows 11 22H2Driver: 531.41Resizable BAR: enabledHVCI: enabled |
| Gaming suite 2023 / Dead Space / 2560x1440 / Ultra / Rendering unreported / RT on | 86.8 FPS Base GPU test: Nvidia GeForce RTX 3080 Ti Settings: Ultra-Preset; RT: AO „Ein“VRAM: 12 GBTest CPU: AMD Ryzen 9 7950X3DSystem RAM: 32 GB DDR5-6000 30-38-38-96OS: Windows 11 22H2Driver: 531.41Resizable BAR: enabledHVCI: enabled |
| Gaming suite 2023 / Dying Light 2 / 2560x1440 / High / Rendering unreported / RT off | 115.7 FPS Base GPU test: Nvidia GeForce RTX 3080 Ti Settings: Hohe-Qualität-PresetVRAM: 12 GBTest CPU: AMD Ryzen 9 7950X3DSystem RAM: 32 GB DDR5-6000 30-38-38-96OS: Windows 11 22H2Driver: 531.41Resizable BAR: enabledHVCI: enabled |
| Gaming suite 2023 / Dying Light 2 / 2560x1440 / High / Rendering unreported / RT on | 73.7 FPS Base GPU test: Nvidia GeForce RTX 3080 Ti Settings: Hohe-Qualität-Preset; RT: GI + AO „Ein“VRAM: 12 GBTest CPU: AMD Ryzen 9 7950X3DSystem RAM: 32 GB DDR5-6000 30-38-38-96OS: Windows 11 22H2Driver: 531.41Resizable BAR: enabledHVCI: enabled |
| Gaming suite 2023 / F1 22 / 2560x1440 / Ultra high / Rendering unreported / RT off | 202.8 FPS Base GPU test: Nvidia GeForce RTX 3080 Ti Settings: Ultrahoch-PresetVRAM: 12 GBTest CPU: AMD Ryzen 9 7950X3DSystem RAM: 32 GB DDR5-6000 30-38-38-96OS: Windows 11 22H2Driver: 531.41Resizable BAR: enabledHVCI: enabled |
| Gaming suite 2023 / F1 22 / 2560x1440 / Ultra high / Rendering unreported / RT on | 122.4 FPS Base GPU test: Nvidia GeForce RTX 3080 Ti Settings: Ultrahoch-Preset; RT: Reflexionen (Voll) + Schatten + AO „Mittel“VRAM: 12 GBTest CPU: AMD Ryzen 9 7950X3DSystem RAM: 32 GB DDR5-6000 30-38-38-96OS: Windows 11 22H2Driver: 531.41Resizable BAR: enabledHVCI: enabled |
| Gaming suite 2023 / Forspoken / 2560x1440 / Ultra / Rendering unreported / RT off | 60.6 FPS Base GPU test: Nvidia GeForce RTX 3080 Ti Settings: Ultra-Preset, AO FidelityFXVRAM: 12 GBTest CPU: AMD Ryzen 9 7950X3DSystem RAM: 32 GB DDR5-6000 30-38-38-96OS: Windows 11 22H2Driver: 531.41Resizable BAR: enabledHVCI: enabled |
| Gaming suite 2023 / Forspoken / 2560x1440 / Ultra / Rendering unreported / RT on | 48.6 FPS Base GPU test: Nvidia GeForce RTX 3080 Ti Settings: Ultra-Preset, AO FidelityFX; RT: Schatten + AO „Ein“VRAM: 12 GBTest CPU: AMD Ryzen 9 7950X3DSystem RAM: 32 GB DDR5-6000 30-38-38-96OS: Windows 11 22H2Driver: 531.41Resizable BAR: enabledHVCI: enabled |
| Gaming suite 2023 / Hogwarts Legacy / 2560x1440 / Ultra / Rendering unreported / RT off | 72.2 FPS Base GPU test: Nvidia GeForce RTX 3080 Ti Settings: Ultra-PresetVRAM: 12 GBTest CPU: AMD Ryzen 9 7950X3DSystem RAM: 32 GB DDR5-6000 30-38-38-96OS: Windows 11 22H2Driver: 531.41Resizable BAR: enabledHVCI: enabled |
| Gaming suite 2023 / Hogwarts Legacy / 2560x1440 / Ultra / Rendering unreported / RT on | 63.9 FPS Base GPU test: Nvidia GeForce RTX 3080 Ti Settings: Ultra-Preset; RT: Reflexionen „Ultra“VRAM: 12 GBTest CPU: AMD Ryzen 9 7950X3DSystem RAM: 32 GB DDR5-6000 30-38-38-96OS: Windows 11 22H2Driver: 531.41Resizable BAR: enabledHVCI: enabled |
| Gaming suite 2023 / Metro Exodus PC Enhanced Edition / 2560x1440 / Extreme / Rendering unreported / RT on | 74.6 FPS Base GPU test: Nvidia GeForce RTX 3080 Ti Settings: Extrem-Qualität, kein HW, kein PhysX; RT: „Hoch“ + ReflexionenVRAM: 12 GBTest CPU: AMD Ryzen 9 7950X3DSystem RAM: 32 GB DDR5-6000 30-38-38-96OS: Windows 11 22H2Driver: 531.41Resizable BAR: enabledHVCI: enabled |
| Gaming suite 2023 / Resident Evil 4 / 2560x1440 / Maximum / Rendering unreported / RT off | 115.5 FPS Base GPU test: Nvidia GeForce RTX 3080 Ti Settings: Maximum-PresetVRAM: 12 GBTest CPU: AMD Ryzen 9 7950X3DSystem RAM: 32 GB DDR5-6000 30-38-38-96OS: Windows 11 22H2Driver: 531.41Resizable BAR: enabledHVCI: enabled |
| Gaming suite 2023 / Resident Evil 4 / 2560x1440 / Maximum / Rendering unreported / RT on | 106.1 FPS Base GPU test: Nvidia GeForce RTX 3080 Ti Settings: Maximum-Preset; RT: Reflexionen „Hoch“VRAM: 12 GBTest CPU: AMD Ryzen 9 7950X3DSystem RAM: 32 GB DDR5-6000 30-38-38-96OS: Windows 11 22H2Driver: 531.41Resizable BAR: enabledHVCI: enabled |
| Gaming suite 2023 / Returnal / 2560x1440 / Epic / Rendering unreported / RT off | 122.1 FPS Base GPU test: Nvidia GeForce RTX 3080 Ti Settings: Episch-PresetVRAM: 12 GBTest CPU: AMD Ryzen 9 7950X3DSystem RAM: 32 GB DDR5-6000 30-38-38-96OS: Windows 11 22H2Driver: 531.41Resizable BAR: enabledHVCI: enabled |
| Gaming suite 2023 / Returnal / 2560x1440 / Epic / Rendering unreported / RT on | 100.7 FPS Base GPU test: Nvidia GeForce RTX 3080 Ti Settings: Episch-Preset; RT: Reflexionen „Episch“, Schatten „Mittel“VRAM: 12 GBTest CPU: AMD Ryzen 9 7950X3DSystem RAM: 32 GB DDR5-6000 30-38-38-96OS: Windows 11 22H2Driver: 531.41Resizable BAR: enabledHVCI: enabled |
| Gaming suite 2023 / Spider-Man: Miles Morales / 2560x1440 / Very high / Rendering unreported / RT off | 100.7 FPS Base GPU test: Nvidia GeForce RTX 3080 Ti Settings: Sehr-hoch-Preset, 16-faches AF, Schatten „Sehr hoch“, Detailstufe „Sehr hoch“VRAM: 12 GBTest CPU: AMD Ryzen 9 7950X3DSystem RAM: 32 GB DDR5-6000 30-38-38-96OS: Windows 11 22H2Driver: 531.41Resizable BAR: enabledHVCI: enabled |
| Gaming suite 2023 / Spider-Man: Miles Morales / 2560x1440 / Very high / Rendering unreported / RT on | 78.7 FPS Base GPU test: Nvidia GeForce RTX 3080 Ti Settings: Sehr-hoch-Preset, 16-faches AF, Schatten „Sehr hoch“, Detailstufe „Sehr hoch“; RT: Reflexionen Auflösung „Hoch“, Geometrie „Sehr hoch“, Sichtweite 10, Schatten „Mittel“VRAM: 12 GBTest CPU: AMD Ryzen 9 7950X3DSystem RAM: 32 GB DDR5-6000 30-38-38-96OS: Windows 11 22H2Driver: 531.41Resizable BAR: enabledHVCI: enabled |
| Gaming suite 2023 / The Callisto Protocol / 2560x1440 / Ultra / Rendering unreported / RT off | 132.9 FPS Base GPU test: Nvidia GeForce RTX 3080 Ti Settings: Ultra-PresetVRAM: 12 GBTest CPU: AMD Ryzen 9 7950X3DSystem RAM: 32 GB DDR5-6000 30-38-38-96OS: Windows 11 22H2Driver: 531.41Resizable BAR: enabledHVCI: enabled |
| Gaming suite 2023 / The Callisto Protocol / 2560x1440 / Ultra / Rendering unreported / RT on | 83.6 FPS Base GPU test: Nvidia GeForce RTX 3080 Ti Settings: Ultra-Preset; RT: Reflexionen „Mittel“, Schatten „Ein“, Übertragung „Ein“VRAM: 12 GBTest CPU: AMD Ryzen 9 7950X3DSystem RAM: 32 GB DDR5-6000 30-38-38-96OS: Windows 11 22H2Driver: 531.41Resizable BAR: enabledHVCI: enabled |
| Gaming suite 2023 / The Last of Us Part I / 2560x1440 / Ultra / Rendering unreported / RT off | 66.8 FPS Base GPU test: Nvidia GeForce RTX 3080 Ti Settings: Ultra-PresetVRAM: 12 GBTest CPU: AMD Ryzen 9 7950X3DSystem RAM: 32 GB DDR5-6000 30-38-38-96OS: Windows 11 22H2Driver: 531.41Resizable BAR: enabledHVCI: enabled |
| Gaming suite 2023 / The Witcher 3 / 2560x1440 / Highest / Rendering unreported / RT off | 102.7 FPS Base GPU test: Nvidia GeForce RTX 3080 Ti Settings: Höchste-Preset, Höchste+-Details, kein HWVRAM: 12 GBTest CPU: AMD Ryzen 9 7950X3DSystem RAM: 32 GB DDR5-6000 30-38-38-96OS: Windows 11 22H2Driver: 531.41Resizable BAR: enabledHVCI: enabled |
| Gaming suite 2023 / The Witcher 3 / 2560x1440 / Highest / Rendering unreported / RT on | 61 FPS Base GPU test: Nvidia GeForce RTX 3080 Ti Settings: Höchste-Preset, Höchste+-Details, kein HW; RT: GI „Performance“, Reflexionen „Ein“VRAM: 12 GBTest CPU: AMD Ryzen 9 7950X3DSystem RAM: 32 GB DDR5-6000 30-38-38-96OS: Windows 11 22H2Driver: 531.41Resizable BAR: enabledHVCI: enabled |
| Gaming suite 2023 / Uncharted / 2560x1440 / Ultra / Rendering unreported / RT off | 91.5 FPS Base GPU test: Nvidia GeForce RTX 3080 Ti Settings: Ultra-PresetVRAM: 12 GBTest CPU: AMD Ryzen 9 7950X3DSystem RAM: 32 GB DDR5-6000 30-38-38-96OS: Windows 11 22H2Driver: 531.41Resizable BAR: enabledHVCI: enabled |
| Gaming suite 2023 / A Plague Tale: Requiem / 3840x2160 / Ultra / Ultra Quality / RT off | 52 FPS Base GPU test: Nvidia GeForce RTX 3080 Ti Settings: Ultra-Preset, Auflösungsoptimierung „Ultra-Quality“VRAM: 12 GBTest CPU: AMD Ryzen 9 7950X3DSystem RAM: 32 GB DDR5-6000 30-38-38-96OS: Windows 11 22H2Driver: 531.41Resizable BAR: enabledHVCI: enabled |
| Gaming suite 2023 / Atomic Heart / 3840x2160 / Atomic / Rendering unreported / RT off | 62.5 FPS Base GPU test: Nvidia GeForce RTX 3080 Ti Settings: Atomic-PresetVRAM: 12 GBTest CPU: AMD Ryzen 9 7950X3DSystem RAM: 32 GB DDR5-6000 30-38-38-96OS: Windows 11 22H2Driver: 531.41Resizable BAR: enabledHVCI: enabled |
| Gaming suite 2023 / Call of Duty: Modern Warfare 2 / 3840x2160 / Ultra / Rendering unreported / RT off | 53.6 FPS Base GPU test: Nvidia GeForce RTX 3080 Ti Settings: Ultra-Preset, Tessellation „Alle“, Shadow-Maps „Extra“, Wetter „Ultra“VRAM: 12 GBTest CPU: AMD Ryzen 9 7950X3DSystem RAM: 32 GB DDR5-6000 30-38-38-96OS: Windows 11 22H2Driver: 531.41Resizable BAR: enabledHVCI: enabled |
| Gaming suite 2023 / Company of Heroes 3 / 3840x2160 / Maximum / Rendering unreported / RT off | 71 FPS Base GPU test: Nvidia GeForce RTX 3080 Ti Settings: Maximale GrafikdetailsVRAM: 12 GBTest CPU: AMD Ryzen 9 7950X3DSystem RAM: 32 GB DDR5-6000 30-38-38-96OS: Windows 11 22H2Driver: 531.41Resizable BAR: enabledHVCI: enabled |
| Gaming suite 2023 / Cyberpunk 2077 / 3840x2160 / Medium / Rendering unreported / RT off | 53 FPS Base GPU test: Nvidia GeForce RTX 3080 Ti Settings: Mittel-PresetVRAM: 12 GBTest CPU: AMD Ryzen 9 7950X3DSystem RAM: 32 GB DDR5-6000 30-38-38-96OS: Windows 11 22H2Driver: 531.41Resizable BAR: enabledHVCI: enabled |
| Gaming suite 2023 / Cyberpunk 2077 / 3840x2160 / Medium / Rendering unreported / RT on | 26.2 FPS Base GPU test: Nvidia GeForce RTX 3080 Ti Settings: Mittel-Preset; RT: GI „Mittel“, Schatten „Ein“VRAM: 12 GBTest CPU: AMD Ryzen 9 7950X3DSystem RAM: 32 GB DDR5-6000 30-38-38-96OS: Windows 11 22H2Driver: 531.41Resizable BAR: enabledHVCI: enabled |
| Gaming suite 2023 / Dead Space / 3840x2160 / Ultra / Rendering unreported / RT off | 52.4 FPS Base GPU test: Nvidia GeForce RTX 3080 Ti Settings: Ultra-PresetVRAM: 12 GBTest CPU: AMD Ryzen 9 7950X3DSystem RAM: 32 GB DDR5-6000 30-38-38-96OS: Windows 11 22H2Driver: 531.41Resizable BAR: enabledHVCI: enabled |
| Gaming suite 2023 / Dead Space / 3840x2160 / Ultra / Rendering unreported / RT on | 45.9 FPS Base GPU test: Nvidia GeForce RTX 3080 Ti Settings: Ultra-Preset; RT: AO „Ein“VRAM: 12 GBTest CPU: AMD Ryzen 9 7950X3DSystem RAM: 32 GB DDR5-6000 30-38-38-96OS: Windows 11 22H2Driver: 531.41Resizable BAR: enabledHVCI: enabled |
| Gaming suite 2023 / Dying Light 2 / 3840x2160 / High / Rendering unreported / RT off | 59.3 FPS Base GPU test: Nvidia GeForce RTX 3080 Ti Settings: Hohe-Qualität-PresetVRAM: 12 GBTest CPU: AMD Ryzen 9 7950X3DSystem RAM: 32 GB DDR5-6000 30-38-38-96OS: Windows 11 22H2Driver: 531.41Resizable BAR: enabledHVCI: enabled |
| Gaming suite 2023 / Dying Light 2 / 3840x2160 / High / Rendering unreported / RT on | 36.9 FPS Base GPU test: Nvidia GeForce RTX 3080 Ti Settings: Hohe-Qualität-Preset; RT: GI + AO „Ein“VRAM: 12 GBTest CPU: AMD Ryzen 9 7950X3DSystem RAM: 32 GB DDR5-6000 30-38-38-96OS: Windows 11 22H2Driver: 531.41Resizable BAR: enabledHVCI: enabled |
| Gaming suite 2023 / F1 22 / 3840x2160 / Ultra high / Rendering unreported / RT off | 119.3 FPS Base GPU test: Nvidia GeForce RTX 3080 Ti Settings: Ultrahoch-PresetVRAM: 12 GBTest CPU: AMD Ryzen 9 7950X3DSystem RAM: 32 GB DDR5-6000 30-38-38-96OS: Windows 11 22H2Driver: 531.41Resizable BAR: enabledHVCI: enabled |
| Gaming suite 2023 / F1 22 / 3840x2160 / Ultra high / Rendering unreported / RT on | 66.1 FPS Base GPU test: Nvidia GeForce RTX 3080 Ti Settings: Ultrahoch-Preset; RT: Reflexionen (Voll) + Schatten + AO „Mittel“VRAM: 12 GBTest CPU: AMD Ryzen 9 7950X3DSystem RAM: 32 GB DDR5-6000 30-38-38-96OS: Windows 11 22H2Driver: 531.41Resizable BAR: enabledHVCI: enabled |
| Gaming suite 2023 / Forspoken / 3840x2160 / High / Rendering unreported / RT off | 46.8 FPS Base GPU test: Nvidia GeForce RTX 3080 Ti Settings: Hoch-PresetVRAM: 12 GBTest CPU: AMD Ryzen 9 7950X3DSystem RAM: 32 GB DDR5-6000 30-38-38-96OS: Windows 11 22H2Driver: 531.41Resizable BAR: enabledHVCI: enabled |
| Gaming suite 2023 / Forspoken / 3840x2160 / High / Rendering unreported / RT on | 34 FPS Base GPU test: Nvidia GeForce RTX 3080 Ti Settings: Hoch-Preset; RT: Schatten + AO „Ein“VRAM: 12 GBTest CPU: AMD Ryzen 9 7950X3DSystem RAM: 32 GB DDR5-6000 30-38-38-96OS: Windows 11 22H2Driver: 531.41Resizable BAR: enabledHVCI: enabled |
| Gaming suite 2023 / Hogwarts Legacy / 3840x2160 / Ultra / Rendering unreported / RT off | 43.9 FPS Base GPU test: Nvidia GeForce RTX 3080 Ti Settings: Ultra-PresetVRAM: 12 GBTest CPU: AMD Ryzen 9 7950X3DSystem RAM: 32 GB DDR5-6000 30-38-38-96OS: Windows 11 22H2Driver: 531.41Resizable BAR: enabledHVCI: enabled |
| Gaming suite 2023 / Hogwarts Legacy / 3840x2160 / Ultra / Rendering unreported / RT on | 40.4 FPS Base GPU test: Nvidia GeForce RTX 3080 Ti Settings: Ultra-Preset; RT: Reflexionen „Ultra“VRAM: 12 GBTest CPU: AMD Ryzen 9 7950X3DSystem RAM: 32 GB DDR5-6000 30-38-38-96OS: Windows 11 22H2Driver: 531.41Resizable BAR: enabledHVCI: enabled |
| Gaming suite 2023 / Metro Exodus PC Enhanced Edition / 3840x2160 / Extreme / Rendering unreported / RT on | 46.1 FPS Base GPU test: Nvidia GeForce RTX 3080 Ti Settings: Extrem-Qualität, kein HW, kein PhysX; RT: „Hoch“ + ReflexionenVRAM: 12 GBTest CPU: AMD Ryzen 9 7950X3DSystem RAM: 32 GB DDR5-6000 30-38-38-96OS: Windows 11 22H2Driver: 531.41Resizable BAR: enabledHVCI: enabled |
| Gaming suite 2023 / Resident Evil 4 / 3840x2160 / Maximum / Rendering unreported / RT off | 69.5 FPS Base GPU test: Nvidia GeForce RTX 3080 Ti Settings: Maximum-PresetVRAM: 12 GBTest CPU: AMD Ryzen 9 7950X3DSystem RAM: 32 GB DDR5-6000 30-38-38-96OS: Windows 11 22H2Driver: 531.41Resizable BAR: enabledHVCI: enabled |
| Gaming suite 2023 / Resident Evil 4 / 3840x2160 / Maximum / Rendering unreported / RT on | 68 FPS Base GPU test: Nvidia GeForce RTX 3080 Ti Settings: Maximum-Preset; RT: Reflexionen „Hoch“VRAM: 12 GBTest CPU: AMD Ryzen 9 7950X3DSystem RAM: 32 GB DDR5-6000 30-38-38-96OS: Windows 11 22H2Driver: 531.41Resizable BAR: enabledHVCI: enabled |
| Gaming suite 2023 / Returnal / 3840x2160 / Epic / Rendering unreported / RT off | 71.8 FPS Base GPU test: Nvidia GeForce RTX 3080 Ti Settings: Episch-PresetVRAM: 12 GBTest CPU: AMD Ryzen 9 7950X3DSystem RAM: 32 GB DDR5-6000 30-38-38-96OS: Windows 11 22H2Driver: 531.41Resizable BAR: enabledHVCI: enabled |
| Gaming suite 2023 / Returnal / 3840x2160 / Epic / Rendering unreported / RT on | 55.5 FPS Base GPU test: Nvidia GeForce RTX 3080 Ti Settings: Episch-Preset; RT: Reflexionen „Episch“, Schatten „Mittel“VRAM: 12 GBTest CPU: AMD Ryzen 9 7950X3DSystem RAM: 32 GB DDR5-6000 30-38-38-96OS: Windows 11 22H2Driver: 531.41Resizable BAR: enabledHVCI: enabled |
| Gaming suite 2023 / Spider-Man: Miles Morales / 3840x2160 / Very high / Rendering unreported / RT off | 62.3 FPS Base GPU test: Nvidia GeForce RTX 3080 Ti Settings: Sehr-hoch-Preset, 16-faches AF, Schatten „Sehr hoch“, Detailstufe „Sehr hoch“VRAM: 12 GBTest CPU: AMD Ryzen 9 7950X3DSystem RAM: 32 GB DDR5-6000 30-38-38-96OS: Windows 11 22H2Driver: 531.41Resizable BAR: enabledHVCI: enabled |
| Gaming suite 2023 / Spider-Man: Miles Morales / 3840x2160 / Very high / Rendering unreported / RT on | 49.2 FPS Base GPU test: Nvidia GeForce RTX 3080 Ti Settings: Sehr-hoch-Preset, 16-faches AF, Schatten „Sehr hoch“, Detailstufe „Sehr hoch“; RT: Reflexionen Auflösung „Hoch“, Geometrie „Sehr hoch“, Sichtweite 10, Schatten „Mittel“VRAM: 12 GBTest CPU: AMD Ryzen 9 7950X3DSystem RAM: 32 GB DDR5-6000 30-38-38-96OS: Windows 11 22H2Driver: 531.41Resizable BAR: enabledHVCI: enabled |
| Gaming suite 2023 / The Callisto Protocol / 3840x2160 / Ultra / Rendering unreported / RT off | 88.2 FPS Base GPU test: Nvidia GeForce RTX 3080 Ti Settings: Ultra-PresetVRAM: 12 GBTest CPU: AMD Ryzen 9 7950X3DSystem RAM: 32 GB DDR5-6000 30-38-38-96OS: Windows 11 22H2Driver: 531.41Resizable BAR: enabledHVCI: enabled |
| Gaming suite 2023 / The Callisto Protocol / 3840x2160 / Ultra / Rendering unreported / RT on | 50.9 FPS Base GPU test: Nvidia GeForce RTX 3080 Ti Settings: Ultra-Preset; RT: Reflexionen „Mittel“, Schatten „Ein“, Übertragung „Ein“VRAM: 12 GBTest CPU: AMD Ryzen 9 7950X3DSystem RAM: 32 GB DDR5-6000 30-38-38-96OS: Windows 11 22H2Driver: 531.41Resizable BAR: enabledHVCI: enabled |
| Gaming suite 2023 / The Last of Us Part I / 3840x2160 / High / Rendering unreported / RT off | 54.3 FPS Base GPU test: Nvidia GeForce RTX 3080 Ti Settings: Hoch-PresetVRAM: 12 GBTest CPU: AMD Ryzen 9 7950X3DSystem RAM: 32 GB DDR5-6000 30-38-38-96OS: Windows 11 22H2Driver: 531.41Resizable BAR: enabledHVCI: enabled |
| Gaming suite 2023 / The Witcher 3 / 3840x2160 / High / Rendering unreported / RT off | 56.3 FPS Base GPU test: Nvidia GeForce RTX 3080 Ti Settings: Hoch-PresetVRAM: 12 GBTest CPU: AMD Ryzen 9 7950X3DSystem RAM: 32 GB DDR5-6000 30-38-38-96OS: Windows 11 22H2Driver: 531.41Resizable BAR: enabledHVCI: enabled |
| Gaming suite 2023 / The Witcher 3 / 3840x2160 / High / Rendering unreported / RT on | 36.1 FPS Base GPU test: Nvidia GeForce RTX 3080 Ti Settings: Hoch-Preset; RT: GI „Performance“, Reflexionen „Ein“VRAM: 12 GBTest CPU: AMD Ryzen 9 7950X3DSystem RAM: 32 GB DDR5-6000 30-38-38-96OS: Windows 11 22H2Driver: 531.41Resizable BAR: enabledHVCI: enabled |
| Gaming suite 2023 / Uncharted / 3840x2160 / Ultra / Rendering unreported / RT off | 66.3 FPS Base GPU test: Nvidia GeForce RTX 3080 Ti Settings: Ultra-PresetVRAM: 12 GBTest CPU: AMD Ryzen 9 7950X3DSystem RAM: 32 GB DDR5-6000 30-38-38-96OS: Windows 11 22H2Driver: 531.41Resizable BAR: enabledHVCI: enabled |
| Gaming suite 2023 / Cyberpunk 2077 / 3840x2160 / Medium / DLSS 2.x/FSR 2.x Quality / RT on | 45.3 FPS Base GPU test: Nvidia GeForce RTX 3080 Ti Settings: Mittel-Preset; RT: GI „Mittel“, Schatten „Ein“VRAM: 12 GBTest CPU: AMD Ryzen 9 7950X3DSystem RAM: 32 GB DDR5-6000 30-38-38-96OS: Windows 11 22H2Rendering: DLSS 2.x QualityDriver: 531.41Resizable BAR: enabledHVCI: enabled |
| Gaming suite 2023 / Dead Space / 3840x2160 / Ultra / DLSS 2.x/FSR 2.x Quality / RT on | 73.1 FPS Base GPU test: Nvidia GeForce RTX 3080 Ti Settings: Ultra-Preset; RT: AO „Ein“VRAM: 12 GBTest CPU: AMD Ryzen 9 7950X3DSystem RAM: 32 GB DDR5-6000 30-38-38-96OS: Windows 11 22H2Rendering: DLSS 2.x QualityDriver: 531.41Resizable BAR: enabledHVCI: enabled |
| Gaming suite 2023 / Dying Light 2 / 3840x2160 / High / DLSS 2.x/FSR 2.x Quality / RT on | 64.2 FPS Base GPU test: Nvidia GeForce RTX 3080 Ti Settings: Hohe-Qualität-Preset; RT: GI + AO „Ein“VRAM: 12 GBTest CPU: AMD Ryzen 9 7950X3DSystem RAM: 32 GB DDR5-6000 30-38-38-96OS: Windows 11 22H2Rendering: DLSS 2.x QualityDriver: 531.41Resizable BAR: enabledHVCI: enabled |
| Gaming suite 2023 / F1 22 / 3840x2160 / Ultra high / DLSS 2.x/FSR 2.x Quality / RT on | 103.4 FPS Base GPU test: Nvidia GeForce RTX 3080 Ti Settings: Ultrahoch-Preset; RT: Reflexionen (Voll) + Schatten + AO „Mittel“VRAM: 12 GBTest CPU: AMD Ryzen 9 7950X3DSystem RAM: 32 GB DDR5-6000 30-38-38-96OS: Windows 11 22H2Rendering: DLSS 2.x QualityDriver: 531.41Resizable BAR: enabledHVCI: enabled |
| Gaming suite 2023 / Forspoken / 3840x2160 / High / DLSS 2.x/FSR 2.x Quality / RT on | 52.7 FPS Base GPU test: Nvidia GeForce RTX 3080 Ti Settings: Hoch-Preset; RT: Schatten + AO „Ein“VRAM: 12 GBTest CPU: AMD Ryzen 9 7950X3DSystem RAM: 32 GB DDR5-6000 30-38-38-96OS: Windows 11 22H2Rendering: DLSS 2.x QualityDriver: 531.41Resizable BAR: enabledHVCI: enabled |
| Gaming suite 2023 / Hogwarts Legacy / 3840x2160 / Ultra / DLSS 2.x/FSR 2.x Quality / RT on | 64.2 FPS Base GPU test: Nvidia GeForce RTX 3080 Ti Settings: Ultra-Preset; RT: Reflexionen „Ultra“VRAM: 12 GBTest CPU: AMD Ryzen 9 7950X3DSystem RAM: 32 GB DDR5-6000 30-38-38-96OS: Windows 11 22H2Rendering: DLSS 2.x QualityDriver: 531.41Resizable BAR: enabledHVCI: enabled |
| Gaming suite 2023 / Spider-Man: Miles Morales / 3840x2160 / Very high / DLSS 2.x/FSR 2.x Quality / RT on | 69.4 FPS Base GPU test: Nvidia GeForce RTX 3080 Ti Settings: Sehr-hoch-Preset, 16-faches AF, Schatten „Sehr hoch“, Detailstufe „Sehr hoch“; RT: Reflexionen Auflösung „Hoch“, Geometrie „Sehr hoch“, Sichtweite 10, Schatten „Mittel“VRAM: 12 GBTest CPU: AMD Ryzen 9 7950X3DSystem RAM: 32 GB DDR5-6000 30-38-38-96OS: Windows 11 22H2Rendering: DLSS 2.x QualityDriver: 531.41Resizable BAR: enabledHVCI: enabled |
| Gaming suite 2023 / The Witcher 3 / 3840x2160 / High / DLSS 2.x/FSR 2.x Quality / RT on | 56.7 FPS Base GPU test: Nvidia GeForce RTX 3080 Ti Settings: Hoch-Preset; RT: GI „Performance“, Reflexionen „Ein“VRAM: 12 GBTest CPU: AMD Ryzen 9 7950X3DSystem RAM: 32 GB DDR5-6000 30-38-38-96OS: Windows 11 22H2Rendering: DLSS 2.x QualityDriver: 531.41Resizable BAR: enabledHVCI: enabled |
A base GPU test is a reference for cards using that GPU and the same memory capacity. Board overclocking, cooling and power limits can change the result.
Comparez les scores des benchmarks les plus populaires KFA2 GeForce RTX 3080 Ti HOF Premium avec d'autres cartes graphiques pour connaître la vitesse réelle du GPU lors du traitement du contenu.
Les tests comprennent le travail avec la virgule flottante, la création de modèles 3D, le minage de crypto-monnaies, etc.
These are saved results from the earlier catalog. Measurement dates and test configurations were not recorded. Models with no comparable results are omitted.
Recent models: test results with identified primary sources — Game frame rates
Archived results. The original measurement method and test conditions have not been verified.
Higher values are better in this metric.
Higher values are better in this metric.
Higher values are better in this metric.
Higher values are better in this metric.
Higher values are better in this metric.
Higher values are better in this metric.
Higher values are better in this metric.
These are saved results from the earlier catalog. Measurement dates and test configurations were not recorded. Models with no comparable results are omitted. Index 0–100: equal-weight mean of each score relative to the best saved score among models with both tests. Tests: Battlefield 5 + Shadow of the Tomb Raider. This index does not predict performance in every workload.
Recent models: test results with identified primary sources — Game frame rates
*
Base Clock is the base GPU frequency stated by the manufacturer for this model.
Boost Clock describes automatic frequency increases. Actual clock speed varies with workload, temperature and power limits; it is not a guarantee of manual overclocking.


 English
 Russian
 German
 Portuguese
 Italian
 Japan
Japan Spanish
 Polish
 Chinese
 Korean